219 Rosewall St · Hot Springs, AR
Flood risk 5/10 · Moderate
- FEMA flood zone
- X (unshaded)
- Chance of flooding over 30 yrs
- 0.65%
- Est. flood insurance / yr
- $507 – $1,088
Fire risk 3/10 · Minor
- Est. fire insurance / yr
- $1,499 – $2,785
Heat risk 6/10 · Moderate
- Hot days now (above 111°F)
- 7 days/yr
- Hot days in 30 yrs
- 21 days/yr
Wind risk 4/10 · Minor
- Chance of severe wind over 30 yrs
- 9.0%
Air-quality risk 1/10 · Minimal
- Unhealthy air days now
- 0 days/yr
- Unhealthy air days in 30 yrs
- 0 days/yr
Risk factors via First Street. Map © Google.
Why this score? — see what drove the B grade
The composite is a weighted blend of 9 inputs, each scored 0–100. Each bar is that input's sub-score; the figure is the points it added to the 100-point composite (weight × sub-score).
- Cash flow +30.0/30.0
- ARV discount +15.0/15.0
- 1% rule +10.0/10.0
- DSCR +10.0/10.0
- Livability +3.2/5.0
- Rent growth +2.5/5.0
- Schools +2.0/10.0
- Condition / age +1.0/5.0
- Appreciation +0.0/10.0
$55,500
🖨 Deal sheet (PDF) 📄 Offer letter ✓ Due diligence
Listing remarks MLS
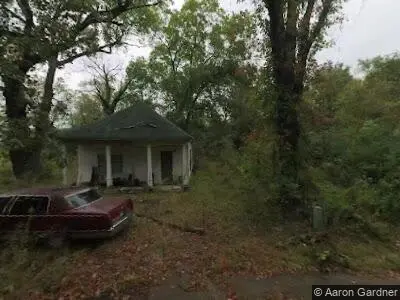
In the process of being renovated. More work to be done! Interior studded out (some rooms with drywall, others not), and all new electrical has been run throughout house and out to breaker panel. Needs roof. Several established fruit trees in yard. Very near to hiking trails and downtown Hot Springs amenities! Walk to the nearest water fill station to enjoy world famous Hot Springs water! Seller offers a concession of $15,000 for roof and other work. Creative financing may be available for qualified buyers. Inquire via email.
Key facts
- Hiking trails
- Built 2018
- Listed 34 days
Tags
Neighborhood map
What this means for you Summary
Snapshot
- This is a 2-bed/1.0-bath single-family listed at $56k. Condition is rated poor.
Deal economics
- At list price, monthly cash flow is $507 ($6k/yr) — positive.
- The deal already cash-flows at list — no discount required.
- Meets the 1% rule at list price ($1k rent vs $56k).
- Recommended offer: $54k (3.0% below list) — sets the bar for market timing.
- Cap rate 17.3% vs local median 2.8% in Hot Springs — top-decile yield for the area; either an underpriced asset or a hidden risk that comps aren't pricing in. Stress-test before assuming the spread holds.
Location & tenants
- Location reads 65/100 on livability (#140 in AR) — a middle-class / working-renter tenant base. Strengths: cost of living A+, housing A+, health & safety A-; Watch: crime F, amenities F, commute F.
- Hot Springs School District (urban): math 24% / reading 25% proficiency, ranked #195 of 238 in AR (top 82%) — low school quality limits family demand, transient renter base, plan for 1-2y turnover; 72% free/reduced lunch — lower-income household profile, screen leases tightly.
- Zoned schools: Hot Springs Junior Academy (math 20% / reading 29%, grade F, #166 of 201 statewide, top 84%, 815 students, 100% FRL, charter); Hot Springs World Class High School (math 12% / reading 24%, grade F, #252 of 292 statewide, top 87%, 739 students, 100% FRL, charter) — zoned schools average 100% FRL vs 72% district-wide (28 pts higher); higher-poverty schools than district average — tighter screening recommended.
- Market conditions: 363 active listings in the ZIP; 10 comparable units currently listed for rent nearby; rentals lingering (median 45d on market — plan ~5-8 weeks vacancy on turnover, expect pricing pressure); 80% of comp listings sitting > 30 days — soft ceiling on asking rent; 117 units permitted in Garland County in 2024 (24 in 5+ unit buildings).
Forward outlook
- Local home prices are declining (-3.0%/yr); year-one equity from $384 of loan paydown is wiped out by about $2k of value loss. Plan a longer hold.
- Garland County population projected at +7% by 2050 — modest demand growth; plan on rents tracking national, not racing it.
- At projected returns (-3.0% appreciation + 3.0% rent growth), your $16k cash investment doubles in ~3 years — after that, you're playing with house money.
Negotiation context
- It's been on market 34 days — a 3% lower offer ($54k) is reasonable based on typical stale-listing flexibility.
- 3 sale attempts since 4y ago with the ask held roughly flat each time — persistent listings suggest the price (not the market) is what's stuck; bring a comps-based counter.
- Current owner paid $15k; list at $56k implies a 270% gain — meaningful room to come down on a strong offer.
Risks & watch-outs
- Climate carrying-cost: moderate flood risk; extreme-heat days projected 7→21/yr by 2055 (HVAC capex compounding) — expect insurance premiums to compound above CPI over the hold.
Questions for the listing agent
- It's been on market 34 days. Have you received any prior offers? Is the seller open to a 3% concession, seller financing, or rate buy-down credit?
- Have any recent inspections been done? Can we get a copy of the seller's disclosures and any deferred-maintenance estimates?
- Is there a deadline driving the sale (1031 exchange, divorce, estate, relocation)? That informs how much negotiation room exists.
- Schools are D-rated, which usually means shorter tenancies and higher turnover. Who's the typical renter profile here, and what's been the actual vacancy rate?
- Crime grade is F in this area — have there been break-ins, vandalism, or insurance claims at this property in the last 3 years? What carrier currently insures it and at what premium?
- What's the average days-on-market for RENTAL listings here right now (not sales)? A rising rental-DOM trend means longer vacancies and softer asking-rent achievability than the comps imply.
- What's the recent tenant-quality profile in this submarket — average credit score on applications, eviction rate, late-payment / NSF rate, and stable-employment percentage? A property-management company in the area should have these aggregated.
- How much new for-sale + rental construction is in the pipeline within 1–3 miles? Heavy new supply typically softens prices + rents 12–24 months out; constrained supply supports both.
Investment metrics
- 1% rule
- 2.03% ✓
- Cap rate
- 17.26%
- Cash-on-cash
- 39.17%
- DSCR
- 2.74
- GRM
- 4.1
CMA / ARV
- ARV (on-the-fly)
- $90,816
- Comps found
- 5
Show comp detail 5 sales within ~0.75 mi
| Address | Dist | Beds/Ba | Sqft | Sold | Price | $/sf | Match |
|---|---|---|---|---|---|---|---|
| 200 Tennessee St St | 0.21mi | 2/1.0 | 989 (-6%) | 8mo | $45,000 | $46 | 73 |
| 112 Oklahoma St | 0.04mi | 3/1.0 (+1) | 1,178 (+12%) | 21mo | $134,742 | $114 | 56 |
| 102 Ivy St | 0.52mi | 2/1.0 | 1,099 (+4%) | 23mo | $95,000 | $86 | 50 |
| 213 Barrett St | 0.43mi | 3/2.0 (+1) | 1,136 (+8%) | 15mo | $145,000 | $128 | 45 |
| 126 Maiden St | 0.64mi | 3/1.0 (+1) | 1,214 (+15%) | 21mo | $79,900 | $66 | 23 |
Match score weights: distance 35% · size 25% · config 20% · recency 20%. Top-matched comps best support the ARV.
Projected returns pro-forma
-3.0% appreciation · 3.0% rent growth · sell at horizon
- IRR
- 35.4%
- Equity multiple
- 2.50×
- Total profit
- $23,333
- Equity at exit
- $8,275
- IRR
- 42.2%
- Equity multiple
- 4.99×
- Total profit
- $61,991
- Equity at exit
- $4,799
Cash invested: $15,540 (down + closing). Projections, not guarantees.
Landlord ↔ Tenant lean methodology
- Overall (STATE)
- 92 Strongly Landlord-Friendly
- State Arkansas
- 92 Strongly Landlord-Friendly · R+14
- County
- — inherits STATE
- City
- — inherits STATE
ZIP-level market 71901
- Home prices YoY
- -3.6%
- Active inventory
- 363
- Price-to-rent
- 4.1×
Monthly cashflow live
- Estimated rent
- $1,128 high interval (Pro) →
- Mortgage (P&I)
- −$291
- Tax est. 1.5%
- −$69 /mo · $832/yr
- Insurance
- −$23
- HOA
- −$0
- Vacancy / Maint / Mgmt
- −$237
- Net cashflow
- $507
Break-even live
Sensitivity live
| Price | -10% $546 | -5% $526 | +0% $507 | +5% $488 | +10% $469 |
|---|---|---|---|---|---|
| Rent | -10% $418 | -5% $463 | +0% $507 | +5% $552 | +10% $596 |
| Rate | -1.0pp $535 | -0.5pp $521 | base $507 | +0.5pp $493 | +1.0pp $478 |
UW: 25.0% down · 7.5% · 30yr · 1.5% tax · 5.0% vac · 8.0% maint · 8.0% mgmt
Financing live
Cash to close
- Down payment
- $13,875
- Closing costs
- $1,665
- Reserves months
- —
- Total cash needed
- —
Loan-product check · same deal, 3 products live
Conventional
25% down · 7.5% · 30yr
- Down + closing
- —
- Monthly P&I
- —
- Monthly cashflow
- —
- DSCR
- —
- Eligible?
- —
Personal DTI + credit; lowest rate.
DSCR
20% down · 8.5% · 30yr
- Down + closing
- —
- Monthly P&I
- —
- Monthly cashflow
- —
- DSCR
- —
- Eligible?
- —
No personal income docs; deal must DSCR.
Hard money
10% down · 12.0% · 12mo
- Down + closing
- —
- Monthly P&I
- —
- Monthly cashflow
- —
- DSCR
- —
- Eligible?
- —
Short-term bridge; refi at stabilization.
Rent comps 10 comps
| Address | Beds | Baths | Sqft | Rent | $/sqft | DOM | Units | Dist |
|---|---|---|---|---|---|---|---|---|
| 605 Hig Fry Rd Hot Springs National Park, AR | 2.0 | 1.0–2.0 | 806 | $1,400 | $1.74 | 25d | 1 | 0.56mi |
| 315 Convention Blvd Hot Springs, AR | 2.0 | 1.0 | 900 | $950 | $1.06 | 45d | 4 | 0.74mi |
| 405 Spring St Unit 2 Hot Springs, AR | 1.0 | 1.0 | 750 | $750 | $1.00 | 45d | 1 | 0.81mi |
| 125 Oak St Unit 1-402 Hot Springs, AR | 2.0 | 1.0 | 1150 | $1,475 | $1.28 | 45d | 1 | 1.15mi |
| 125 Oak St Unit 1-404 Hot Springs, AR | 1.0 | 1.0 | 783 | $1,175 | $1.50 | 45d | 1 | 1.15mi |
| 125 Oak St Unit 1-306 Hot Springs, AR | 2.0 | 1.0 | 970 | $1,200 | $1.24 | 45d | 1 | 1.15mi |
| 125 Oak St Unit 1-307 Hot Springs, AR | 2.0 | 1.0 | 1000 | $1,350 | $1.35 | 45d | 1 | 1.15mi |
| 106 Breeze St Hot Springs, AR | 1.0 | 1.0 | 900 | $850 | $0.94 | 25d | 1 | 1.35mi |
| 120 Greenway St Unit 1 Hot Springs, AR | 1.0 | 1.0 | 750 | $775 | $1.03 | 45d | 1 | 1.35mi |
| 627 Quapaw Ave Unit 2 Hot Springs, AR | 1.0 | 1.0 | 775 | $950 | $1.23 | 45d | 1 | 1.48mi |
Listing history 23 events
-
2026-06-22days on market $55,500 Active 34 DOM
-
2026-06-19days on market $55,500 Active 32 DOM
-
2026-06-18days on market $55,500 Active 31 DOM
-
2026-06-17days on market $55,500 Active 30 DOM
-
2026-06-16days on market $55,500 Active 29 DOM
-
2026-06-15days on market $55,500 Active 28 DOM
-
2026-06-14days on market $55,500 Active 26 DOM
-
2026-06-13days on market $55,500 Active 25 DOM
-
2026-06-10days on market $55,500 Active 23 DOM
-
2026-06-09days on market $55,500 Active 22 DOM
-
2026-06-08days on market $55,500 Active 21 DOM
-
2026-06-07days on market $55,500 Active 20 DOM
-
2026-06-05days on market $55,500 Active 17 DOM
-
2026-06-02days on market $55,500 Active 15 DOM
-
2026-06-01days on market $55,500 Active 14 DOM
-
2026-05-31days on market $55,500 Active 13 DOM
-
2026-05-30days on market $55,500 Active 12 DOM
-
2026-05-18$55,500 Active
Show marketing remark (534 chars)
In the process of being renovated. More work to be done! Interior studded out (some rooms with drywall, others not), and all new electrical has been run throughout house and out to breaker panel. Needs roof. Several established fruit trees in yard. Very near to hiking trails and downtown Hot Springs amenities! Walk to the nearest water fill station to enjoy world famous Hot Springs water! Seller offers a concession of $15,000 for roof and other work. Creative financing may be available for qualified buyers. Inquire via email.
-
2022-10-07soldstatus $15,000 Sold 469-char remark
Show marketing remark (469 chars)
Remodel ready to be completed. Home has been stripped down to studs in most places. New addition added to back of home with metal roof over that section. New electric ran throughout. New vinyl windows, most are still covered by wood siding from exterior. All updates have been permitted. House is a shell. Front portion of home is on a slab. This could be a cash flowing investment property. Will need a flashlight to view. No disclosure seller has never lived in home.
-
2022-10-07soldstatus $15,000 469-char remark
Show marketing remark (469 chars)
Remodel ready to be completed. Home has been stripped down to studs in most places. New addition added to back of home with metal roof over that section. New electric ran throughout. New vinyl windows, most are still covered by wood siding from exterior. All updates have been permitted. House is a shell. Front portion of home is on a slab. This could be a cash flowing investment property. Will need a flashlight to view. No disclosure seller has never lived in home.
-
2022-10-04status Under Contract 469-char remark
Show marketing remark (469 chars)
Remodel ready to be completed. Home has been stripped down to studs in most places. New addition added to back of home with metal roof over that section. New electric ran throughout. New vinyl windows, most are still covered by wood siding from exterior. All updates have been permitted. House is a shell. Front portion of home is on a slab. This could be a cash flowing investment property. Will need a flashlight to view. No disclosure seller has never lived in home.
-
2022-10-03$18,000 469-char remark
-
2022-09-03$18,000 New Listing 469-char remark
Show marketing remark (469 chars)
Remodel ready to be completed. Home has been stripped down to studs in most places. New addition added to back of home with metal roof over that section. New electric ran throughout. New vinyl windows, most are still covered by wood siding from exterior. All updates have been permitted. House is a shell. Front portion of home is on a slab. This could be a cash flowing investment property. Will need a flashlight to view. No disclosure seller has never lived in home.
ⓘ Source: listings_history table (triggers on properties + properties_extension) + one-shot
backfill from property_details.listing_events for pre-trigger history.
Climate risk First Street
- Flood 5/10 Major FEMA zone X (unshaded) · 65% chance over 30 yrs
- Wildfire 3/10 Moderate
- Heat 6/10 Major 7 d/yr ≥111°F today · 21 d/yr by 30 yrs out
- Wind 4/10 Moderate 9% chance of damaging wind over 30 yrs
- Air quality 1/10 Low 0 unhealthy d/yr today · 0 by 30 yrs out
Nearby sold comps map
Loading sold comps map…
Walkable amenities ~0.75 mi
Loading nearby amenities…
Taxation est. · year 1
- Rental income
- $13,532
- − Mortgage interest
- −$3,109
- − Property taxes
- −$832
- − Insurance
- −$278
- − Repairs & maintenance
- −$1,083
- − Management
- −$1,083
- − Depreciation
- −$1,615
- Taxable income
- $5,533
- Est. tax owed @ 24.0%
- −$1,328
- After-tax cash flow
- $4,759/yr
For passive investors: Depreciation is non-cash, so a rental often shows a tax loss while cash-flowing — sheltering income. Rental losses are passive: they offset passive income freely, and up to $25,000/yr can offset ordinary (W-2) income if you actively participate and your MAGI is under $100k (phasing out to $0 by $150k); unused losses carry forward. On sale, claimed depreciation is recaptured at up to 25%, and gains may owe capital-gains tax (a 1031 exchange can defer both). Figures are a year-1 estimate at your 24.0% rate — not tax advice; consult a CPA.
Condition & rehab AI · 1 photo
This property requires extensive repairs and maintenance, including roof, exterior, and interior work. Significant improvements are needed to make it move-in ready and increase its value.
Repairs flagged
- Major roof — Significant damage visible
- Major exterior siding — Overgrown vegetation and debris
- Major flooring — Damaged and in poor condition
- Major interior walls — Damaged and in poor condition
- Major bathrooms — Damaged and in poor condition
- Major kitchen — Damaged and in poor condition
- Major HVAC/mechanicals — Damaged and in poor condition
Value-add opportunities
- Both landscaping and exterior repairs — Improves curb appeal and property value
- Both roof repair — Essential for structural integrity and safety
- Both interior repairs and updates — Enhances living space and appeal
Renovation cost estimate screening
| Repair item | Severity | Est. cost |
|---|---|---|
| roof · Significant damage visible | Major | $15,000–50,000 |
| exterior siding · Overgrown vegetation and debris | Major | $15,000–50,000 |
| flooring · Damaged and in poor condition | Major | $15,000–50,000 |
| interior walls · Damaged and in poor condition | Major | $15,000–50,000 |
| bathrooms · Damaged and in poor condition | Major | $15,000–50,000 |
| kitchen · Damaged and in poor condition | Major | $15,000–50,000 |
| HVAC/mechanicals · Damaged and in poor condition | Major | $15,000–50,000 |
| Total estimated repair cost · 7 items | $105,000–350,000 |
Value-add ROI direction
- Both landscaping and exterior repairs — Improves curb appeal and property value ↑
- Both roof repair — Essential for structural integrity and safety ↑
- Both interior repairs and updates — Enhances living space and appeal ↑
ⓘ Cost ranges are severity-bucket heuristics (US national rule-of-thumb). Get contractor quotes + a written scope before underwriting a rehab budget.
Schools (NCES district)
- District
- Hot Springs School District
- NCES district ID
- 0507890
- Math proficiency
- 24% ▼ -15.00%
- Reading proficiency
- 25% ▼ -12.00%
- Median HH income
- $28,817
- Composite
- 19.62/100
- National rank
- #8746
- State rank
- #195 of 238 in AR
Livability — Hot Springs
- Score
- 65/100
- State rank
- #140
- US rank
- #12498
Category grades
Schools grade is shown separately in the Schools card above.
Census & demographics
- Census place
- Hot Springs, AR
- County
- Garland County · 76,414 people
- City population
- 76,414
- Metro
- Hot Springs, AR
- Population (ZIP)
- 28,937
- Household income
- $53,514
- Rent vs Own
- Severe rent burden
- 961.0
Population outlook (Garland County) Hauer SSP2
- Today (2025)
- 100,343 people
- By 2030
- 101,880 · +1.5%
- By 2040
- 104,804 · +4.4%
- By 2050
- 107,292 · +6.9%
- By 2075
- 113,182 · +12.8%
- By 2100
- 112,247 · +11.9%
Race, ethnicity, and origin ACS 2023
- Neighborhood character
- Predominantly White (71%)
- Race & ethnicity
- White 71% Black 13% Hispanic / Latino 10% Two or more races 6%
- Hispanic origin (detail)
- Mexican 7%
- Common ancestry
- Italian 2% Slovak 2% Portuguese 1%
- Foreign-born
- 5% · Canada, Vietnam
- Languages at home
- 90% English-only · Spanish 7% Vietnamese 1%
Political lean MEDSL · Garland
- 2024 margin
- Solid R (+36.2) · D 30.8% · R 67.0% · Other 2.2%
- 2008→2024 swing
- -11.3pp toward R · 2008: -25.0pp · 2024: -36.2pp
- All cycles
- 2024: R+36.2 2020: R+34.0 2016: R+34.1 2012: R+29.9 2008: R+25.0
Not yet ingested
- Civics
- —
Market trends
- HPI YoY
- ▼ -11.75%
- Current HPI
- 317.2542
- Rent YoY
- —
- Metro
- Hot Springs, AR
- State GDP YoY
- ▲ 3.80%
- F500 in state
- 10
Industry mix (Fortune 500 HQ in AR)
| Industry | F500 HQs | Revenue |
|---|---|---|
| Retail | 1 | $681B |
|
||
| Food / Agriculture | 1 | $53B |
|
||
| Retail / Energy | 1 | $22B |
|
||
| Transportation / Logistics | 1 | $12B |
|
||
| Energy | 1 | $4B |
|
||
Price history
+208.3% since first listed6 events — show timeline
- 2026-05-18 Listed $55,500 FSBO.com
- 2022-10-07 Sold (MLS) $15,000 HSBOR
- 2022-10-07 Sold (MLS) $15,000 CARMLS
- 2022-10-04 Pending — CARMLS
- 2022-10-03 Listed $18,000 HSBOR
- 2022-09-03 Listed $18,000 CARMLS
Cash-flow waterfall
monthlySold comps — $/sqft
last 12 mo · ≤1 miLoading sold comps…