 6-Plex
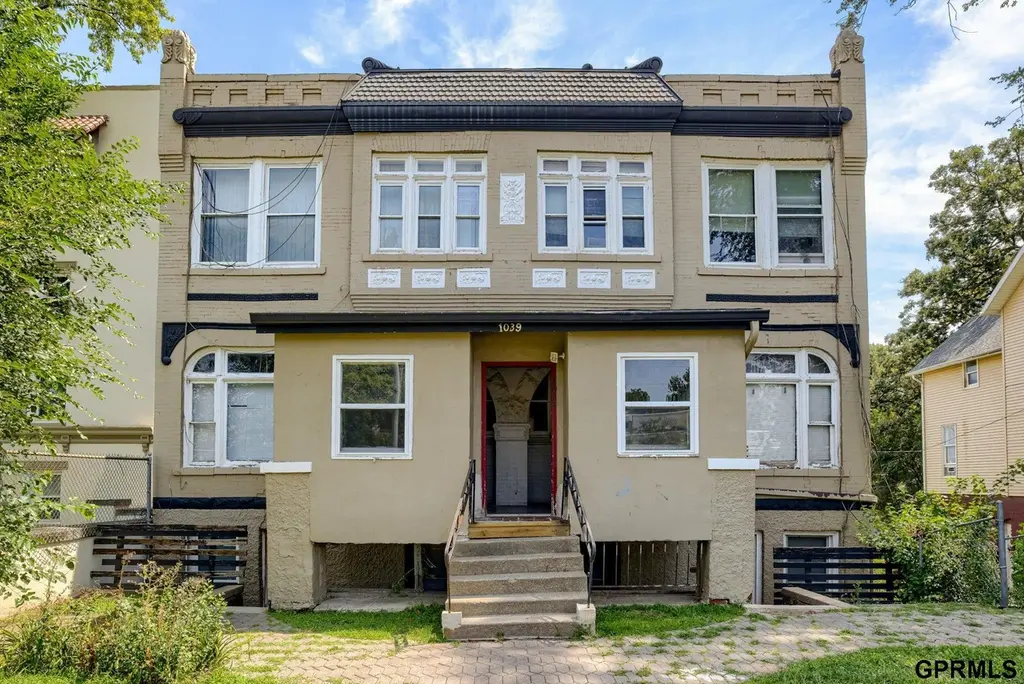
1039 Park Ave · Omaha, NE
Flood risk 1/10 · Minimal
- FEMA flood zone
- X (unshaded)
- Chance of flooding over 30 yrs
- 0.0%
- Est. flood insurance / yr
- $473 – $860
Fire risk 1/10 · Minimal
- Est. fire insurance / yr
- $1,161 – $2,155
Heat risk 3/10 · Minor
- Hot days now (above 103°F)
- 7 days/yr
- Hot days in 30 yrs
- 15 days/yr
Wind risk 2/10 · Minimal
- Chance of severe wind over 30 yrs
- —
Air-quality risk 2/10 · Minimal
- Unhealthy air days now
- 2 days/yr
- Unhealthy air days in 30 yrs
- 2 days/yr
Risk factors via First Street. Map © Google.
Why this score? — see what drove the B- grade
The composite is a weighted blend of 9 inputs, each scored 0–100. Each bar is that input's sub-score; the figure is the points it added to the 100-point composite (weight × sub-score).
- Cash flow +30.0/30.0
- DSCR +10.0/10.0
- 1% rule +8.5/10.0
- ARV discount +7.5/15.0
- Livability +4.2/5.0
- Rent growth +3.4/5.0
- Condition / age +2.5/5.0
- Schools +2.1/10.0
- Appreciation +0.0/10.0
$530,000
🖨 Deal sheet 📄 Offer letter ✓ Due diligence
Multi-family units
County records classify this as Multi-Family (5+ Unit). Listing-text estimate: 6 units. confirmed
5+ unit building — per-unit beds/baths from public records are typically unavailable; the breakdown below (if shown) is an estimate from the listing text.
Listing remarks MLS
Don't miss your opportunity to own a cash-flowing asset! This 6-unit apartment building is ready for new owners. Updates include new Pella installed vinyl siding and windows on the rear of the property. Located near interstate access, shopping, and near bus line access. P&L and Rent Roll available on request. Schedule your showing today! Questions: Reach out to Scott Anderson at 4025152982.
Key facts
- Interstate access
- Bus line access
- Vinyl siding
Tags
Neighborhood map
What this means for you Summary
Snapshot
- This is a 6 × 2-bed/1.0-bath units multifamily listed at $530k.
Deal economics
- At list price, monthly cash flow is $2k ($24k/yr) — positive. Per door: $329/mo.
- The deal already cash-flows at list — no discount required.
- Meets the 1% rule at list price ($7k rent vs $530k).
- Recommended offer: $466k (12.0% below list) — sets the bar for market timing.
- Cap rate 10.8% vs local median 3.6% in Omaha — top-decile yield for the area; either an underpriced asset or a hidden risk that comps aren't pricing in. Stress-test before assuming the spread holds.
Location & tenants
- Location reads 84/100 on livability (#7 in NE, #663 nationally) — a professional / high-income tenant draw. Strengths: amenities A+, commute A+, cost of living A+; Watch: crime F.
- Omaha Public Schools (urban): math 20% / reading 28% proficiency, ranked #110 of 111 in NE (top 99%) — low school quality limits family demand, transient renter base, plan for 1-2y turnover; 62% free/reduced lunch — lower-income household profile, screen leases tightly.
- Market conditions: Rents rising (+3.7%/yr); 124 active listings in the ZIP; 4,539 units permitted in Douglas County in 2024 (2,583 in 5+ unit buildings).
- At $7,132/mo this rent would consume 149% of the median local household income ($58k/yr) (locally 1096% of renters already pay >50% of income on rent) — very limited rent-growth headroom before tenants either downsize or default.
Forward outlook
- Local home prices are declining (-3.0%/yr); year-one equity from $4k of loan paydown is wiped out by about $16k of value loss. Plan a longer hold.
- Douglas County population projected at +28% by 2050 — long-run rental-demand tailwind backs the buy-and-hold thesis.
- At projected returns (-3.0% appreciation + 3.7% rent growth), your $148k cash investment doubles in ~8 years — after that, you're playing with house money.
Negotiation context
- It's been on market 169 days — a 12% lower offer ($466k) is reasonable based on typical stale-listing flexibility.
- 4 sale attempts since 20y ago with the ask held roughly flat each time — persistent listings suggest the price (not the market) is what's stuck; bring a comps-based counter.
Risks & watch-outs
- Watch-outs: built in 1910 — expect roof / HVAC / electrical / plumbing capex.
Questions for the listing agent
- It's been on market 169 days. Have you received any prior offers? Is the seller open to a 12% concession, seller financing, or rate buy-down credit?
- Can we see the unit-by-unit rent roll, current vacancy, and any below-market leases? What's the average tenancy length?
- What capital expenditures (roof, boiler, parking lot, exteriors) have been made in the last 5 years, and what's planned in the next 2?
- Built in 1910 — when were the roof, HVAC, electrical panel, plumbing, and water heater last replaced?
- Why hasn't it sold? Are there any deal-killer items the seller is aware of (foundation, flood, title, zoning, code violations)?
- Is there a deadline driving the sale (1031 exchange, divorce, estate, relocation)? That informs how much negotiation room exists.
- Crime grade is F in this area — have there been break-ins, vandalism, or insurance claims at this property in the last 3 years? What carrier currently insures it and at what premium?
- What's the average days-on-market for RENTAL listings here right now (not sales)? A rising rental-DOM trend means longer vacancies and softer asking-rent achievability than the comps imply.
- What's the recent tenant-quality profile in this submarket — average credit score on applications, eviction rate, late-payment / NSF rate, and stable-employment percentage? A property-management company in the area should have these aggregated.
- How much new apartment / multifamily construction is in the pipeline within 1–3 miles? Heavy new supply (>2% of stock underway) typically softens rents 12–24 months out; light construction supports rent growth.
Investment metrics
- 1% rule
- 1.35% ✓
- Cap rate
- 10.76%
- Cash-on-cash
- 15.94%
- DSCR
- 1.71
- GRM
- 6.2
CMA / ARV
- ARV (median comp)
- $319,212
- List price
- $530,000
- Delta
- 66.03%
- Verdict
- OVERPRICED
- Comps
- 20 within 1.0 mi
Show comp detail 1 sale within ~0.75 mi
| Address | Dist | Beds/Ba | Sqft | Sold | Price | $/sf | Match |
|---|---|---|---|---|---|---|---|
| 2968 Poppleton Ave | 0.18mi | 13/6.0 (+1) | 3,528 | 8mo | $1,325,000 | $376 | 68 |
Match score weights: distance 35% · size 25% · config 20% · recency 20%. Top-matched comps best support the ARV.
Projected returns pro-forma
-3.0% appreciation · 3.66% rent growth · sell at horizon
- IRR
- 7.6%
- Equity multiple
- 1.30×
- Total profit
- $44,562
- Equity at exit
- $79,025
- IRR
- 17.5%
- Equity multiple
- 2.49×
- Total profit
- $220,759
- Equity at exit
- $45,825
Cash invested: $148,400 (down + closing). Projections, not guarantees.
Landlord ↔ Tenant lean methodology
- Overall (STATE)
- 83 Strongly Landlord-Friendly
- State Nebraska
- 83 Strongly Landlord-Friendly · R+13
- County
- — inherits STATE
- City
- — inherits STATE
ZIP-level market 68105
- Rents YoY
- 3.7%
- Active inventory
- 124
- Price-to-rent
- 37.2×
Monthly cashflow live
- Estimated rent
- $7,132 high interval (Pro) →
- Mortgage (P&I)
- −$2,779
- Tax est. 1.5%
- −$662 /mo · $7,950/yr
- Insurance
- −$221
- HOA
- −$0
- Vacancy / Maint / Mgmt
- −$1,498
- Net cashflow
- $1,972
Break-even live
6-unit breakdown (identical units grouped — click to expand)
| Units | Beds | Baths | Est. rent |
|---|---|---|---|
| 6× units | 2 | 1 | $7,134 |
| #1 | 2 | 1 | $1,189 |
| #2 | 2 | 1 | $1,189 |
| #3 | 2 | 1 | $1,189 |
| #4 | 2 | 1 | $1,189 |
| #5 | 2 | 1 | $1,189 |
| #6 | 2 | 1 | $1,189 |
| Total (6 units) | $7,132 | ||
UW: 25.0% down · 7.5% · 30yr · 1.5% tax · 5.0% vac · 8.0% maint · 8.0% mgmt
Financing live
Cash to close
- Down payment
- $132,500
- Closing costs
- $15,900
- Reserves months
- —
- Total cash needed
- —
Loan-product check · same deal, 3 products live
Conventional
25% down · 7.5% · 30yr
- Down + closing
- —
- Monthly P&I
- —
- Monthly cashflow
- —
- DSCR
- —
- Eligible?
- —
Personal DTI + credit; lowest rate.
DSCR
20% down · 8.5% · 30yr
- Down + closing
- —
- Monthly P&I
- —
- Monthly cashflow
- —
- DSCR
- —
- Eligible?
- —
No personal income docs; deal must DSCR.
Hard money
10% down · 12.0% · 12mo
- Down + closing
- —
- Monthly P&I
- —
- Monthly cashflow
- —
- DSCR
- —
- Eligible?
- —
Short-term bridge; refi at stabilization.
Listing history 20 events
-
2026-06-18days on market $530,000 Active 169 DOM
-
2026-06-17days on market $530,000 Active 168 DOM
-
2026-06-16days on market $530,000 Active 167 DOM
-
2026-06-15days on market $530,000 Active 166 DOM
-
2026-06-13days on market $530,000 Active 164 DOM
-
2026-06-10days on market $530,000 Active 161 DOM
-
2026-06-09days on market $530,000 Active 160 DOM
-
2026-06-08days on market $530,000 Active 159 DOM
-
2026-06-07days on market $530,000 Active 158 DOM
-
2026-06-03days on market $530,000 Active 154 DOM
-
2026-06-03days on market $530,000 Active 153 DOM
-
2026-06-01days on market $530,000 Active 152 DOM
-
2026-06-01days on market $530,000 Active 151 DOM
-
2025-12-31$530,000 New 397-char remark
Show marketing remark (397 chars)
Don't miss your opportunity to own a cash-flowing asset! This 6-unit apartment building is ready for new owners. Updates include new Pella installed vinyl siding and windows on the rear of the property. Located near interstate access, shopping, and near bus line access. P&L and Rent Roll available on request. Schedule your showing today! Questions: Reach out to Scott Anderson at 4025152982.
-
2025-12-31historical
Show marketing remark (397 chars)
Don't miss your opportunity to own a cash-flowing asset! This 6-unit apartment building is ready for new owners. Updates include new Pella installed vinyl siding and windows on the rear of the property. Located near interstate access, shopping, and near bus line access. P&L and Rent Roll available on request. Schedule your showing today! Questions: Reach out to Scott Anderson at 4025152982.
-
2025-09-10$530,000 New
-
2025-09-10historical
-
2025-08-14$545,000 New
-
2006-10-02historical
-
2006-05-26$215,000
ⓘ Source: listings_history table (triggers on properties + properties_extension) + one-shot
backfill from property_details.listing_events for pre-trigger history.
Climate risk First Street
- Flood 1/10 Low FEMA zone X (unshaded) · 0% chance over 30 yrs
- Wildfire 1/10 Low
- Heat 3/10 Moderate 7 d/yr ≥103°F today · 15 d/yr by 30 yrs out
- Wind 2/10 Low
- Air quality 2/10 Low 2 unhealthy d/yr today · 2 by 30 yrs out
Nearby sold comps map
Loading sold comps map…
Walkable amenities ~0.75 mi
Loading nearby amenities…
Taxation est. · year 1
- Rental income
- $85,584
- − Mortgage interest
- −$29,688
- − Property taxes
- −$7,950
- − Insurance
- −$2,650
- − Repairs & maintenance
- −$6,847
- − Management
- −$6,847
- − Depreciation
- −$15,418
- Taxable income
- $16,184
- Est. tax owed @ 24.0%
- −$3,884
- After-tax cash flow
- $19,775/yr
For passive investors: Depreciation is non-cash, so a rental often shows a tax loss while cash-flowing — sheltering income. Rental losses are passive: they offset passive income freely, and up to $25,000/yr can offset ordinary (W-2) income if you actively participate and your MAGI is under $100k (phasing out to $0 by $150k); unused losses carry forward. On sale, claimed depreciation is recaptured at up to 25%, and gains may owe capital-gains tax (a 1031 exchange can defer both). Figures are a year-1 estimate at your 24.0% rate — not tax advice; consult a CPA.
Schools (NCES district)
- District
- Omaha Public Schools
- NCES district ID
- 3174820
- Math proficiency
- 20% ▼ -10.00%
- Reading proficiency
- 28% ▼ -5.00%
- Median HH income
- $46,039
- Composite
- 20.83/100
- National rank
- #8502
- State rank
- #110 of 111 in NE
Livability — Omaha
- Score
- 84/100
- State rank
- #7
- US rank
- #663
Category grades
Schools grade is shown separately in the Schools card above.
Census & demographics
- Census place
- Omaha, NE
- County
- Douglas County · 538,646 people
- City population
- 552,986
- Metro
- Omaha-Council Bluffs, NE-IA
- Population (ZIP)
- 22,807
- Household income
- $57,533
- Rent vs Own
- Severe rent burden
- 1096.0
Population outlook (Douglas County) Hauer SSP2
- Today (2025)
- 625,245 people
- By 2030
- 661,613 · +5.8%
- By 2040
- 732,395 · +17.1%
- By 2050
- 801,988 · +28.3%
- By 2075
- 968,637 · +54.9%
- By 2100
- 1,101,871 · +76.2%
Race, ethnicity, and origin ACS 2023
- Neighborhood character
- Diverse neighborhood (Simpson 0.55)
- Race & ethnicity
- White 60% Hispanic / Latino 29% Two or more races 11% Black 5% Native American 2% Asian 2%
- Hispanic origin (detail)
- Mexican 23%
- Common ancestry
- Romanian 5% Lithuanian 3% Portuguese 2%
- Foreign-born
- 13% · Canada, China
- Languages at home
- 73% English-only · Spanish 22% Arabic 1% Other Indo-European 1%
Political lean MEDSL · Douglas
- 2024 margin
- D (+10.2) · D 54.4% · R 44.2% · Other 1.4%
- 2008→2024 swing
- +5.5pp toward D · 2008: 4.6pp · 2024: 10.2pp
- All cycles
- 2024: D+10.2 2020: D+11.3 2016: D+1.4 2012: R+4.3 2008: D+4.6
Not yet ingested
- Civics
- —
Market trends
- HPI YoY
- ▼ -234.93%
- Current HPI
- 314.1884
- Rent YoY
- ▲ 3.66%
- Metro
- Omaha-Council Bluffs, NE-IA
- State GDP YoY
- ▲ 0.68%
- F500 in state
- 2
Industry mix (Fortune 500 HQ in NE)
| Industry | F500 HQs | Revenue |
|---|---|---|
| Conglomerate | 1 | $371B |
|
||
Price history
+146.5% since first listed7 events — show timeline
- 2025-12-31 Listing Removed — GPRMLS
- 2025-12-31 Listed $530,000 GPRMLS
- 2025-09-10 Listing Removed — GPRMLS
- 2025-09-10 Listed $530,000 GPRMLS
- 2025-08-14 Listed $545,000 GPRMLS
- 2006-10-02 Listing Removed — GPRMLS
- 2006-05-26 Listed $215,000 GPRMLS
Cash-flow waterfall
monthlySold comps — $/sqft
last 12 mo · ≤1 miLoading sold comps…