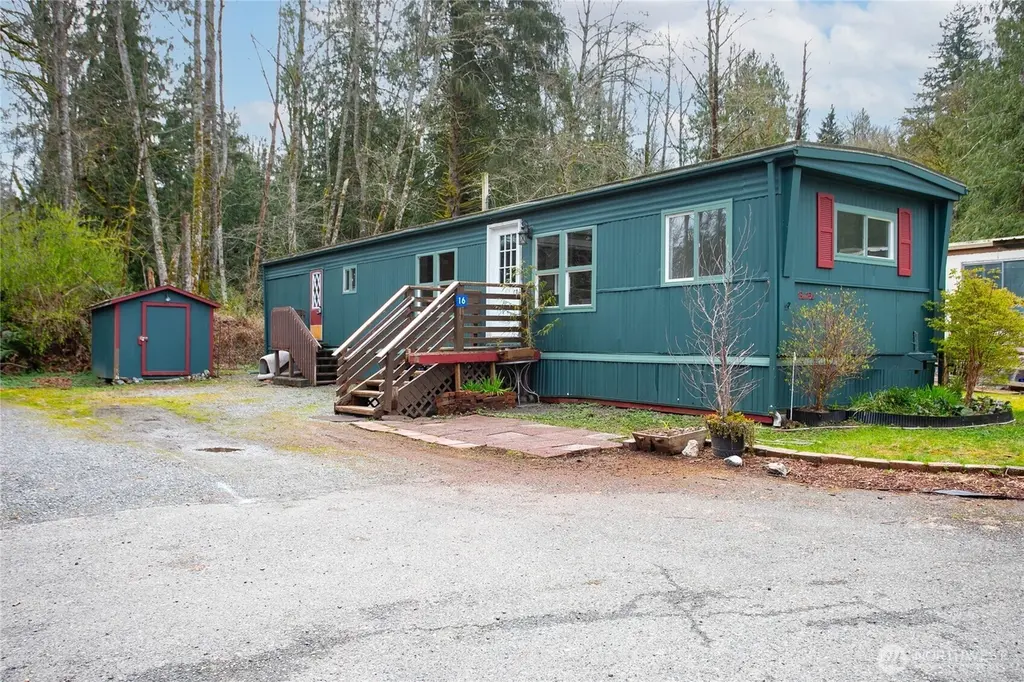
316 W Lake Samish Dr #16 · Alger, WA
Flood risk 1/10 · Minimal
- FEMA flood zone
- X (unshaded)
- Chance of flooding over 30 yrs
- 0.0%
- Est. flood insurance / yr
- $473 – $860
Fire risk 3/10 · Minor
- Est. fire insurance / yr
- $604 – $1,122
Heat risk 2/10 · Minimal
- Hot days now (above 84°F)
- 8 days/yr
- Hot days in 30 yrs
- 19 days/yr
Wind risk 1/10 · Minimal
- Chance of severe wind over 30 yrs
- —
Air-quality risk 6/10 · Moderate
- Unhealthy air days now
- 9 days/yr
- Unhealthy air days in 30 yrs
- 10 days/yr
Risk factors via First Street. Map © Google.
Why this score? — see what drove the B grade
The composite is a weighted blend of 9 inputs, each scored 0–100. Each bar is that input's sub-score; the figure is the points it added to the 100-point composite (weight × sub-score).
- Cash flow +30.0/30.0
- 1% rule +10.0/10.0
- DSCR +10.0/10.0
- ARV discount +7.5/15.0
- Schools +4.8/10.0
- Rent growth +3.3/5.0
- Livability +2.9/5.0
- Condition / age +2.5/5.0
- Appreciation +0.0/10.0
$89,000
🖨 Deal sheet 📄 Offer letter ✓ Due diligence
Listing remarks
Enjoy lakeside living in this 2+ bedroom single-wide home with bonus den or potential 3rd bedroom in the desirable Calmor Cove Community on Lake Samish. Flexible layout perfect for guests, a home office, or extra living space. Recent updates include new windows, newer water heater, newer furnace, new bathroom sink and shelf, some fresh paint, new carpet, and a stainless steel refrigerator and dishwasher. Shed in the back provides additional storage and a plug in for a generator for the house. Sign up for lake moorage and enjoy boating, swimming, or relaxing just steps from your door. Bonus- there is a natural trail right behind the home! Space rent includes water with a new water filter sys
Key facts
- Parking
- Built 1971
- Listed 73 days
Property features AI
Finance
- Other: Mobile home remains on site; Property condition listed as fair
- Financial info: Listing terms: Cash or Conventional
- HOA & community: Calmor Cove Mobile Park (about 45 homes in park); Park amenities include BBQs, clubhouse, common area, community waterfront; Land lease charged
Exterior
- Parking: Uncovered parking
- Utilities: Electric energy source; Community water; Sewer: City of Bellingham; Power: PSE; Cable: Xfinity connected; Internet: Xfinity connected; Electric water heater
- Home design: Single wide manufactured home; Manufactured home (Residential); One story; Entry faces unspecified direction
- Construction: Metal roof; Metal/vinyl construction materials; Slab foundation with tie downs; Manufactured house structure type; Built as single wide (style code: Manuf-Single Wide)
- Exterior features: Metal/vinyl exterior; Metal/vinyl listed as exterior material; Paved lot; Shed in back yard (storage); Community waterfront/private beach access
Interior
- Kitchen: Dishwasher; Refrigerator; Stove/Range
- Bedrooms: 2 bedrooms
- Flooring: Vinyl
- Bathrooms: 1 full bathroom; 1 half bathroom; 1 bathtub; 1 shower
- Heating & cooling: Forced air heating; No central cooling
- Interior features: Water heater; Den/office; Kitchen without eating space; Has view
- Laundry & utility: Washer; Dryer; Water heater located in enclosed bathroom
Neighborhood map
What this means for you Summary
Snapshot
- This is a 2-bed/1.5-bath manufactured listed at $89k.
Deal economics
- At list price, monthly cash flow is $1k ($13k/yr) — positive.
- The deal already cash-flows at list — no discount required.
- Meets the 1% rule at list price ($2k rent vs $89k).
- Recommended offer: $84k (6.0% below list) — sets the bar for market timing.
- Cap rate 20.7% vs local median 2.4% in Alger — top-decile yield for the area; either an underpriced asset or a hidden risk that comps aren't pricing in. Stress-test before assuming the spread holds.
Location & tenants
- Location reads 57/100 on livability (#527 in WA) — a working-class tenant base; expect higher turnover. Strengths: employment A; Watch: health & safety D, schools F, amenities F.
- Bellingham School District (urban): math 47% / reading 63% proficiency, ranked #106 of 291 in WA (top 36%) — acceptable for families but not a draw, mixed tenant base, ~2y average lease.
- Market conditions: Rents rising (+3.4%/yr); 270 active listings in the ZIP; 1 comparable units currently listed for rent nearby; solid renter incomes; 1,190 units permitted in Whatcom County in 2024 (327 in 5+ unit buildings).
Forward outlook
- Local home prices are declining (-3.0%/yr); year-one equity from $615 of loan paydown is wiped out by about $3k of value loss. Plan a longer hold.
- Whatcom County population projected at +28% by 2050 — long-run rental-demand tailwind backs the buy-and-hold thesis.
- At projected returns (-3.0% appreciation + 3.4% rent growth), your $25k cash investment doubles in ~3 years — after that, you're playing with house money.
Negotiation context
- It's been on market 73 days — a 6% lower offer ($84k) is reasonable based on typical stale-listing flexibility.
- 3 sale attempts since 21y ago; this cycle's ask has dropped $20k (19%) from the opening price — seller is motivated, your offer sets the floor, not the list.
- Current owner paid $11k; list at $89k implies a 709% gain — meaningful room to come down on a strong offer.
Questions for the listing agent
- It's been on market 73 days. Have you received any prior offers? Is the seller open to a 6% concession, seller financing, or rate buy-down credit?
- Built in 1971 — when were the roof, HVAC, electrical panel, plumbing, and water heater last replaced?
- Why hasn't it sold? Are there any deal-killer items the seller is aware of (foundation, flood, title, zoning, code violations)?
- Is there a deadline driving the sale (1031 exchange, divorce, estate, relocation)? That informs how much negotiation room exists.
- Schools are F-rated, which usually means shorter tenancies and higher turnover. Who's the typical renter profile here, and what's been the actual vacancy rate?
- What's the average days-on-market for RENTAL listings here right now (not sales)? A rising rental-DOM trend means longer vacancies and softer asking-rent achievability than the comps imply.
- What's the recent tenant-quality profile in this submarket — average credit score on applications, eviction rate, late-payment / NSF rate, and stable-employment percentage? A property-management company in the area should have these aggregated.
- How much new for-sale + rental construction is in the pipeline within 1–3 miles? Heavy new supply typically softens prices + rents 12–24 months out; constrained supply supports both.
Investment metrics
- 1% rule
- 2.26% ✓
- Cap rate
- 20.68%
- Cash-on-cash
- 51.39%
- DSCR
- 3.29
- GRM
- 3.7
CMA / ARV
- ARV (on-the-fly)
- $335,160
- Comps found
- 3
Show comp detail 3 sales within ~0.75 mi
| Address | Dist | Beds/Ba | Sqft | Sold | Price | $/sf | Match |
|---|---|---|---|---|---|---|---|
| 316 W Lake Samish Dr #45 | 0.18mi | 3/1.0 (+1) | 840 (0%) | 11mo | $404,900 | $482 | 75 |
| 316 W Lake Samish Rd #27 | 0.18mi | 1/1.0 (-1) | 804 (-4%) | 11mo | $46,000 | $57 | 68 |
| 316 W Lake Samish Dr #3 | 0.13mi | 1/1.0 (-1) | 940 (+12%) | 21mo | $375,000 | $399 | 50 |
Match score weights: distance 35% · size 25% · config 20% · recency 20%. Top-matched comps best support the ARV.
Projected returns pro-forma
-3.0% appreciation · 3.38% rent growth · sell at horizon
- IRR
- 49.6%
- Equity multiple
- 3.18×
- Total profit
- $54,295
- Equity at exit
- $13,270
- IRR
- 55.3%
- Equity multiple
- 6.53×
- Total profit
- $137,886
- Equity at exit
- $7,695
Cash invested: $24,920 (down + closing). Projections, not guarantees.
Landlord ↔ Tenant lean methodology
- Overall (STATE)
- 28 Tenant-Leaning
- State Washington
- 28 Tenant-Leaning · D+8
- County
- — inherits STATE
- City
- — inherits STATE
ZIP-level market 98229
- Rents YoY
- 3.4%
- Active inventory
- 270
- Price-to-rent
- 3.7×
Monthly cashflow live
- Estimated rent
- $2,011 medium interval (Pro) →
- Mortgage (P&I)
- −$467
- Tax from tax record
- −$18 /mo · $212/yr
- Insurance
- −$37
- HOA
- −$0
- Vacancy / Maint / Mgmt
- −$422
- Net cashflow
- $1,067
Break-even live
UW: 25.0% down · 7.5% · 30yr · 1.5% tax · 5.0% vac · 8.0% maint · 8.0% mgmt
Financing live
Cash to close
- Down payment
- $22,250
- Closing costs
- $2,670
- Reserves months
- —
- Total cash needed
- —
Loan-product check · same deal, 3 products live
Conventional
25% down · 7.5% · 30yr
- Down + closing
- —
- Monthly P&I
- —
- Monthly cashflow
- —
- DSCR
- —
- Eligible?
- —
Personal DTI + credit; lowest rate.
DSCR
20% down · 8.5% · 30yr
- Down + closing
- —
- Monthly P&I
- —
- Monthly cashflow
- —
- DSCR
- —
- Eligible?
- —
No personal income docs; deal must DSCR.
Hard money
10% down · 12.0% · 12mo
- Down + closing
- —
- Monthly P&I
- —
- Monthly cashflow
- —
- DSCR
- —
- Eligible?
- —
Short-term bridge; refi at stabilization.
Rent comps 1 comps
| Address | Beds | Baths | Sqft | Rent | $/sqft | DOM | Units | Dist |
|---|---|---|---|---|---|---|---|---|
| 705 W Lake Samish Dr Unit 703A Bellingham, WA | 2.0 | 2.0 | 1120 | $2,495 | $2.23 | 13d | 1 | 1.26mi |
Listing history 27 events
-
2026-06-18days on market $89,000 Active 73 DOM
-
2026-06-17days on market $89,000 Active 72 DOM
-
2026-06-16days on market $89,000 Active 71 DOM
-
2026-06-15days on market $89,000 Active 70 DOM
-
2026-06-14days on market $89,000 Active 68 DOM
-
2026-06-13pricedays on market $89,000 Active 67 DOM
-
2026-06-10days on market $99,000 Active 65 DOM
-
2026-06-09days on market $99,000 Active 64 DOM
-
2026-06-08days on market $99,000 Active 63 DOM
-
2026-06-07days on market $99,000 Active 62 DOM
-
2026-06-05days on market $99,000 Active 59 DOM
-
2026-06-03days on market $99,000 Active 58 DOM
-
2026-06-02days on market $99,000 Active 57 DOM
-
2026-06-01days on market $99,000 Active 56 DOM
-
2026-05-31days on market $99,000 Active 55 DOM
-
2026-05-30days on market $99,000 Active 54 DOM
-
2026-05-10price $99,000
-
2026-04-06$109,500 Active
-
2012-08-10soldstatus $11,000 Sold
-
2012-08-02status Pending
-
2012-07-28status Pending Inspection
-
2012-07-25price $14,400
-
2012-06-21price $14,900
-
2012-06-12price $17,500
-
2012-05-31$19,900 Active
-
2005-10-20soldstatus $21,900
-
2005-08-08$21,900
ⓘ Source: listings_history table (triggers on properties + properties_extension) + one-shot
backfill from property_details.listing_events for pre-trigger history.
Tax reassessment forecast WA · Resets to sale price
- Current annual tax
- $212 · $18/mo
- Projected year-2 tax
- $872 · $73/mo
- Expected delta
- +$661/yr (+$55/mo · 312.1%)
ⓘ Screening estimate from a state-policy table — verify with the county assessor before closing.
Climate risk First Street
- Flood 1/10 Low FEMA zone X (unshaded) · 0% chance over 30 yrs
- Wildfire 3/10 Moderate
- Heat 2/10 Low 8 d/yr ≥84°F today · 19 d/yr by 30 yrs out
- Wind 1/10 Low
- Air quality 6/10 Major 9 unhealthy d/yr today · 10 by 30 yrs out
Nearby sold comps map
Loading sold comps map…
Walkable amenities ~0.75 mi
Loading nearby amenities…
Taxation est. · year 1
- Rental income
- $24,132
- − Mortgage interest
- −$4,985
- − Property taxes
- −$212
- − Insurance
- −$445
- − Repairs & maintenance
- −$1,931
- − Management
- −$1,931
- − Depreciation
- −$2,589
- Taxable income
- $12,040
- Est. tax owed @ 24.0%
- −$2,889
- After-tax cash flow
- $9,917/yr
For passive investors: Depreciation is non-cash, so a rental often shows a tax loss while cash-flowing — sheltering income. Rental losses are passive: they offset passive income freely, and up to $25,000/yr can offset ordinary (W-2) income if you actively participate and your MAGI is under $100k (phasing out to $0 by $150k); unused losses carry forward. On sale, claimed depreciation is recaptured at up to 25%, and gains may owe capital-gains tax (a 1031 exchange can defer both). Figures are a year-1 estimate at your 24.0% rate — not tax advice; consult a CPA.
Schools (NCES district)
- District
- Bellingham School District
- NCES district ID
- 5300420
- Math proficiency
- 47% ▼ -6.00%
- Reading proficiency
- 63% ▼ -1.00%
- Median HH income
- $47,678
- Composite
- 48.49/100
- National rank
- #4632
- State rank
- #106 of 291 in WA
Livability — Alger
- Score
- 57/100
- State rank
- #527
- US rank
- #21801
Category grades
Schools grade is shown separately in the Schools card above.
Census & demographics
- County
- Whatcom County · 209,776 people
- Metro
- Bellingham, WA
- Population (ZIP)
- 33,298
- Household income
- $90,945
- Rent vs Own
- Severe rent burden
- 1040.0
Population outlook (Whatcom County) Hauer SSP2
- Today (2025)
- 240,408 people
- By 2030
- 254,667 · +5.9%
- By 2040
- 281,365 · +17.0%
- By 2050
- 307,592 · +27.9%
- By 2075
- 375,576 · +56.2%
- By 2100
- 421,637 · +75.4%
Race, ethnicity, and origin ACS 2023
- Neighborhood character
- Predominantly White (77%)
- Race & ethnicity
- White 77% Two or more races 13% Hispanic / Latino 10% Asian 3%
- Hispanic origin (detail)
- Mexican 8%
- Common ancestry
- Portuguese 6% Italian 4% Slovak 4%
- Foreign-born
- 8% · Canada, China, Vietnam
- Languages at home
- 88% English-only · Spanish 7% Chinese 1% German/W. Germanic 1%
Political lean MEDSL · Whatcom
- 2024 margin
- Strong D (+24.9) · D 60.8% · R 35.9% · Other 3.3%
- 2008→2024 swing
- +6.9pp toward D · 2008: 18.0pp · 2024: 24.9pp
- All cycles
- 2024: D+24.9 2020: D+23.9 2016: D+17.7 2012: D+12.1 2008: D+18.0
Not yet ingested
- Civics
- —
Market trends
- HPI YoY
- ▼ -652.00%
- Current HPI
- 413.1478
- Rent YoY
- ▲ 3.38%
- Metro
- Bellingham, WA
- State GDP YoY
- ▲ 4.65%
- F500 in state
- 22
Industry mix (Fortune 500 HQ in WA)
| Industry | F500 HQs | Revenue |
|---|---|---|
| Retail | 2 | $269B |
|
||
| Technology / Retail | 1 | $638B |
|
||
| Technology | 1 | $245B |
|
||
| Telecommunications | 1 | $38B |
|
||
| Food / Beverage | 1 | $36B |
|
||
| Automotive / Trucks | 1 | $34B |
|
||
Price history
+352.1% since first listed11 events — show timeline
- 2026-05-10 Price Changed $99,000 NWMLS as Distributed by MLS Grid
- 2026-04-06 Listed $109,500 NWMLS as Distributed by MLS Grid
- 2012-08-10 Sold (MLS) $11,000 NWMLS as Distributed by MLS Grid
- 2012-08-02 Pending — NWMLS as Distributed by MLS Grid
- 2012-07-28 Pending — NWMLS as Distributed by MLS Grid
- 2012-07-25 Price Changed $14,400 NWMLS as Distributed by MLS Grid
- 2012-06-21 Price Changed $14,900 NWMLS as Distributed by MLS Grid
- 2012-06-12 Price Changed $17,500 NWMLS as Distributed by MLS Grid
- 2012-05-31 Listed $19,900 NWMLS as Distributed by MLS Grid
- 2005-10-20 Sold (MLS) $21,900 NWMLS as Distributed by MLS Grid
- 2005-08-08 Listed $21,900 NWMLS as Distributed by MLS Grid
Property tax history
+4.8%/yrLatest (2026): $212 · +32.0% YoY. Source: county tax records.
Cash-flow waterfall
monthlySold comps — $/sqft
last 12 mo · ≤1 miLoading sold comps…