63 Mullins Dr · Lillington, NC
Flood risk 1/10 · Minimal
- FEMA flood zone
- X (unshaded)
- Chance of flooding over 30 yrs
- 0.0%
- Est. flood insurance / yr
- $507 – $1,088
Fire risk 6/10 · Moderate
- Est. fire insurance / yr
- $906 – $1,684
Heat risk 6/10 · Moderate
- Hot days now (above 105°F)
- 7 days/yr
- Hot days in 30 yrs
- 16 days/yr
Wind risk 6/10 · Moderate
- Chance of severe wind over 30 yrs
- 62.0%
Air-quality risk 2/10 · Minimal
- Unhealthy air days now
- 0 days/yr
- Unhealthy air days in 30 yrs
- 1 days/yr
Risk factors via First Street. Map © Google.
Why this score? — see what drove the B grade
The composite is a weighted blend of 9 inputs, each scored 0–100. Each bar is that input's sub-score; the figure is the points it added to the 100-point composite (weight × sub-score).
- Cash flow +28.2/30.0
- ARV discount +15.0/15.0
- DSCR +10.0/10.0
- 1% rule +6.9/10.0
- Livability +3.6/5.0
- Schools +3.0/10.0
- Rent growth +2.5/5.0
- Condition / age +2.5/5.0
- Appreciation +0.0/10.0
$145,000
🖨 Deal sheet 📄 Offer letter ✓ Due diligence
Listing remarks MLS
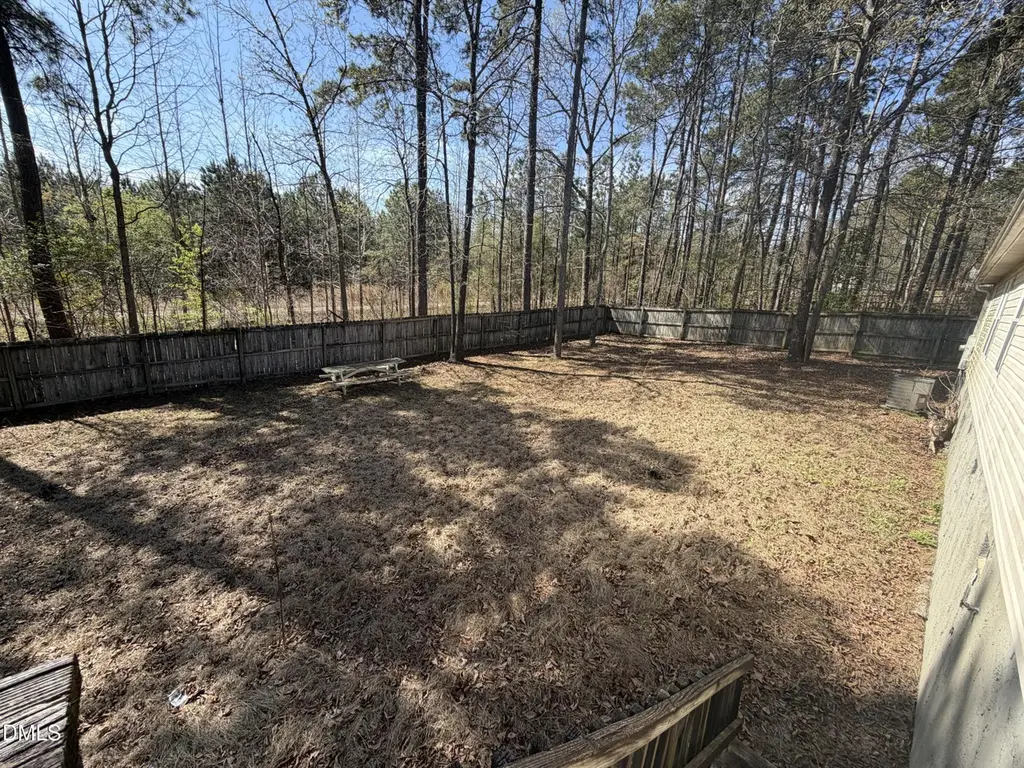
Great purchase for 1st time homeowners or investors 3 bedrooms, 2 baths and a bonus with 20+ yrs rental property! Great location with easy access to Ft. Bragg and Sanford. Property is situated on nice size lot surrounded by trees for privacy. Fully fenced in backyard. Property will be sold "AS IS", but sellers will give $5000 allowance for repairs. Sellers will also replace the roof before closing. Property is AGENT OWNED. Great purchase for 1st time homeowners or investors. 3 bedrooms, 2 baths and a bonus with 20+ yrs rental history! Great location with easy access to Ft. Bragg and Sanford. Property is situated on nice size lot surrounded by trees for privacy. Fully fenced in backyard. Property will be sold "AS IS", but sellers will give $5000 allowance for repairs. Sellers will also replace the roof before closing. Property is AGENT OWNED.
Key facts
- Fenced backyard
- 0.75 acre lot
- 0.75 acre lot
Tags
Neighborhood map
What this means for you Summary
Snapshot
- This is a 3-bed/2.0-bath manufactured listed at $145k.
Deal economics
- At list price, monthly cash flow is $461 ($6k/yr) — positive.
- The deal already cash-flows at list — no discount required.
- Meets the 1% rule at list price ($2k rent vs $145k).
- Cap rate 10.1% vs local median 4.0% in Lillington — top-decile yield for the area; either an underpriced asset or a hidden risk that comps aren't pricing in. Stress-test before assuming the spread holds.
Location & tenants
- Location reads 71/100 on livability (#101 in NC) — a middle-class / working-renter tenant base. Strengths: cost of living A+, housing A+, health & safety A+; Watch: employment C-, amenities F, commute F.
- Harnett County Schools (rural): math 31% / reading 39% proficiency, ranked #130 of 178 in NC (top 73%) — families likely to look elsewhere, expect single-tenant / working-renter base with shorter leases.
- Zoned schools: South Harnett Elementary (math 28% / reading 33%, grade F, #959 of 1,410 statewide, top 68%, 448 students, 63% FRL); Western Harnett Middle (math 34% / reading 43%, grade F, #244 of 475 statewide, top 53%, 820 students, 57% FRL); Western Harnett High (math 57% / reading 58%, grade C, #245 of 535 statewide, top 46%, 1,386 students, 60% FRL).
- Market conditions: 829 active listings in the ZIP; 1 comparable units currently listed for rent nearby; 2,080 units permitted in Harnett County in 2024 (12 in 5+ unit buildings).
- This rent runs 31% of the median local income ($67k/yr) — at the standard rent-burdened threshold; future hikes will face affordability resistance.
Forward outlook
- Local home prices are declining (-3.0%/yr); year-one equity from $1k of loan paydown is wiped out by about $4k of value loss. Plan a longer hold.
- Harnett County population projected at +42% by 2050 — long-run rental-demand tailwind backs the buy-and-hold thesis.
- At projected returns (-3.0% appreciation + 3.0% rent growth), your $41k cash investment doubles in ~9 years — after that, you're playing with house money.
Negotiation context
- Only 7 days on market — expect competitive offers; lowballing is unlikely to land.
- 2 sale attempts since 8y ago with the ask held roughly flat each time — persistent listings suggest the price (not the market) is what's stuck; bring a comps-based counter.
- Current owner paid $50k; list at $145k implies a 190% gain — meaningful room to come down on a strong offer.
Risks & watch-outs
- Climate carrying-cost: major wind risk, 62% chance of damaging wind over 30y; major wildfire risk; extreme-heat days projected 7→16/yr by 2055 (HVAC capex compounding) — expect insurance premiums to compound above CPI over the hold.
Questions for the listing agent
- Is there a deadline driving the sale (1031 exchange, divorce, estate, relocation)? That informs how much negotiation room exists.
- Schools are F-rated, which usually means shorter tenancies and higher turnover. Who's the typical renter profile here, and what's been the actual vacancy rate?
- What's the average days-on-market for RENTAL listings here right now (not sales)? A rising rental-DOM trend means longer vacancies and softer asking-rent achievability than the comps imply.
- What's the recent tenant-quality profile in this submarket — average credit score on applications, eviction rate, late-payment / NSF rate, and stable-employment percentage? A property-management company in the area should have these aggregated.
- How much new for-sale + rental construction is in the pipeline within 1–3 miles? Heavy new supply typically softens prices + rents 12–24 months out; constrained supply supports both.
Investment metrics
- 1% rule
- 1.19% ✓
- Cap rate
- 10.11%
- Cash-on-cash
- 13.62%
- DSCR
- 1.61
- GRM
- 7.0
CMA / ARV
- ARV (on-the-fly)
- $213,192
- Comps found
- 4
Show comp detail 4 sales within ~0.75 mi
| Address | Dist | Beds/Ba | Sqft | Sold | Price | $/sf | Match |
|---|---|---|---|---|---|---|---|
| 485 Eisler Dr | 0.70mi | 3/3.0 | 1,575 (+4%) | 22mo | $122,000 | $77 | 38 |
| 545 Eisler Dr | 0.61mi | 4/2.0 (+1) | 1,324 (-12%) | 12mo | $195,000 | $147 | 36 |
| 710 Eisler Dr | 0.55mi | 3/2.0 | 1,316 (-13%) | 20mo | $186,000 | $141 | 36 |
| 265 Kathleen Rd | 0.73mi | 3/3.0 | 1,602 (+6%) | 21mo | $137,000 | $86 | 34 |
Match score weights: distance 35% · size 25% · config 20% · recency 20%. Top-matched comps best support the ARV.
Projected returns pro-forma
-3.0% appreciation · 3.0% rent growth · sell at horizon
- IRR
- 3.7%
- Equity multiple
- 1.14×
- Total profit
- $5,805
- Equity at exit
- $21,620
- IRR
- 13.2%
- Equity multiple
- 2.05×
- Total profit
- $42,678
- Equity at exit
- $12,537
Cash invested: $40,600 (down + closing). Projections, not guarantees.
Landlord ↔ Tenant lean methodology
- Overall (STATE)
- 85 Strongly Landlord-Friendly
- State North Carolina
- 85 Strongly Landlord-Friendly · R+3
- County
- — inherits STATE
- City
- — inherits STATE
ZIP-level market 27546
- Home prices YoY
- -14.4%
- Active inventory
- 829
- Price-to-rent
- 7.0×
Monthly cashflow live
- Estimated rent
- $1,719 medium interval (Pro) →
- Mortgage (P&I)
- −$760
- Tax from tax record
- −$76 /mo · $917/yr
- Insurance
- −$60
- HOA
- −$0
- Vacancy / Maint / Mgmt
- −$361
- Net cashflow
- $461
Break-even live
UW: 25.0% down · 7.5% · 30yr · 1.5% tax · 5.0% vac · 8.0% maint · 8.0% mgmt
Financing live
Cash to close
- Down payment
- $36,250
- Closing costs
- $4,350
- Reserves months
- —
- Total cash needed
- —
Loan-product check · same deal, 3 products live
Conventional
25% down · 7.5% · 30yr
- Down + closing
- —
- Monthly P&I
- —
- Monthly cashflow
- —
- DSCR
- —
- Eligible?
- —
Personal DTI + credit; lowest rate.
DSCR
20% down · 8.5% · 30yr
- Down + closing
- —
- Monthly P&I
- —
- Monthly cashflow
- —
- DSCR
- —
- Eligible?
- —
No personal income docs; deal must DSCR.
Hard money
10% down · 12.0% · 12mo
- Down + closing
- —
- Monthly P&I
- —
- Monthly cashflow
- —
- DSCR
- —
- Eligible?
- —
Short-term bridge; refi at stabilization.
Rent comps 1 comps
| Address | Beds | Baths | Sqft | Rent | $/sqft | DOM | Units | Dist |
|---|---|---|---|---|---|---|---|---|
| 36 Jumpmaster Dr Unit Na Broadway, NC | 3.0 | 2.0 | 1250 | $1,750 | $1.40 | 23d | 1 | 1.44mi |
Listing history 5 events
-
2026-04-24status Pending
-
2026-04-17$145,000 Active
-
2018-08-31soldstatus $50,000 875-char remark
Show marketing remark (875 chars)
Great purchase for 1st time homeowners or investors 3 bedrooms, 2 baths and a bonus with 20+ yrs rental property! Great location with easy access to Ft. Bragg and Sanford. Property is situated on nice size lot surrounded by trees for privacy. Fully fenced in backyard. Property will be sold "AS IS", but sellers will give $5000 allowance for repairs. Sellers will also replace the roof before closing. Property is AGENT OWNED. Great purchase for 1st time homeowners or investors. 3 bedrooms, 2 baths and a bonus with 20+ yrs rental history! Great location with easy access to Ft. Bragg and Sanford. Property is situated on nice size lot surrounded by trees for privacy. Fully fenced in backyard. Property will be sold "AS IS", but sellers will give $5000 allowance for repairs. Sellers will also replace the roof before closing. Property is AGENT OWNED.
-
2018-08-31soldstatus $50,000
Show marketing remark (875 chars)
Great purchase for 1st time homeowners or investors 3 bedrooms, 2 baths and a bonus with 20+ yrs rental property! Great location with easy access to Ft. Bragg and Sanford. Property is situated on nice size lot surrounded by trees for privacy. Fully fenced in backyard. Property will be sold "AS IS", but sellers will give $5000 allowance for repairs. Sellers will also replace the roof before closing. Property is AGENT OWNED. Great purchase for 1st time homeowners or investors. 3 bedrooms, 2 baths and a bonus with 20+ yrs rental history! Great location with easy access to Ft. Bragg and Sanford. Property is situated on nice size lot surrounded by trees for privacy. Fully fenced in backyard. Property will be sold "AS IS", but sellers will give $5000 allowance for repairs. Sellers will also replace the roof before closing. Property is AGENT OWNED.
-
2018-07-11$54,900 875-char remark
Show marketing remark (875 chars)
Great purchase for 1st time homeowners or investors 3 bedrooms, 2 baths and a bonus with 20+ yrs rental property! Great location with easy access to Ft. Bragg and Sanford. Property is situated on nice size lot surrounded by trees for privacy. Fully fenced in backyard. Property will be sold "AS IS", but sellers will give $5000 allowance for repairs. Sellers will also replace the roof before closing. Property is AGENT OWNED. Great purchase for 1st time homeowners or investors. 3 bedrooms, 2 baths and a bonus with 20+ yrs rental history! Great location with easy access to Ft. Bragg and Sanford. Property is situated on nice size lot surrounded by trees for privacy. Fully fenced in backyard. Property will be sold "AS IS", but sellers will give $5000 allowance for repairs. Sellers will also replace the roof before closing. Property is AGENT OWNED.
ⓘ Source: listings_history table (triggers on properties + properties_extension) + one-shot
backfill from property_details.listing_events for pre-trigger history.
Tax reassessment forecast NC · Resets to sale price
- Current annual tax
- $917 · $76/mo
- Projected year-2 tax
- $1,189 · $99/mo
- Expected delta
- +$272/yr (+$23/mo · 29.7%)
ⓘ Screening estimate from a state-policy table — verify with the county assessor before closing.
Climate risk First Street
- Flood 1/10 Low FEMA zone X (unshaded) · 0% chance over 30 yrs
- Wildfire 6/10 Major
- Heat 6/10 Major 7 d/yr ≥105°F today · 16 d/yr by 30 yrs out
- Wind 6/10 Major 62% chance of damaging wind over 30 yrs
- Air quality 2/10 Low 0 unhealthy d/yr today · 1 by 30 yrs out
Nearby sold comps map
Loading sold comps map…
Walkable amenities ~0.75 mi
Loading nearby amenities…
Taxation est. · year 1
- Rental income
- $20,626
- − Mortgage interest
- −$8,122
- − Property taxes
- −$917
- − Insurance
- −$725
- − Repairs & maintenance
- −$1,650
- − Management
- −$1,650
- − Depreciation
- −$4,218
- Taxable income
- $3,344
- Est. tax owed @ 24.0%
- −$802
- After-tax cash flow
- $4,725/yr
For passive investors: Depreciation is non-cash, so a rental often shows a tax loss while cash-flowing — sheltering income. Rental losses are passive: they offset passive income freely, and up to $25,000/yr can offset ordinary (W-2) income if you actively participate and your MAGI is under $100k (phasing out to $0 by $150k); unused losses carry forward. On sale, claimed depreciation is recaptured at up to 25%, and gains may owe capital-gains tax (a 1031 exchange can defer both). Figures are a year-1 estimate at your 24.0% rate — not tax advice; consult a CPA.
Schools (NCES district)
- District
- Harnett County Schools
- NCES district ID
- 3702010
- Math proficiency
- 31% ▼ -2.00%
- Reading proficiency
- 39% ▼ -1.00%
- Median HH income
- $45,400
- Composite
- 29.88/100
- National rank
- #6397
- State rank
- #130 of 178 in NC
Livability — Lillington
- Score
- 71/100
- State rank
- #101
- US rank
- #6653
Category grades
Schools grade is shown separately in the Schools card above.
Census & demographics
- County
- Harnett County · 125,715 people
- City population
- 21,419
- Metro
- Fayetteville, NC
- Population (ZIP)
- 21,419
- Household income
- $66,746
- Rent vs Own
- Severe rent burden
- 642.0
Population outlook (Harnett County) Hauer SSP2
- Today (2025)
- 153,758 people
- By 2030
- 166,581 · +8.3%
- By 2040
- 192,741 · +25.4%
- By 2050
- 218,332 · +42.0%
- By 2075
- 275,422 · +79.1%
- By 2100
- 313,511 · +103.9%
Race, ethnicity, and origin ACS 2023
- Neighborhood character
- Diverse neighborhood (Simpson 0.55)
- Race & ethnicity
- White 64% Black 16% Hispanic / Latino 14% Two or more races 9% Asian 1%
- Hispanic origin (detail)
- Mexican 8% Puerto Rican 3%
- Common ancestry
- Slovak 3% Serbian 2% Italian 2%
- Foreign-born
- 5% · Canada, Jamaica, China
- Languages at home
- 90% English-only · Spanish 9%
Political lean MEDSL · Harnett
- 2024 margin
- Strong R (+25.1) · D 36.9% · R 62.0% · Other 1.1%
- 2008→2024 swing
- -8.4pp toward R · 2008: -16.7pp · 2024: -25.1pp
- All cycles
- 2024: R+25.1 2020: R+22.4 2016: R+24.1 2012: R+19.4 2008: R+16.7
Not yet ingested
- Civics
- —
Market trends
- HPI YoY
- ▼ -33.35%
- Current HPI
- 198.2885
- Rent YoY
- —
- Metro
- Fayetteville, NC
- State GDP YoY
- ▲ 3.28%
- F500 in state
- 26
Industry mix (Fortune 500 HQ in NC)
| Industry | F500 HQs | Revenue |
|---|---|---|
| Financial Services | 2 | $213B |
|
||
| Retail | 2 | $95B |
|
||
| Industrial Conglomerate | 1 | $38B |
|
||
| Metals / Steel | 1 | $35B |
|
||
| Utilities | 1 | $30B |
|
||
| Industrial Machinery | 1 | $19B |
|
||
Price history
+164.1% since first listed5 events — show timeline
- 2026-04-24 Pending — TMLS
- 2026-04-17 Listed $145,000 TMLS
- 2018-08-31 Sold (Public Records) $50,000 Public Records
- 2018-08-31 Sold (MLS) $50,000 LPRMLS
- 2018-07-11 Listed $54,900 LPRMLS
Property tax history
+4.5%/yrLatest (2025): $917 · +0.0% YoY. Source: county tax records.
Cash-flow waterfall
monthlySold comps — $/sqft
last 12 mo · ≤1 miLoading sold comps…