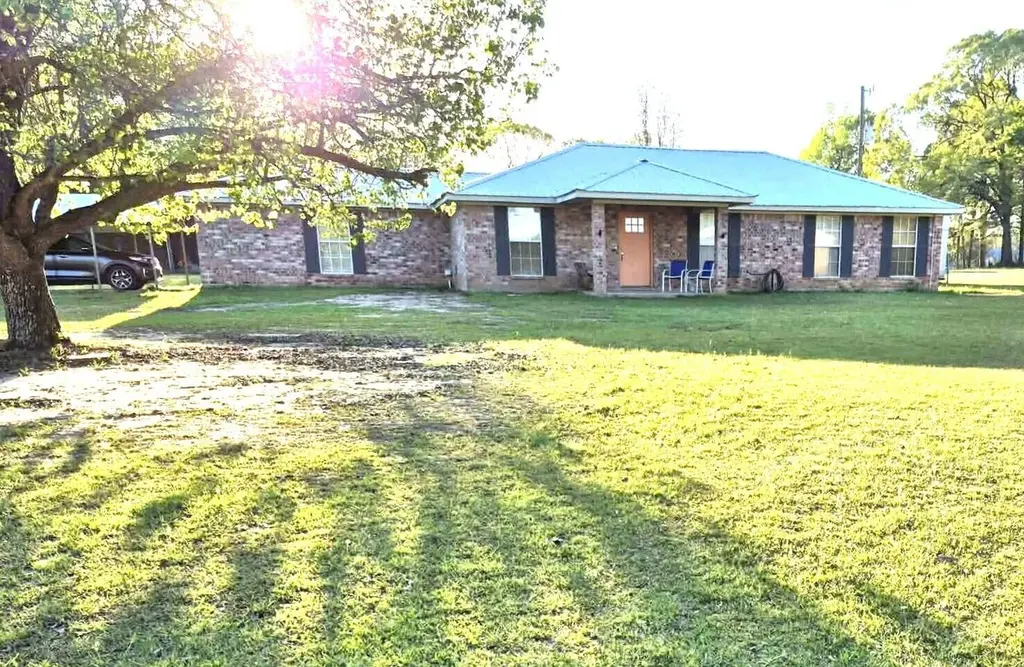
326 Roy Clark Rd · Anacoco, LA
Flood risk 1/10 · Minimal
- FEMA flood zone
- X (unshaded)
- Chance of flooding over 30 yrs
- 0.0%
- Est. flood insurance / yr
- $507 – $1,088
Fire risk 5/10 · Moderate
- Est. fire insurance / yr
- $1,269 – $2,357
Heat risk 8/10 · Major
- Hot days now (above 109°F)
- 7 days/yr
- Hot days in 30 yrs
- 21 days/yr
Wind risk 8/10 · Major
- Chance of severe wind over 30 yrs
- 98.0%
Air-quality risk 1/10 · Minimal
- Unhealthy air days now
- 0 days/yr
- Unhealthy air days in 30 yrs
- 0 days/yr
Risk factors via First Street. Map © Google.
Why this score? — see what drove the C grade
The composite is a weighted blend of 9 inputs, each scored 0–100. Each bar is that input's sub-score; the figure is the points it added to the 100-point composite (weight × sub-score).
- Cash flow +15.7/30.0
- ARV discount +12.6/15.0
- Appreciation +9.1/10.0
- DSCR +4.8/10.0
- Schools +3.6/10.0
- Livability +3.5/5.0
- 1% rule +3.4/10.0
- Rent growth +2.5/5.0
- Condition / age +2.5/5.0
$225,000
🖨 Deal sheet 📄 Offer letter ✓ Due diligence
Listing remarks MLS
Anacoco home has it all--plenty of space, loads of charm, and easy access to Fort Polk! This solid brick beauty brings more than good looks, with a big ol' Additional living area, a beautifully finished interior, a wide front yard, and a fenced backyard perfect for cookouts and good times. Did you want a shed? This 20x30 shop is an absolute dream!Plus, BIG TICKET ITEMS ROOF/AC/HEAT/HOT WATER HEATER HAVE recently replaced. If you've been huntin' for comfort, style, and true Cajun charm, this is the one, sha!
Key facts
- 20x30 shop
- Fenced backyard
- Recently replaced ac
Tags
Neighborhood map
What this means for you Summary
Snapshot
- This is a 3-bed/2.0-bath single-family listed at $225k.
Deal economics
- At list price, monthly cash flow is $100 ($1k/yr) — positive.
- The deal already cash-flows at list — no discount required.
- To meet the 1% rule (rent ≥ 1% of price), the offer needs to be $188k (16.5% below list).
- Recommended offer: $188k (16.5% below list) — sets the bar for 1% rule.
- Cap rate 6.8% vs local median 5.6% in Anacoco — meaningfully above typical; check what's discounted (condition, days-on-market, listing class) to confirm the premium yield is real.
Location & tenants
- Location reads 69/100 on livability (#81 in LA) — a middle-class / working-renter tenant base. Strengths: schools A+, cost of living A+, housing A+; Watch: health & safety C-, crime F, amenities F.
- Vernon Parish (rural): math 35% / reading 51% proficiency, ranked #18 of 98 in LA (top 18%) — families likely to look elsewhere, expect single-tenant / working-renter base with shorter leases.
- Market conditions: 47 active listings in the ZIP; 26 units permitted in Vernon Parish in 2024 (0 in 5+ unit buildings).
Forward outlook
- In year one you build about $20k of equity ($2k loan paydown + $18k appreciation (8.2% local appreciation)).
- Vernon County population projected at -25% by 2050 — secular population decline; favor cash flow + early exit over multi-decade hold.
- At projected returns (8.2% appreciation + 3.0% rent growth), your $63k cash investment doubles in ~3 years — after that, you're playing with house money.
- By year 2, paydown + projected appreciation supports a ~$32k cash-out refi (75% LTV) — recoverable capital for the next deal without selling this one.
Negotiation context
- It's been on market 78 days — a 6% lower offer ($212k) is reasonable based on typical stale-listing flexibility.
- Current owner paid $119k; list at $225k implies a 89% gain — meaningful room to come down on a strong offer.
Risks & watch-outs
- Climate carrying-cost: severe wind risk, 98% chance of damaging wind over 30y; moderate wildfire risk; extreme-heat days projected 7→21/yr by 2055 (HVAC capex compounding) — expect insurance premiums to compound above CPI over the hold.
Questions for the listing agent
- It's been on market 78 days. Have you received any prior offers? Is the seller open to a 16% concession, seller financing, or rate buy-down credit?
- Why hasn't it sold? Are there any deal-killer items the seller is aware of (foundation, flood, title, zoning, code violations)?
- Is there a deadline driving the sale (1031 exchange, divorce, estate, relocation)? That informs how much negotiation room exists.
- Schools are A-rated — typically a magnet for longer-tenancy family renters. What's the average tenant stay here, and is there a school-zone premium baked into asking?
- Crime grade is F in this area — have there been break-ins, vandalism, or insurance claims at this property in the last 3 years? What carrier currently insures it and at what premium?
- What's the average days-on-market for RENTAL listings here right now (not sales)? A rising rental-DOM trend means longer vacancies and softer asking-rent achievability than the comps imply.
- What's the recent tenant-quality profile in this submarket — average credit score on applications, eviction rate, late-payment / NSF rate, and stable-employment percentage? A property-management company in the area should have these aggregated.
- How much new for-sale + rental construction is in the pipeline within 1–3 miles? Heavy new supply typically softens prices + rents 12–24 months out; constrained supply supports both.
Investment metrics
- 1% rule
- 0.84% ✗
- Cap rate
- 6.83%
- Cash-on-cash
- 1.91%
- DSCR
- 1.08
- GRM
- 10.0
CMA / ARV
- ARV (median comp)
- $253,775
- List price
- $225,000
- Delta
- -11.34%
- Verdict
- UNDERPRICED
- Comps
- 12 within 1.0 mi
Show comp detail 3 sales within ~0.75 mi
| Address | Dist | Beds/Ba | Sqft | Sold | Price | $/sf | Match |
|---|---|---|---|---|---|---|---|
| 163 Loop Rd | 0.23mi | 3/2.0 | 1,850 (+4%) | 18mo | $199,900 | $108 | 68 |
| 5128 West St | 0.66mi | 3/2.0 | 1,644 (-8%) | 6mo | $165,000 | $100 | 52 |
| 5195 West St | 0.71mi | 3/2.0 | 1,558 (-12%) | 15mo | $274,000 | $176 | 34 |
Match score weights: distance 35% · size 25% · config 20% · recency 20%. Top-matched comps best support the ARV.
Projected returns pro-forma
8.17% appreciation · 3.0% rent growth · sell at horizon
- IRR
- 21.8%
- Equity multiple
- 2.61×
- Total profit
- $101,409
- Equity at exit
- $173,508
- IRR
- 20.0%
- Equity multiple
- 5.59×
- Total profit
- $289,443
- Equity at exit
- $346,892
Cash invested: $63,000 (down + closing). Projections, not guarantees.
Landlord ↔ Tenant lean methodology
- Overall (STATE)
- 90 Strongly Landlord-Friendly
- State Louisiana
- 90 Strongly Landlord-Friendly · R+12
- County
- — inherits STATE
- City
- — inherits STATE
ZIP-level market 71403
- Home prices YoY
- 4.6%
- Active inventory
- 47
- Price-to-rent
- 10.0×
Monthly cashflow live
- Estimated rent
- $1,879 medium interval (Pro) →
- Mortgage (P&I)
- −$1,180
- Tax from tax record
- −$111 /mo · $1,328/yr
- Insurance
- −$94
- HOA
- −$0
- Vacancy / Maint / Mgmt
- −$395
- Net cashflow
- $100
Break-even live
UW: 25.0% down · 7.5% · 30yr · 1.5% tax · 5.0% vac · 8.0% maint · 8.0% mgmt
Financing live
Cash to close
- Down payment
- $56,250
- Closing costs
- $6,750
- Reserves months
- —
- Total cash needed
- —
Loan-product check · same deal, 3 products live
Conventional
25% down · 7.5% · 30yr
- Down + closing
- —
- Monthly P&I
- —
- Monthly cashflow
- —
- DSCR
- —
- Eligible?
- —
Personal DTI + credit; lowest rate.
DSCR
20% down · 8.5% · 30yr
- Down + closing
- —
- Monthly P&I
- —
- Monthly cashflow
- —
- DSCR
- —
- Eligible?
- —
No personal income docs; deal must DSCR.
Hard money
10% down · 12.0% · 12mo
- Down + closing
- —
- Monthly P&I
- —
- Monthly cashflow
- —
- DSCR
- —
- Eligible?
- —
Short-term bridge; refi at stabilization.
Listing history 18 events
-
2026-06-19days on market $225,000 Active 78 DOM
-
2026-06-18days on market $225,000 Active 77 DOM
-
2026-06-17days on market $225,000 Active 76 DOM
-
2026-06-16days on market $225,000 Active 75 DOM
-
2026-06-15days on market $225,000 Active 74 DOM
-
2026-06-14days on market $225,000 Active 72 DOM
-
2026-06-12days on market $225,000 Active 71 DOM
-
2026-06-09days on market $225,000 Active 68 DOM
-
2026-06-08days on market $225,000 Active 67 DOM
-
2026-06-07days on market $225,000 Active 66 DOM
-
2026-06-07days on market $225,000 Active 65 DOM
-
2026-06-04days on market $225,000 Active 62 DOM
-
2026-06-02days on market $225,000 Active 61 DOM
-
2026-06-01days on market $225,000 Active 60 DOM
-
2026-05-31days on market $225,000 Active 59 DOM
-
2026-05-31days on market $225,000 Active 58 DOM
-
2026-04-02$225,000 Active 514-char remark
Show marketing remark (514 chars)
Anacoco home has it all--plenty of space, loads of charm, and easy access to Fort Polk! This solid brick beauty brings more than good looks, with a big ol' Additional living area, a beautifully finished interior, a wide front yard, and a fenced backyard perfect for cookouts and good times. Did you want a shed? This 20x30 shop is an absolute dream!Plus, BIG TICKET ITEMS ROOF/AC/HEAT/HOT WATER HEATER HAVE recently replaced. If you've been huntin' for comfort, style, and true Cajun charm, this is the one, sha!
-
2010-06-03soldstatus $119,000
ⓘ Source: listings_history table (triggers on properties + properties_extension) + one-shot
backfill from property_details.listing_events for pre-trigger history.
Tax reassessment forecast LA · Resets to sale price
- Current annual tax
- $1,328 · $111/mo
- Projected year-2 tax
- $1,328 · $111/mo
- Expected delta
- $0/yr ($0/mo · 0.0%)
ⓘ Screening estimate from a state-policy table — verify with the county assessor before closing.
Climate risk First Street
- Flood 1/10 Low FEMA zone X (unshaded) · 0% chance over 30 yrs
- Wildfire 5/10 Major
- Heat 8/10 Severe 7 d/yr ≥109°F today · 21 d/yr by 30 yrs out
- Wind 8/10 Severe 98% chance of damaging wind over 30 yrs
- Air quality 1/10 Low 0 unhealthy d/yr today · 0 by 30 yrs out
Nearby sold comps map
Loading sold comps map…
Walkable amenities ~0.75 mi
Loading nearby amenities…
Taxation est. · year 1
- Rental income
- $22,551
- − Mortgage interest
- −$12,603
- − Property taxes
- −$1,328
- − Insurance
- −$1,125
- − Repairs & maintenance
- −$1,804
- − Management
- −$1,804
- − Depreciation
- −$6,545
- Taxable loss
- −$2,660
- Est. tax savings @ 24.0%
- +$638
- After-tax cash flow
- $1,841/yr
For passive investors: Depreciation is non-cash, so a rental often shows a tax loss while cash-flowing — sheltering income. Rental losses are passive: they offset passive income freely, and up to $25,000/yr can offset ordinary (W-2) income if you actively participate and your MAGI is under $100k (phasing out to $0 by $150k); unused losses carry forward. On sale, claimed depreciation is recaptured at up to 25%, and gains may owe capital-gains tax (a 1031 exchange can defer both). Figures are a year-1 estimate at your 24.0% rate — not tax advice; consult a CPA.
Schools (NCES district)
- District
- Vernon Parish
- NCES district ID
- 2201830
- Math proficiency
- 35% ▼ -42.00%
- Reading proficiency
- 51% ▼ -32.00%
- Median HH income
- $44,822
- Composite
- 36.42/100
- National rank
- #4674
- State rank
- #18 of 98 in LA
Livability — Anacoco
- Score
- 69/100
- State rank
- #81
- US rank
- #9004
Category grades
Schools grade is shown separately in the Schools card above.
Census & demographics
- Census place
- Anacoco, LA
- Population (ZIP)
- 3,792
Population outlook (Vernon County) Hauer SSP2
- Today (2025)
- 45,401 people
- By 2030
- 43,015 · -5.3%
- By 2040
- 38,171 · -15.9%
- By 2050
- 34,087 · -24.9%
- By 2075
- 28,267 · -37.7%
- By 2100
- 25,486 · -43.9%
Race, ethnicity, and origin ACS 2023
- Neighborhood character
- Predominantly White (85%)
- Race & ethnicity
- White 85% Hispanic / Latino 8% Two or more races 6% Native American 2% Asian 2%
- Hispanic origin (detail)
- Mexican 5%
- Common ancestry
- Lithuanian 5% Slovak 1% Portuguese 1%
- Foreign-born
- 4% · Canada
- Languages at home
- 96% English-only · Spanish 2% Tagalog/Filipino 1%
Political lean MEDSL · Vernon
- 2024 margin
- Solid R (+67.9) · D 15.6% · R 83.4% · Other 1.0%
- 2008→2024 swing
- -14.5pp toward R · 2008: -53.4pp · 2024: -67.9pp
- All cycles
- 2024: R+67.9 2020: R+64.9 2016: R+65.0 2012: R+57.5 2008: R+53.4
Not yet ingested
- Civics
- —
Market trends
- HPI YoY
- ▲ 8.17%
- Current HPI
- 186.1416
- Rent YoY
- —
- Metro
- —
- State GDP YoY
- ▲ 3.29%
- F500 in state
- 10
Industry mix (Fortune 500 HQ in LA)
| Industry | F500 HQs | Revenue |
|---|---|---|
| Telecommunications | 2 | $23B |
|
||
| Utilities | 1 | $12B |
|
||
| Wholesale / Distribution | 1 | $5B |
|
||
| Advertising | 1 | $2B |
|
||
Price history
+89.1% since first listed2 events — show timeline
- 2026-04-02 Listed $225,000 GFPAR
- 2010-06-03 Sold (Public Records) $119,000 Public Records
Property tax history
-1.4%/yrLatest (2025): $1,328 · -1.4% YoY. Source: county tax records.
Cash-flow waterfall
monthlySold comps — $/sqft
last 12 mo · ≤1 miLoading sold comps…