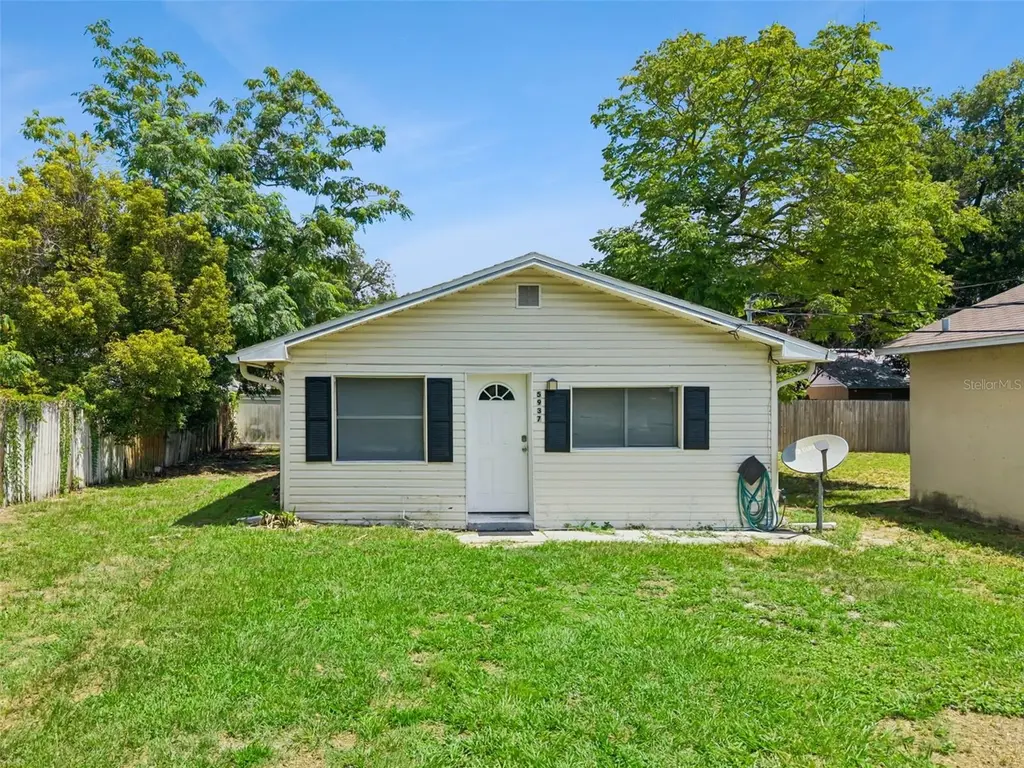
5937 Rosette St · Orlovista, FL
Flood risk 1/10 · Minimal
- FEMA flood zone
- X (unshaded)
- Chance of flooding over 30 yrs
- 0.0%
- Est. flood insurance / yr
- $507 – $1,088
Fire risk 2/10 · Minimal
- Est. fire insurance / yr
- $947 – $1,759
Heat risk 9/10 · Severe
- Hot days now (above 108°F)
- 7 days/yr
- Hot days in 30 yrs
- 23 days/yr
Wind risk 9/10 · Severe
- Chance of severe wind over 30 yrs
- 99.0%
Air-quality risk 1/10 · Minimal
- Unhealthy air days now
- 0 days/yr
- Unhealthy air days in 30 yrs
- 0 days/yr
Risk factors via First Street. Map © Google.
Why this score? — see what drove the C grade
The composite is a weighted blend of 9 inputs, each scored 0–100. Each bar is that input's sub-score; the figure is the points it added to the 100-point composite (weight × sub-score).
- Cash flow +23.8/30.0
- DSCR +7.7/10.0
- ARV discount +7.5/15.0
- 1% rule +5.8/10.0
- Schools +4.1/10.0
- Livability +3.7/5.0
- Condition / age +2.5/5.0
- Rent growth +2.2/5.0
- Appreciation +0.0/10.0
$149,999
🖨 Deal sheet 📄 Offer letter ✓ Due diligence
Listing remarks MLS
WOW ! GREAT INVESTMENT OPPORTUNITY DON'T LESS THIS PASS BY. .. FIXXER UPPER, HANDY MAN SPECIAL. GREAT LOCATION AND EXCELLENT SCHOOLS.
Key facts
- Open floor plan
- Space for gardening
- 5,642 sq ft lot
Tags
Property features AI
Finance
- Other: Property type: Residential (R-1 zoning); Lot about 0.13 acres
- HOA & community: No association
Exterior
- Utilities: Public water; Septic tank sewer; Public utilities
- Home design: Single family residence; One story; South-facing
- Construction: Wood siding; Shingle roof; Other foundation
- Exterior features: Paved road access
Interior
- Kitchen: No appliances included
- Bedrooms: 2 bedrooms
- Flooring: Laminate flooring; Tile flooring
- Bathrooms: 1 full bathroom
- Heating & cooling: Electric heating; Central air conditioning
- Interior features: Kitchen and family room combined; 5 total rooms
- Laundry & utility: Laundry: Other setup
Neighborhood map
What this means for you Summary
Snapshot
- This is a 2-bed/1.0-bath single-family listed at $150k.
Deal economics
- At list price, monthly cash flow is $288 ($3k/yr) — positive.
- The deal already cash-flows at list — no discount required.
- Meets the 1% rule at list price ($2k rent vs $150k).
Location & tenants
- Location reads 74/100 on livability (#268 in FL, #4,405 nationally) — a middle-class / working-renter tenant base. Strengths: commute A+, cost of living A+, housing A+; Watch: employment D, amenities F.
- Orange (suburban): math 46% / reading 51% proficiency, ranked #43 of 73 in FL (top 59%) — families likely to look elsewhere, expect single-tenant / working-renter base with shorter leases.
- Market conditions: Rents soft (-1.2%/yr); 376 active listings in the ZIP; 40 comparable units currently listed for rent nearby; rentals at typical pace (median 18d on market — plan ~3-4 weeks tenant-placement turnaround); 8,053 units permitted in Orange County in 2024 (3,133 in 5+ unit buildings).
Forward outlook
- Local home prices are declining (-3.0%/yr); year-one equity from $1k of loan paydown is wiped out by about $4k of value loss. Plan a longer hold.
- Orange County population projected at +52% by 2050 — long-run rental-demand tailwind backs the buy-and-hold thesis.
Negotiation context
- Only 1 days on market — expect competitive offers; lowballing is unlikely to land.
- 3 sale attempts since 20y ago with the ask held roughly flat each time — persistent listings suggest the price (not the market) is what's stuck; bring a comps-based counter.
- Current owner paid $102k; 47% above their basis — modest negotiation headroom, anchor on the comps not their cost.
Risks & watch-outs
- Watch-outs: built in 1956 — expect roof / HVAC / electrical / plumbing capex.
- Climate carrying-cost: severe wind risk, 99% chance of damaging wind over 30y; extreme-heat days projected 7→23/yr by 2055 (HVAC capex compounding) — expect insurance premiums to compound above CPI over the hold.
Questions for the listing agent
- Built in 1956 — when were the roof, HVAC, electrical panel, plumbing, and water heater last replaced?
- Is there a deadline driving the sale (1031 exchange, divorce, estate, relocation)? That informs how much negotiation room exists.
- Schools are B-rated — typically a magnet for longer-tenancy family renters. What's the average tenant stay here, and is there a school-zone premium baked into asking?
- What's the average days-on-market for RENTAL listings here right now (not sales)? A rising rental-DOM trend means longer vacancies and softer asking-rent achievability than the comps imply.
- What's the recent tenant-quality profile in this submarket — average credit score on applications, eviction rate, late-payment / NSF rate, and stable-employment percentage? A property-management company in the area should have these aggregated.
- How much new for-sale + rental construction is in the pipeline within 1–3 miles? Heavy new supply typically softens prices + rents 12–24 months out; constrained supply supports both.
Investment metrics
- 1% rule
- 1.08% ✓
- Cap rate
- 8.60%
- Cash-on-cash
- 8.23%
- DSCR
- 1.37
- GRM
- 7.7
CMA / ARV
No comps found within radius.
Projected returns pro-forma
-3.0% appreciation · 0.0% rent growth · sell at horizon
- IRR
- -7.1%
- Equity multiple
- 0.75×
- Total profit
- $-10,709
- Equity at exit
- $22,365
- IRR
- -1.6%
- Equity multiple
- 0.90×
- Total profit
- $-4,060
- Equity at exit
- $12,969
Cash invested: $42,000 (down + closing). Projections, not guarantees.
Landlord ↔ Tenant lean methodology
- Overall (STATE)
- 87 Strongly Landlord-Friendly
- State Florida
- 87 Strongly Landlord-Friendly · R+3
- County
- — inherits STATE
- City
- — inherits STATE
ZIP-level market 32835
- Home prices YoY
- -31.7%
- Rents YoY
- -1.2%
- Active inventory
- 376
- Price-to-rent
- 7.7×
Monthly cashflow live
- Estimated rent
- $1,620 high interval (Pro) →
- Mortgage (P&I)
- −$787
- Tax from tax record
- −$143 /mo · $1,713/yr
- Insurance
- −$62
- HOA
- −$0
- Vacancy / Maint / Mgmt
- −$340
- Net cashflow
- $288
Break-even live
UW: 25.0% down · 7.5% · 30yr · 1.5% tax · 5.0% vac · 8.0% maint · 8.0% mgmt
Financing live
Cash to close
- Down payment
- $37,500
- Closing costs
- $4,500
- Reserves months
- —
- Total cash needed
- —
Loan-product check · same deal, 3 products live
Conventional
25% down · 7.5% · 30yr
- Down + closing
- —
- Monthly P&I
- —
- Monthly cashflow
- —
- DSCR
- —
- Eligible?
- —
Personal DTI + credit; lowest rate.
DSCR
20% down · 8.5% · 30yr
- Down + closing
- —
- Monthly P&I
- —
- Monthly cashflow
- —
- DSCR
- —
- Eligible?
- —
No personal income docs; deal must DSCR.
Hard money
10% down · 12.0% · 12mo
- Down + closing
- —
- Monthly P&I
- —
- Monthly cashflow
- —
- DSCR
- —
- Eligible?
- —
Short-term bridge; refi at stabilization.
Rent comps 40 comps
| Address | Beds | Baths | Sqft | Rent | $/sqft | DOM | Units | Dist |
|---|---|---|---|---|---|---|---|---|
| 5971 Westgate Dr #1213 Orlando, FL | 2.0 | 2.0 | 1077 | $1,580 | $1.47 | 20d | 1 | 0.04mi |
| 6025 Westgate Dr #2512 Orlando, FL | 2.0 | 2.0 | 1077 | $1,595 | $1.48 | 2d | 1 | 0.14mi |
| 6025 Westgate Dr Orlando, FL | 1.0–2.0 | 1.0–2.0 | 895 | $1,595 | $1.78 | 2d | 3 | 0.14mi |
| 6025 Westgate Dr Orlando, FL | 1.0–2.0 | 1.0–2.0 | 895 | $1,595 | $1.78 | 2d | 2 | 0.14mi |
| 6029 Westgate Dr #712 Orlando, FL | 2.0 | 2.0 | 1077 | $1,599 | $1.48 | 23d | 1 | 0.15mi |
| 5956 Westgate Dr #102 Orlando, FL | 1.0 | 1.0 | 686 | $1,275 | $1.86 | 21d | 1 | 0.17mi |
| 464 S Kirkman Rd Orlando, FL | 1.0–3.0 | 1.0–2.0 | 977 | $1,890 | $1.93 | 2d | 19 | 0.20mi |
| 6022 Westgate Dr Orlando, FL | 2.0 | 1.0–1.5 | 894 | $1,488 | $1.66 | 23d | 2 | 0.21mi |
| 6028 Westgate Dr #102 Orlando, FL | 1.0 | 1.0 | 686 | $1,250 | $1.82 | 7d | 1 | 0.22mi |
| 6022 Westgate Dr Orlando, FL | 2.0 | 1.5 | 894 | $1,525 | $1.71 | 17d | 1 | 0.22mi |
| 6071 Westgate Dr #313 Orlando, FL | 1.0 | 1.0 | 713 | $1,400 | $1.96 | 7d | 1 | 0.23mi |
| 6124 Westgate Dr #104 Orlando, FL | 2.0 | 2.0 | 943 | $1,495 | $1.59 | 23d | 1 | 0.24mi |
| 6016 Westgate Dr #204 Orlando, FL | 2.0 | 2.0 | 991 | $1,700 | $1.72 | 14d | 1 | 0.24mi |
| 6004 Westgate Dr #104 Orlando, FL | 1.0 | 1.0 | 566 | $1,300 | $2.30 | 4d | 1 | 0.26mi |
| 6004 Westgate Dr #102 Orlando, FL | 1.0 | 1.0 | 566 | $1,295 | $2.29 | 23d | 1 | 0.26mi |
| 5915 Raleigh St Orlando, FL | 1.0–3.0 | 1.0–2.0 | 1039 | $2,338 | $2.25 | 1d | 28 | 0.33mi |
| 6101 Raleigh St Orlando, FL | 1.0–4.0 | 1.0–2.0 | 1120 | $1,627 | $1.45 | 2d | 41 | 0.36mi |
| 6168 Raleigh St Orlando, FL | 1.0–4.0 | 1.0–2.0 | 1261 | $1,829 | $1.45 | 2d | 34 | 0.50mi |
| 907 S Kirkman Rd Orlando, FL | 2.0–4.0 | 2.0 | 1131 | $1,450 | $1.28 | 3d | 14 | 0.53mi |
| 1065 S Hiawassee Rd #1435 Orlando, FL | 1.0 | 1.0 | 673 | $1,400 | $2.08 | 21d | 1 | 0.58mi |
| 6312 Raleigh St #504 Orlando, FL | 2.0 | 2.0 | 1029 | $1,600 | $1.55 | 21d | 1 | 0.58mi |
| 1037 S Hiawassee Rd #2818 Orlando, FL | 2.0 | 2.0 | 934 | $1,900 | $2.03 | 3d | 1 | 0.59mi |
| 6316 Raleigh St #414 Orlando, FL | 1.0 | 1.0 | 991 | $1,600 | $1.61 | 20d | 1 | 0.59mi |
| 1037 S Hiawassee Rd Orlando, FL | 1.0–2.0 | 1.0–2.0 | 780 | $1,900 | $2.43 | 23d | 2 | 0.59mi |
| 6328 Raleigh St #815 Orlando, FL | 1.0 | 1.0 | 991 | $1,600 | $1.61 | 23d | 1 | 0.60mi |
| 1039 S Hiawassee Rd #2928 Orlando, FL | 2.0 | 2.0 | 934 | $1,800 | $1.93 | 17d | 1 | 0.61mi |
| 1063 S Hiawassee Rd #1628 Orlando, FL | 2.0 | 2.0 | 836 | $1,600 | $1.91 | 3d | 1 | 0.61mi |
| 6324 Raleigh St Orlando, FL | 2.0 | 2.0 | 1062 | $1,725 | $1.62 | 23d | 1 | 0.61mi |
| 1063 S Hiawassee Rd Orlando, FL | 1.0–2.0 | 1.0–2.0 | 731 | $1,600 | $2.19 | 23d | 2 | 0.61mi |
| 6324 Raleigh St #714 Orlando, FL | 2.0 | 2.0 | 1062 | $1,700 | $1.60 | 21d | 1 | 0.62mi |
| 6416 Raleigh St #2612 Orlando, FL | 1.0 | 1.0 | 991 | $1,450 | $1.46 | 20d | 1 | 0.62mi |
| 1041 S Hiawassee Rd #3023 Orlando, FL | 2.0 | 2.0 | 836 | $1,395 | $1.67 | 7d | 1 | 0.63mi |
| 1079 S Hiawassee Rd #1114 Orlando, FL | 1.0 | 1.0 | 673 | $1,100 | $1.63 | 21d | 1 | 0.64mi |
| 6340 Raleigh St #1011 Orlando, FL | 1.0 | 1.0 | 991 | $1,600 | $1.61 | 3d | 1 | 0.65mi |
| 1033 S Hiawassee Rd Orlando, FL | 2.0 | 2.0 | 832 | $1,545 | $1.86 | 7d | 1 | 0.66mi |
| 1033 S Hiawassee Rd Orlando, FL | 1.0–2.0 | 1.0–2.0 | 731 | $1,490 | $2.04 | 1d | 3 | 0.66mi |
| 1033 S Hiawassee Rd Orlando, FL | 2.0 | 2.0 | 832 | $1,442 | $1.73 | 2d | 2 | 0.66mi |
| 403 Crabtree Ave Orlando, FL | 3.0 | 2.0 | 1105 | $2,095 | $1.90 | 23d | 1 | 0.66mi |
| 1081 S Hiawassee Rd #722 Orlando, FL | 2.0 | 2.0 | 836 | $1,470 | $1.76 | 21d | 1 | 0.66mi |
| 1077 S Hiawassee Rd #824 Orlando, FL | 2.0 | 2.0 | 836 | $1,700 | $2.03 | 3d | 1 | 0.66mi |
Listing history 2 events
-
2026-06-18remarks 621-char remark
-
2026-06-18$149,999 Active 1 DOM
ⓘ Source: listings_history table (triggers on properties + properties_extension) + one-shot
backfill from property_details.listing_events for pre-trigger history.
Tax reassessment forecast FL · Resets to sale price
- Current annual tax
- $1,713 · $143/mo
- Projected year-2 tax
- $1,713 · $143/mo
- Expected delta
- $0/yr ($0/mo · 0.0%)
ⓘ Screening estimate from a state-policy table — verify with the county assessor before closing.
Climate risk First Street
- Flood 1/10 Low FEMA zone X (unshaded) · 0% chance over 30 yrs
- Wildfire 2/10 Low
- Heat 9/10 Extreme 7 d/yr ≥108°F today · 23 d/yr by 30 yrs out
- Wind 9/10 Extreme 99% chance of damaging wind over 30 yrs
- Air quality 1/10 Low 0 unhealthy d/yr today · 0 by 30 yrs out
Nearby sold comps map
Loading sold comps map…
Walkable amenities ~0.75 mi
Loading nearby amenities…
Taxation est. · year 1
- Rental income
- $19,442
- − Mortgage interest
- −$8,402
- − Property taxes
- −$1,713
- − Insurance
- −$750
- − Repairs & maintenance
- −$1,555
- − Management
- −$1,555
- − Depreciation
- −$4,364
- Taxable income
- $1,103
- Est. tax owed @ 24.0%
- −$265
- After-tax cash flow
- $3,192/yr
For passive investors: Depreciation is non-cash, so a rental often shows a tax loss while cash-flowing — sheltering income. Rental losses are passive: they offset passive income freely, and up to $25,000/yr can offset ordinary (W-2) income if you actively participate and your MAGI is under $100k (phasing out to $0 by $150k); unused losses carry forward. On sale, claimed depreciation is recaptured at up to 25%, and gains may owe capital-gains tax (a 1031 exchange can defer both). Figures are a year-1 estimate at your 24.0% rate — not tax advice; consult a CPA.
Schools (NCES district)
- District
- Orange
- NCES district ID
- 1201440
- Math proficiency
- 46% ▼ -9.00%
- Reading proficiency
- 51% ▼ -2.00%
- Median HH income
- $49,350
- Composite
- 41.47/100
- National rank
- #3461
- State rank
- #43 of 73 in FL
Livability — Orlovista
- Score
- 74/100
- State rank
- #268
- US rank
- #4405
Category grades
Schools grade is shown separately in the Schools card above.
Census & demographics
- Census place
- Orlovista, FL
- County
- Orange County · 1,471,359 people
- Metro
- Orlando-Kissimmee-Sanford, FL
- Population (ZIP)
- 49,205
- Household income
- $71,418
- Rent vs Own
- Severe rent burden
- 2914.0
Population outlook (Orange County) Hauer SSP2
- Today (2025)
- 1,618,226 people
- By 2030
- 1,787,404 · +10.5%
- By 2040
- 2,125,621 · +31.4%
- By 2050
- 2,454,016 · +51.6%
- By 2075
- 3,173,711 · +96.1%
- By 2100
- 3,607,781 · +122.9%
Race, ethnicity, and origin ACS 2023
- Neighborhood character
- Highly diverse neighborhood (Simpson 0.79)
- Race & ethnicity
- White 33% Hispanic / Latino 24% Black 19% Two or more races 19% Asian 11%
- Hispanic origin (detail)
- Mexican 1% Puerto Rican 7% Cuban 2% Dominican 1%
- Common ancestry
- Estonian 9% Hispanic 7% Russian 2%
- Foreign-born
- 38% · Canada, Vietnam, Jamaica
- Languages at home
- 51% English-only · Spanish 18% Other Indo-European 17% French/Haitian/Cajun 6%
Political lean MEDSL · Orange
- 2024 margin
- D (+13.6) · D 56.1% · R 42.5% · Other 1.3%
- 2008→2024 swing
- -5.0pp toward R · 2008: 18.6pp · 2024: 13.6pp
- All cycles
- 2024: D+13.6 2020: D+23.1 2016: D+24.6 2012: D+18.2 2008: D+18.6
Not yet ingested
- Civics
- —
Market trends
- HPI YoY
- ▼ -116.26%
- Current HPI
- 250.6804
- Rent YoY
- ▼ -1.21%
- Metro
- Orlando-Kissimmee-Sanford, FL
- State GDP YoY
- ▲ 3.28%
- F500 in state
- 36
Industry mix (Fortune 500 HQ in FL)
| Industry | F500 HQs | Revenue |
|---|---|---|
| Industrial Technology | 2 | $29B |
|
||
| Insurance | 2 | $17B |
|
||
| Retail | 1 | $60B |
|
||
| Technology Distribution | 1 | $58B |
|
||
| Homebuilding | 1 | $35B |
|
||
| Technology Manufacturing | 1 | $35B |
|
||
Price history
+172.7% since first listed6 events — show timeline
- 2026-06-18 Listed $149,999 Stellar MLS as Distributed by MLS Grid
- 2007-07-09 Listed $184,950 Stellar MLS as Distributed by MLS Grid
- 2006-08-21 Sold (Public Records) $102,000 Public Records
- 2006-08-07 Sold (MLS) $102,000 Stellar MLS as Distributed by MLS Grid
- 2006-04-26 Listed $119,000 Stellar MLS as Distributed by MLS Grid
- 1999-03-05 Sold (Public Records) $55,000 Public Records
Property tax history
+7.8%/yrLatest (2025): $1,713 · +10.8% YoY. Source: county tax records.
Cash-flow waterfall
monthlySold comps — $/sqft
last 12 mo · ≤1 miLoading sold comps…