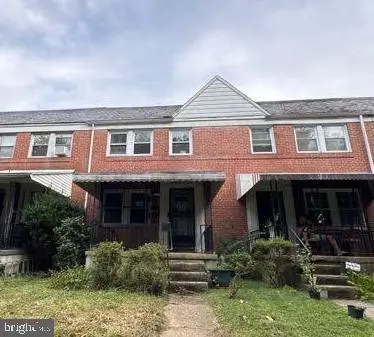
2207 Monticello Rd · Baltimore, MD
Flood risk 1/10 · Minimal
- FEMA flood zone
- X (unshaded)
- Chance of flooding over 30 yrs
- 0.0%
- Est. flood insurance / yr
- $473 – $860
Fire risk 1/10 · Minimal
- Est. fire insurance / yr
- $755 – $1,403
Heat risk 6/10 · Moderate
- Hot days now (above 103°F)
- 7 days/yr
- Hot days in 30 yrs
- 15 days/yr
Wind risk 5/10 · Moderate
- Chance of severe wind over 30 yrs
- 23.0%
Air-quality risk 3/10 · Minor
- Unhealthy air days now
- 3 days/yr
- Unhealthy air days in 30 yrs
- 4 days/yr
Risk factors via First Street. Map © Google.
Why this score? — see what drove the B+ grade
The composite is a weighted blend of 9 inputs, each scored 0–100. Each bar is that input's sub-score; the figure is the points it added to the 100-point composite (weight × sub-score).
- Cash flow +30.0/30.0
- ARV discount +15.0/15.0
- 1% rule +10.0/10.0
- DSCR +10.0/10.0
- Rent growth +4.0/5.0
- Livability +3.8/5.0
- Condition / age +2.5/5.0
- Schools +1.0/10.0
- Appreciation +0.0/10.0
$92,000
🖨 Deal sheet (PDF) 📄 Offer letter ✓ Due diligence
Listing remarks
Discover potential and value Built in 1945, this property offers 3 bedrooms and 2.5 Bath ready to customize and update to your taste. Sold in as-is condition, it presents a canvas for transformation and improvement, ideal for those looking to invest and add value. Please note this property is being sold strictly as-is. Cash or Renovation Financing may be needed for purchase.
Key facts
- Built 1945
- Listed 7 days
Property features AI
Finance
- HOA & community: Ground rent payable annually ($96); Other annual fee $96
Exterior
- Parking: On-street parking
- Utilities: Public water; Public sewer; Electric for cooling; Natural gas for heating and hot water
- Home design: Interior townhouse/rowhouse; Brick construction; Estimated year built
- Construction: Brick exterior; Other foundation; Above-grade and below-grade structures
- Exterior features: Rear yard; Outside entrance to the basement
Interior
- Bedrooms: Three bedrooms on the upper level
- Bathrooms: Two full bathrooms; One half bathroom
- Heating & cooling: Radiator heating; Ceiling fan cooling; Natural gas heating and hot water
- Interior features: Ceiling fans
Neighborhood map
What this means for you Summary
Snapshot
- This is a 3-bed/1.5-bath townhouse listed at $92k.
Deal economics
- At list price, monthly cash flow is $444 ($5k/yr) — positive.
- The deal already cash-flows at list — no discount required.
- Meets the 1% rule at list price ($2k rent vs $92k).
- Cap rate 12.1% vs local median 6.0% in Baltimore — top-decile yield for the area; either an underpriced asset or a hidden risk that comps aren't pricing in. Stress-test before assuming the spread holds.
Location & tenants
- Location reads 76/100 on livability (#90 in MD, #3,396 nationally) — a middle-class / working-renter tenant base. Strengths: amenities A+, commute A+, housing A+; Watch: schools D, crime F.
- Baltimore City Public Schools (urban): math 7% / reading 16% proficiency, ranked #24 of 24 in MD (top 100%) — low school quality limits family demand, transient renter base, plan for 1-2y turnover; 79% free/reduced lunch — lower-income household profile, screen leases tightly.
- Market conditions: Rents rising fast (+6.1%/yr); 252 active listings in the ZIP; 40 comparable units currently listed for rent nearby; rentals at typical pace (median 25d on market — plan ~3-4 weeks tenant-placement turnaround); 40% of comp listings sitting > 30 days — soft ceiling on asking rent; lower-income renter base — watch delinquency; 1,273 units permitted in Baltimore city in 2024 (1,104 in 5+ unit buildings).
- This rent runs 44% of the median local income ($42k/yr) — at the standard rent-burdened threshold; future hikes will face affordability resistance.
Forward outlook
- Local home prices are declining (-3.0%/yr); year-one equity from $636 of loan paydown is wiped out by about $3k of value loss. Plan a longer hold.
- Baltimore County population projected to shrink 4% by 2050 — rents likely to lag national; underwrite the cash flow, not the appreciation.
- At projected returns (-3.0% appreciation + 6.1% rent growth), your $26k cash investment doubles in ~5 years — after that, you're playing with house money.
Negotiation context
- Only 7 days on market — expect competitive offers; lowballing is unlikely to land.
- 7 sale attempts since 3y ago with the ask held roughly flat each time — persistent listings suggest the price (not the market) is what's stuck; bring a comps-based counter.
Risks & watch-outs
- Watch-outs: property tax is 3.2% of price; built in 1945 — expect roof / HVAC / electrical / plumbing capex.
- Climate carrying-cost: moderate wind risk, 23% chance of damaging wind over 30y; extreme-heat days projected 7→15/yr by 2055 (HVAC capex compounding) — expect insurance premiums to compound above CPI over the hold.
Questions for the listing agent
- Built in 1945 — when were the roof, HVAC, electrical panel, plumbing, and water heater last replaced?
- Property tax is high relative to price — has the assessment been appealed recently, and will the sale trigger a re-assessment?
- Is there a deadline driving the sale (1031 exchange, divorce, estate, relocation)? That informs how much negotiation room exists.
- Schools are D-rated, which usually means shorter tenancies and higher turnover. Who's the typical renter profile here, and what's been the actual vacancy rate?
- Crime grade is F in this area — have there been break-ins, vandalism, or insurance claims at this property in the last 3 years? What carrier currently insures it and at what premium?
- What's the average days-on-market for RENTAL listings here right now (not sales)? A rising rental-DOM trend means longer vacancies and softer asking-rent achievability than the comps imply.
- What's the recent tenant-quality profile in this submarket — average credit score on applications, eviction rate, late-payment / NSF rate, and stable-employment percentage? A property-management company in the area should have these aggregated.
- How much new for-sale + rental construction is in the pipeline within 1–3 miles? Heavy new supply typically softens prices + rents 12–24 months out; constrained supply supports both.
Investment metrics
- 1% rule
- 1.67% ✓
- Cap rate
- 12.08%
- Cash-on-cash
- 20.67%
- DSCR
- 1.92
- GRM
- 5.0
CMA / ARV
- ARV (median comp)
- $167,002
- List price
- $92,000
- Delta
- -44.91%
- Verdict
- UNDERPRICED
- Comps
- 20 within 1.0 mi
Show comp detail 12 sales within ~0.75 mi
| Address | Dist | Beds/Ba | Sqft | Sold | Price | $/sf | Match |
|---|---|---|---|---|---|---|---|
| 2127 Allendale Rd | 0.28mi | 3/2.5 | 1,152 (0%) | 19mo | $220,000 | $191 | 67 |
| 1916 Chelsea Rd | 0.33mi | 3/2.0 | 1,168 (+1%) | 16mo | $182,000 | $156 | 67 |
| 3929 Duvall Ave | 0.42mi | 3/2.5 | 1,248 (+8%) | 6mo | $270,000 | $216 | 58 |
| 4145 Fairfax Rd | 0.53mi | 4/2.0 (+1) | 1,260 (+9%) | 5mo | $230,500 | $183 | 49 |
| 4013 Norfolk Ave | 0.75mi | 3/2.0 | 1,140 (-1%) | 17mo | $165,000 | $145 | 48 |
| 3901 Fairfax Rd | 0.62mi | 4/2.0 (+1) | 1,160 (+1%) | 21mo | $149,995 | $129 | 45 |
| 4201 Bonner Rd | 0.60mi | 3/1.5 | 1,230 (+7%) | 22mo | $180,000 | $146 | 42 |
| 4104 Fairfax Rd | 0.57mi | 4/3.0 (+1) | 1,200 (+4%) | 18mo | $240,000 | $200 | 40 |
| 4227 Norfolk Ave | 0.72mi | 3/2.5 | 1,280 (+11%) | 16mo | $142,000 | $111 | 30 |
| 4029 Fairfax Rd | 0.57mi | 4/2.0 (+1) | 1,287 (+12%) | 20mo | $205,000 | $159 | 30 |
| 4007 Fairfax Rd | 0.59mi | 4/3.0 (+1) | 1,287 (+12%) | 18mo | $230,000 | $179 | 27 |
| 3923 Bonner Rd | 0.66mi | 4/2.0 (+1) | 1,280 (+11%) | 22mo | $67,100 | $52 | 26 |
Match score weights: distance 35% · size 25% · config 20% · recency 20%. Top-matched comps best support the ARV.
Projected returns pro-forma
-3.0% appreciation · 6.1% rent growth · sell at horizon
- IRR
- 17.0%
- Equity multiple
- 1.71×
- Total profit
- $18,399
- Equity at exit
- $13,717
- IRR
- 27.9%
- Equity multiple
- 3.89×
- Total profit
- $74,448
- Equity at exit
- $7,954
Cash invested: $25,760 (down + closing). Projections, not guarantees.
Landlord ↔ Tenant lean methodology
- Overall (CITY)
- 12 Strongly Tenant-Friendly
- State Maryland
- 27 Tenant-Leaning · D+14
- County
- — inherits STATE
- City Baltimore
- 12 Strongly Tenant-Friendly · D+58
ZIP-level market 21216
- Rents YoY
- 6.1%
- Active inventory
- 252
- Price-to-rent
- 5.0×
Monthly cashflow live
- Estimated rent
- $1,536 high interval (Pro) →
- Mortgage (P&I)
- −$482
- Tax from tax record
- −$249 /mo · $2,990/yr
- Insurance
- −$38
- HOA
- −$0
- Vacancy / Maint / Mgmt
- −$323
- Net cashflow
- $444
Break-even live
Sensitivity live
| Price | -10% $496 | -5% $470 | +0% $444 | +5% $418 | +10% $392 |
|---|---|---|---|---|---|
| Rent | -10% $322 | -5% $383 | +0% $444 | +5% $504 | +10% $565 |
| Rate | -1.0pp $490 | -0.5pp $467 | base $444 | +0.5pp $420 | +1.0pp $396 |
UW: 25.0% down · 7.5% · 30yr · 1.5% tax · 5.0% vac · 8.0% maint · 8.0% mgmt
Financing live
Cash to close
- Down payment
- $23,000
- Closing costs
- $2,760
- Reserves months
- —
- Total cash needed
- —
Loan-product check · same deal, 3 products live
Conventional
25% down · 7.5% · 30yr
- Down + closing
- —
- Monthly P&I
- —
- Monthly cashflow
- —
- DSCR
- —
- Eligible?
- —
Personal DTI + credit; lowest rate.
DSCR
20% down · 8.5% · 30yr
- Down + closing
- —
- Monthly P&I
- —
- Monthly cashflow
- —
- DSCR
- —
- Eligible?
- —
No personal income docs; deal must DSCR.
Hard money
10% down · 12.0% · 12mo
- Down + closing
- —
- Monthly P&I
- —
- Monthly cashflow
- —
- DSCR
- —
- Eligible?
- —
Short-term bridge; refi at stabilization.
Rent comps 40 comps
| Address | Beds | Baths | Sqft | Rent | $/sqft | DOM | Units | Dist |
|---|---|---|---|---|---|---|---|---|
| 2220 Lyndhurst Ave Unit 1 Baltimore, MD | 2.0 | 1.0 | 900 | $1,175 | $1.31 | 25d | 1 | 0.08mi |
| 2103 Chelsea Ter Unit 2 Baltimore, MD | 3.0 | 1.5 | 1500 | $2,100 | $1.40 | 16d | 1 | 0.27mi |
| 2103 Chelsea Ter Unit 1 Baltimore, MD | 2.0 | 2.0 | 1500 | $2,200 | $1.47 | 16d | 1 | 0.27mi |
| 3514 Clifton Ave Unit 21 Baltimore, MD | 2.0 | 1.0 | 925 | $1,150 | $1.24 | 45d | 1 | 0.41mi |
| 3514 Clifton Ave Baltimore, MD | 2.0 | 1.0 | 925 | $1,199 | $1.30 | 45d | 1 | 0.41mi |
| 3709 Nortonia Rd #2 Baltimore, MD | 2.0 | 1.0 | 1289 | $1,450 | $1.12 | 19d | 1 | 0.41mi |
| 4515 Fairfax Rd Baltimore, MD | 2.0 | 1.0 | 700 | $1,250 | $1.79 | 25d | 1 | 0.50mi |
| 2700 Roslyn Ave Unit 8 Baltimore, MD | 2.0 | 1.0 | 800 | $1,500 | $1.88 | 5d | 1 | 0.51mi |
| 2700 Roslyn Ave Unit 5 Baltimore, MD | 2.0 | 1.0 | 800 | $1,500 | $1.88 | 19d | 1 | 0.51mi |
| 3407 Elgin Ave Unit 5 Baltimore, MD | 2.0 | 1.0 | 800 | $1,250 | $1.56 | 45d | 1 | 0.51mi |
| 2601 Garrison Blvd Baltimore, MD | 2.0 | 1.0 | 750 | $1,175 | $1.57 | 23d | 2 | 0.55mi |
| 3416 Alto Rd Unit 21 Baltimore, MD | 2.0 | 1.0 | 700 | $1,175 | $1.68 | 45d | 1 | 0.56mi |
| 3403 Carlisle Ave Apt 1 Baltimore, MD | 2.0 | 1.0 | 1100 | $1,600 | $1.45 | 12d | 1 | 0.68mi |
| 2905 Garrison Blvd Unit 21 Baltimore, MD | 2.0 | 1.0 | 800 | $1,175 | $1.47 | 45d | 1 | 0.68mi |
| 4309 Norfolk Ave Unit 1st Floor Baltimore, MD | 2.0 | 1.0 | 1470 | $1,500 | $1.02 | 12d | 1 | 0.70mi |
| 4738 Wakefield Rd Baltimore, MD | 2.0 | 1.0 | 884 | $1,200 | $1.36 | 25d | 1 | 0.72mi |
| 4103 Stokes Dr Apt 1 Baltimore, MD | 2.0 | 1.0 | 725 | $1,095 | $1.51 | 45d | 1 | 0.76mi |
| 3935 Stokes Dr #1 Baltimore, MD | 2.0 | 1.0 | 1150 | $1,400 | $1.22 | 45d | 1 | 0.83mi |
| 1307 Wildwood Pkwy Baltimore, MD | 2.0 | 1.0 | 725 | $1,295 | $1.79 | 45d | 1 | 0.83mi |
| 3017 Poplar Ter Baltimore, MD | 2.0 | 1.0 | 880 | $1,349 | $1.53 | 25d | 1 | 0.85mi |
| 3028 Hanlon Ave Baltimore, MD | 3.0 | 2.0 | 1200 | $1,711 | $1.43 | 25d | 1 | 0.85mi |
| 2742 N Rosedale St Baltimore, MD | 3.0 | 1.0 | 1024 | $1,350 | $1.32 | 45d | 2 | 0.86mi |
| 4103 Mountwood Rd Baltimore, MD | 3.0 | 2.0 | 1030 | $1,700 | $1.65 | 45d | 1 | 0.87mi |
| 3309 Brighton St Baltimore, MD | 3.0 | 1.0 | 1134 | $1,700 | $1.50 | 45d | 1 | 0.88mi |
| 1216 N Augusta Ave Baltimore, MD | 3.0 | 1.0 | 1024 | $1,550 | $1.51 | 25d | 1 | 0.88mi |
| 3001 Carlisle Ave Baltimore, MD | 3.0 | 1.0 | 1024 | $1,300 | $1.27 | 45d | 1 | 0.91mi |
| 2738 N Longwood St Baltimore, MD | 3.0 | 1.0 | 1024 | $1,399 | $1.37 | 45d | 1 | 0.92mi |
| 5006 Windsor Mill Rd Baltimore, MD | 1.0–3.0 | 1.0–2.0 | 776 | $1,899 | $2.45 | 3d | 18 | 0.93mi |
| 3127 Baker St Baltimore, MD | 3.0 | 1.0 | 1000 | $1,300 | $1.30 | 45d | 1 | 0.95mi |
| 3003 W North Ave Baltimore, MD | 1.0–2.0 | 1.0 | 841 | $935 | $1.11 | 3d | 3 | 0.97mi |
| 3915 Liberty Heights Ave Gwynn Oak, MD | 1.0–2.0 | 1.0–2.0 | 680 | $1,345 | $1.98 | 13d | 5 | 1.01mi |
| 917 Kevin Rd Baltimore, MD | 3.0 | 2.0 | 1151 | $1,795 | $1.56 | 3d | 1 | 1.09mi |
| 3238 Westmont Ave Baltimore, MD | 3.0 | 1.0 | 1280 | $1,600 | $1.25 | 45d | 1 | 1.11mi |
| 3003 Presstman St Unit 1 Baltimore, MD | 2.0 | 2.0 | 1450 | $1,400 | $0.97 | 45d | 1 | 1.11mi |
| 3003 Presstman St Unit 2 Baltimore, MD | 2.0 | 1.0 | 1450 | $1,300 | $0.90 | 25d | 1 | 1.11mi |
| 3600 Garrison Blvd Apt T1 Baltimore, MD | 2.0 | 1.0 | 800 | $1,125 | $1.41 | 4d | 1 | 1.15mi |
| 3600 Garrison Blvd Unit T2 Baltimore, MD | 2.0 | 1.0 | 750 | $1,149 | $1.53 | 25d | 1 | 1.15mi |
| 5136 Oaklawn Rd Gwynn Oak, MD | 1.0–3.0 | 1.0 | 896 | $1,710 | $1.91 | 3d | 22 | 1.17mi |
| 3508 Grantley Rd Baltimore, MD | 2.0 | 1.0 | 1250 | $1,350 | $1.08 | 25d | 1 | 1.18mi |
| 798 N Grantley St Baltimore, MD | 3.0 | 2.0 | 1360 | $2,295 | $1.69 | 25d | 1 | 1.18mi |
Listing history 17 events
-
2026-05-07status Pending 377-char remark
-
2026-04-30$92,000 Active 377-char remark
-
2025-11-20historical
-
2025-11-12status Active
-
2025-11-04price $92,150
-
2025-11-04status Active
-
2025-11-03historical
-
2025-10-24historical
-
2025-10-05$97,000 Active
-
2024-03-10historical
-
2024-01-30historical Active Under Contract
-
2024-01-26status Active
-
2024-01-12status Pending
-
2024-01-05status Active
-
2023-12-21historical Active Under Contract
-
2023-12-11$135,000 Active
-
2023-11-30historical
ⓘ Source: listings_history table (triggers on properties + properties_extension) + one-shot
backfill from property_details.listing_events for pre-trigger history.
Tax reassessment forecast MD · Partial reset (capped growth)
- Current annual tax
- $2,990 · $249/mo
- Projected year-2 tax
- $2,990 · $249/mo
- Expected delta
- $0/yr ($0/mo · 0.0%)
ⓘ Screening estimate from a state-policy table — verify with the county assessor before closing.
Climate risk First Street
- Flood 1/10 Low FEMA zone X (unshaded) · 0% chance over 30 yrs
- Wildfire 1/10 Low
- Heat 6/10 Major 7 d/yr ≥103°F today · 15 d/yr by 30 yrs out
- Wind 5/10 Major 23% chance of damaging wind over 30 yrs
- Air quality 3/10 Moderate 3 unhealthy d/yr today · 4 by 30 yrs out
Nearby sold comps map
Loading sold comps map…
Walkable amenities ~0.75 mi
Loading nearby amenities…
Taxation est. · year 1
- Rental income
- $18,436
- − Mortgage interest
- −$5,153
- − Property taxes
- −$2,990
- − Insurance
- −$460
- − Repairs & maintenance
- −$1,475
- − Management
- −$1,475
- − Depreciation
- −$2,676
- Taxable income
- $4,206
- Est. tax owed @ 24.0%
- −$1,009
- After-tax cash flow
- $4,315/yr
For passive investors: Depreciation is non-cash, so a rental often shows a tax loss while cash-flowing — sheltering income. Rental losses are passive: they offset passive income freely, and up to $25,000/yr can offset ordinary (W-2) income if you actively participate and your MAGI is under $100k (phasing out to $0 by $150k); unused losses carry forward. On sale, claimed depreciation is recaptured at up to 25%, and gains may owe capital-gains tax (a 1031 exchange can defer both). Figures are a year-1 estimate at your 24.0% rate — not tax advice; consult a CPA.
Schools (NCES district)
- District
- Baltimore City Public Schools
- NCES district ID
- 2400090
- Math proficiency
- 7% ▼ -9.00%
- Reading proficiency
- 16% ▼ -5.00%
- Median HH income
- $42,108
- Composite
- 10.08/100
- National rank
- #9805
- State rank
- #24 of 24 in MD
Livability — Baltimore
- Score
- 76/100
- State rank
- #90
- US rank
- #3396
Category grades
Schools grade is shown separately in the Schools card above.
Census & demographics
- Census place
- Baltimore, MD
- County
- Baltimore City · 558,601 people
- City population
- 588,727
- Metro
- Baltimore-Columbia-Towson, MD
- Population (ZIP)
- 29,426
- Household income
- $42,031
- Rent vs Own
- Severe rent burden
- 2264.0
Population outlook (Baltimore County) Hauer SSP2
- Today (2025)
- 624,249 people
- By 2030
- 621,541 · -0.4%
- By 2040
- 609,756 · -2.3%
- By 2050
- 597,249 · -4.3%
- By 2075
- 552,236 · -11.5%
- By 2100
- 513,934 · -17.7%
Race, ethnicity, and origin ACS 2023
- Neighborhood character
- Predominantly Black (91%)
- Race & ethnicity
- Black 91% Hispanic / Latino 4% Two or more races 3% White 2%
- Foreign-born
- 3% · Canada
- Languages at home
- 96% English-only · Spanish 3% French/Haitian/Cajun 1%
Political lean MEDSL · Baltimore
- 2024 margin
- Solid D (+73.0) · D 85.2% · R 12.2% · Other 2.6%
- 2008→2024 swing
- -2.5pp toward R · 2008: 75.5pp · 2024: 73.0pp
- All cycles
- 2024: D+73.0 2020: D+76.6 2016: D+74.6 2012: D+76.4 2008: D+75.5
Not yet ingested
- Civics
- —
Market trends
- HPI YoY
- ▼ -107.42%
- Current HPI
- 164.3933
- Rent YoY
- ▲ 6.10%
- Metro
- Baltimore-Columbia-Towson, MD
- State GDP YoY
- ▲ 2.97%
- F500 in state
- 12
Industry mix (Fortune 500 HQ in MD)
| Industry | F500 HQs | Revenue |
|---|---|---|
| Aerospace / Defense | 1 | $71B |
|
||
| Utilities | 1 | $25B |
|
||
| Hotels | 1 | $24B |
|
||
| Consumer Goods | 1 | $7B |
|
||
| Real Estate | 1 | $6B |
|
||
| Chemicals | 1 | $2B |
|
||
Price history
-31.9% since first listed18 events — show timeline
- 2026-05-07 Pending — BRIGHT MLS
- 2026-05-07 Listing Removed — BRIGHT MLS
- 2026-04-30 Listed $92,000 BRIGHT MLS
- 2025-11-20 Listing Removed — BRIGHT MLS
- 2025-11-12 Relisted — BRIGHT MLS
- 2025-11-04 Price Changed $92,150 BRIGHT MLS
- 2025-11-04 Relisted — BRIGHT MLS
- 2025-11-03 Listing Removed — BRIGHT MLS
- 2025-10-24 Listing Removed — BRIGHT MLS
- 2025-10-05 Listed $97,000 BRIGHT MLS
- 2024-03-10 Listing Removed — BRIGHT MLS
- 2024-01-30 Contingent — BRIGHT MLS
- 2024-01-26 Relisted — BRIGHT MLS
- 2024-01-12 Pending — BRIGHT MLS
- 2024-01-05 Relisted — BRIGHT MLS
- 2023-12-21 Contingent — BRIGHT MLS
- 2023-12-11 Listed $135,000 BRIGHT MLS
- 2023-11-30 Coming Soon — BRIGHT MLS
Property tax history
+4.2%/yrLatest (2025): $2,990 · +6.7% YoY. Source: county tax records.
Cash-flow waterfall
monthlySold comps — $/sqft
last 12 mo · ≤1 miLoading sold comps…