 Multi-family
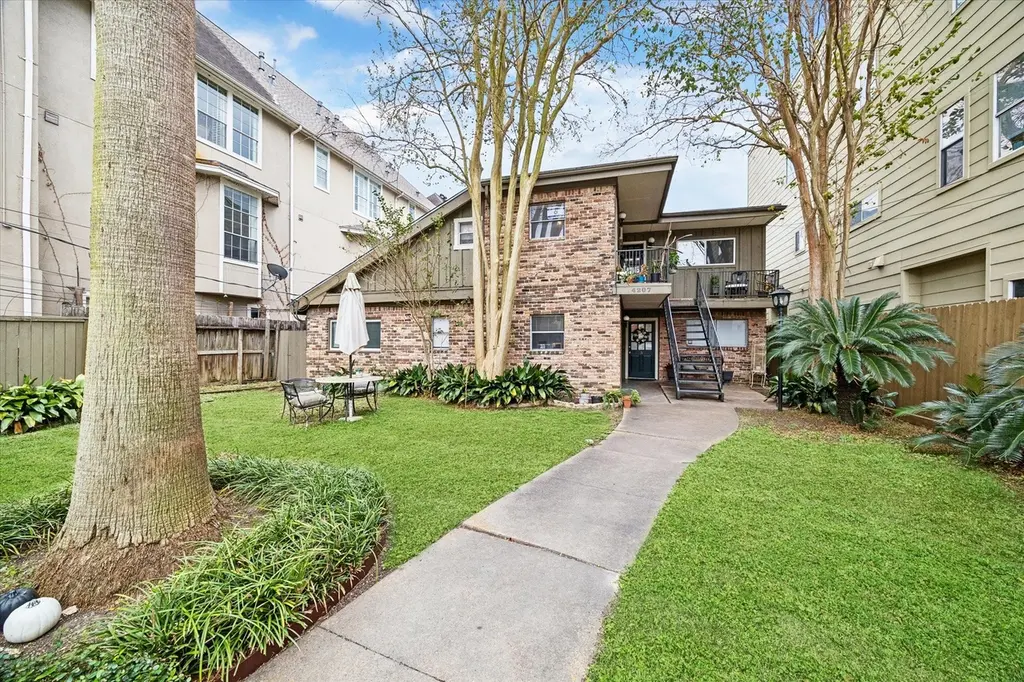
4207 Drake St · Houston, TX
Flood risk 1/10 · Minimal
- FEMA flood zone
- X (unshaded)
- Chance of flooding over 30 yrs
- 0.0%
- Est. flood insurance / yr
- $507 – $1,088
Fire risk 1/10 · Minimal
- Est. fire insurance / yr
- $1,222 – $2,270
Heat risk 9/10 · Severe
- Hot days now (above 109°F)
- 7 days/yr
- Hot days in 30 yrs
- 25 days/yr
Wind risk 9/10 · Severe
- Chance of severe wind over 30 yrs
- 99.0%
Air-quality risk 2/10 · Minimal
- Unhealthy air days now
- 2 days/yr
- Unhealthy air days in 30 yrs
- 2 days/yr
Risk factors via First Street. Map © Google.
Why this score? — see what drove the C grade
The composite is a weighted blend of 9 inputs, each scored 0–100. Each bar is that input's sub-score; the figure is the points it added to the 100-point composite (weight × sub-score).
- Cash flow +23.3/30.0
- DSCR +7.5/10.0
- ARV discount +7.4/15.0
- 1% rule +6.1/10.0
- Rent growth +4.0/5.0
- Condition / age +3.8/5.0
- Livability +3.7/5.0
- Schools +2.7/10.0
- Appreciation +0.0/10.0
$799,000
🖨 Deal sheet 📄 Offer letter ✓ Due diligence
Multi-family units
County records classify this as Multi-Family (5+ Unit). Listing-text estimate: 1 unit. estimate disagrees with records
5+ unit building — per-unit beds/baths from public records are typically unavailable; the breakdown below (if shown) is an estimate from the listing text.
Listing remarks MLS
This Six-Unit Apartment Complex In West University Place Offers A Smart Opportunity For Investors Looking For A Strong Inner-Loop Location W/Lasting Demand. The unit mix includes 3- 2-bedroom/1-bath units, 2- 1-bedroom/1-bath units & 1- studio w/a full kitchen & bath, making it easy to attract a wide range of tenants. Each unit has its own personality, W/neutral updated finishes & practical kitchens & baths designed for comfortable living & easy upkeep. Select units offer extras such as skylights, built-in storage, extended vanities & in-unit laundry, helping support tenant satisfaction & retention. The property delivers charming curb appeal w/classic brick construction, mature trees & a welcoming shared courtyard. Located just blocks from Loop 610 & US-59/69, w/quick access to the Galleria, Texas Medical Center, Rice University, Downtown Houston, dining, shopping & public transportation. prime location, unit diversity & tenant-friendly features make this a solid long-term investment.
Key facts
- 5,000 sq ft lot
- Built 1966
- Listed 43 days
Neighborhood map
What this means for you Summary
Snapshot
- This is a 2-bed/1.0-bath multifamily listed at $799k. Condition is rated good.
Deal economics
- At list price, monthly cash flow is $1k ($17k/yr) — positive.
- The deal already cash-flows at list — no discount required.
- Meets the 1% rule at list price ($9k rent vs $799k).
- Recommended offer: $775k (3.0% below list) — sets the bar for market timing.
- Cap rate 8.5% vs local median 3.2% in Houston — top-decile yield for the area; either an underpriced asset or a hidden risk that comps aren't pricing in. Stress-test before assuming the spread holds.
Location & tenants
- Location reads 74/100 on livability (#184 in TX, #4,771 nationally) — a middle-class / working-renter tenant base. Strengths: amenities A+, cost of living A+, housing A+; Watch: schools D, crime F.
- Houston ISD (urban): math 27% / reading 35% proficiency, ranked #593 of 826 in TX (top 72%) — families likely to look elsewhere, expect single-tenant / working-renter base with shorter leases; 71% free/reduced lunch — lower-income household profile, screen leases tightly.
- Market conditions: Rents rising fast (+6.0%/yr); 139 active listings in the ZIP; 3 comparable units currently listed for rent nearby; rentals at typical pace (median 25d on market — plan ~3-4 weeks tenant-placement turnaround); high-income renter base; 29,883 units permitted in Harris County in 2024 (8,621 in 5+ unit buildings).
- At $8,833/mo this rent would consume 46% of the median local household income ($229k/yr) (locally 753% of renters already pay >50% of income on rent) — very limited rent-growth headroom before tenants either downsize or default.
Forward outlook
- Local home prices are declining (-3.0%/yr); year-one equity from $6k of loan paydown is wiped out by about $24k of value loss. Plan a longer hold.
- Harris County population projected at +47% by 2050 — long-run rental-demand tailwind backs the buy-and-hold thesis.
- At projected returns (-3.0% appreciation + 6.0% rent growth), your $224k cash investment doubles in ~9 years — after that, you're playing with house money.
Negotiation context
- It's been on market 43 days — a 3% lower offer ($775k) is reasonable based on typical stale-listing flexibility.
- 4 sale attempts with the ask held roughly flat each time — persistent listings suggest the price (not the market) is what's stuck; bring a comps-based counter.
Risks & watch-outs
- Climate carrying-cost: severe wind risk, 99% chance of damaging wind over 30y; extreme-heat days projected 7→25/yr by 2055 (HVAC capex compounding) — expect insurance premiums to compound above CPI over the hold.
Questions for the listing agent
- It's been on market 43 days. Have you received any prior offers? Is the seller open to a 3% concession, seller financing, or rate buy-down credit?
- Built in 1966 — when were the roof, HVAC, electrical panel, plumbing, and water heater last replaced?
- Is there a deadline driving the sale (1031 exchange, divorce, estate, relocation)? That informs how much negotiation room exists.
- Schools are D-rated, which usually means shorter tenancies and higher turnover. Who's the typical renter profile here, and what's been the actual vacancy rate?
- Crime grade is F in this area — have there been break-ins, vandalism, or insurance claims at this property in the last 3 years? What carrier currently insures it and at what premium?
- What's the average days-on-market for RENTAL listings here right now (not sales)? A rising rental-DOM trend means longer vacancies and softer asking-rent achievability than the comps imply.
- What's the recent tenant-quality profile in this submarket — average credit score on applications, eviction rate, late-payment / NSF rate, and stable-employment percentage? A property-management company in the area should have these aggregated.
- How much new apartment / multifamily construction is in the pipeline within 1–3 miles? Heavy new supply (>2% of stock underway) typically softens rents 12–24 months out; light construction supports rent growth.
Investment metrics
- 1% rule
- 1.11% ✓
- Cap rate
- 8.48%
- Cash-on-cash
- 7.81%
- DSCR
- 1.35
- GRM
- 7.5
CMA / ARV
- ARV (median comp)
- $797,356
- List price
- $799,000
- Delta
- 0.21%
- Verdict
- FAIR
- Comps
- 2 within 1.0 mi
Projected returns pro-forma
-3.0% appreciation · 5.95% rent growth · sell at horizon
- IRR
- -1.1%
- Equity multiple
- 0.96×
- Total profit
- $-9,592
- Equity at exit
- $119,133
- IRR
- 11.5%
- Equity multiple
- 2.02×
- Total profit
- $229,306
- Equity at exit
- $69,083
Cash invested: $223,720 (down + closing). Projections, not guarantees.
Landlord ↔ Tenant lean methodology
- Overall (STATE)
- 87 Strongly Landlord-Friendly
- State Texas
- 87 Strongly Landlord-Friendly · R+5
- County
- — inherits STATE
- City
- — inherits STATE
ZIP-level market 77005
- Rents YoY
- 6.0%
- Active inventory
- 139
- Price-to-rent
- 43.1×
Monthly cashflow live
- Estimated rent
- $8,833 high interval (Pro) →
- Mortgage (P&I)
- −$4,190
- Tax est. 1.5%
- −$999 /mo · $11,985/yr
- Insurance
- −$333
- HOA
- −$0
- Vacancy / Maint / Mgmt
- −$1,855
- Net cashflow
- $1,456
Break-even live
6-unit breakdown (identical units grouped — click to expand)
| Units | Beds | Baths | Est. rent |
|---|---|---|---|
| 3× units | 2 | 1 | $4,638 |
| #1 | 2 | 1 | $1,546 |
| #2 | 2 | 1 | $1,546 |
| #3 | 2 | 1 | $1,546 |
| 2× units | 1 | 1 | $2,766 |
| #4 | 1 | 1 | $1,383 |
| #5 | 1 | 1 | $1,383 |
| 1× unit | 0 | 1 | $1,428 |
| Total (6 units) | $8,833 | ||
UW: 25.0% down · 7.5% · 30yr · 1.5% tax · 5.0% vac · 8.0% maint · 8.0% mgmt
Financing live
Cash to close
- Down payment
- $199,750
- Closing costs
- $23,970
- Reserves months
- —
- Total cash needed
- —
Loan-product check · same deal, 3 products live
Conventional
25% down · 7.5% · 30yr
- Down + closing
- —
- Monthly P&I
- —
- Monthly cashflow
- —
- DSCR
- —
- Eligible?
- —
Personal DTI + credit; lowest rate.
DSCR
20% down · 8.5% · 30yr
- Down + closing
- —
- Monthly P&I
- —
- Monthly cashflow
- —
- DSCR
- —
- Eligible?
- —
No personal income docs; deal must DSCR.
Hard money
10% down · 12.0% · 12mo
- Down + closing
- —
- Monthly P&I
- —
- Monthly cashflow
- —
- DSCR
- —
- Eligible?
- —
Short-term bridge; refi at stabilization.
Rent comps 3 comps
| Address | Beds | Baths | Sqft | Rent | $/sqft | DOM | Units | Dist |
|---|---|---|---|---|---|---|---|---|
| 2929 Weslayan St Houston, TX | 3.0 | 1.0–3.5 | 2411 | $9,812 | $4.07 | 24d | 23 | 0.97mi |
| 2929 Weslayan St Houston, TX | 3.0 | 1.0–3.5 | 2411 | $11,502 | $4.77 | 3d | 27 | 0.97mi |
| 3319 Bingham Manor Ln Houston, TX | 3.0 | 4.0 | 2866 | $2,900 | $1.01 | 43d | 1 | 1.46mi |
Listing history 22 events
-
2026-06-18days on market $799,000 Active 43 DOM
-
2026-06-17days on market $799,000 Active 42 DOM
-
2026-06-16days on market $799,000 Active 41 DOM
-
2026-06-15days on market $799,000 Active 40 DOM
-
2026-06-13days on market $799,000 Active 38 DOM
-
2026-06-10days on market $799,000 Active 34 DOM
-
2026-06-08days on market $799,000 Active 33 DOM
-
2026-06-07days on market $799,000 Active 32 DOM
-
2026-06-04days on market $799,000 Active 29 DOM
-
2026-06-01days on market $799,000 Active 26 DOM
-
2026-05-31days on market $799,000 Active 25 DOM
-
2026-05-06$799,000 Active 1043-char remark
Show marketing remark (1043 chars)
This Six-Unit Apartment Complex In West University Place Offers A Smart Opportunity For Investors Looking For A Strong Inner-Loop Location W/Lasting Demand. The unit mix includes 3- 2-bedroom/1-bath units, 2- 1-bedroom/1-bath units & 1- studio w/a full kitchen & bath, making it easy to attract a wide range of tenants. Each unit has its own personality, W/neutral updated finishes & practical kitchens & baths designed for comfortable living & easy upkeep. Select units offer extras such as skylights, built-in storage, extended vanities & in-unit laundry, helping support tenant satisfaction & retention. The property delivers charming curb appeal w/classic brick construction, mature trees & a welcoming shared courtyard. Located just blocks from Loop 610 & US-59/69, w/quick access to the Galleria, Texas Medical Center, Rice University, Downtown Houston, dining, shopping & public transportation. prime location, unit diversity & tenant-friendly features make this a solid long-term investment.
-
2026-05-06historical
Show marketing remark (1043 chars)
This Six-Unit Apartment Complex In West University Place Offers A Smart Opportunity For Investors Looking For A Strong Inner-Loop Location W/Lasting Demand. The unit mix includes 3- 2-bedroom/1-bath units, 2- 1-bedroom/1-bath units & 1- studio w/a full kitchen & bath, making it easy to attract a wide range of tenants. Each unit has its own personality, W/neutral updated finishes & practical kitchens & baths designed for comfortable living & easy upkeep. Select units offer extras such as skylights, built-in storage, extended vanities & in-unit laundry, helping support tenant satisfaction & retention. The property delivers charming curb appeal w/classic brick construction, mature trees & a welcoming shared courtyard. Located just blocks from Loop 610 & US-59/69, w/quick access to the Galleria, Texas Medical Center, Rice University, Downtown Houston, dining, shopping & public transportation. prime location, unit diversity & tenant-friendly features make this a solid long-term investment.
-
2026-04-13status Active
-
2026-03-11status Pending
-
2026-02-23status Pending
-
2026-02-05price $849,000
-
2026-01-16price $899,000
-
2026-01-06$949,000 Active
-
2025-11-10historical
-
2025-09-22price $949,000
-
2025-08-06$975,000 Active
ⓘ Source: listings_history table (triggers on properties + properties_extension) + one-shot
backfill from property_details.listing_events for pre-trigger history.
Climate risk First Street
- Flood 1/10 Low FEMA zone X (unshaded) · 0% chance over 30 yrs
- Wildfire 1/10 Low
- Heat 9/10 Extreme 7 d/yr ≥109°F today · 25 d/yr by 30 yrs out
- Wind 9/10 Extreme 99% chance of damaging wind over 30 yrs
- Air quality 2/10 Low 2 unhealthy d/yr today · 2 by 30 yrs out
Nearby sold comps map
Loading sold comps map…
Walkable amenities ~0.75 mi
Loading nearby amenities…
Taxation est. · year 1
- Rental income
- $105,996
- − Mortgage interest
- −$44,756
- − Property taxes
- −$11,985
- − Insurance
- −$3,995
- − Repairs & maintenance
- −$8,480
- − Management
- −$8,480
- − Depreciation
- −$23,244
- Taxable income
- $5,057
- Est. tax owed @ 24.0%
- −$1,214
- After-tax cash flow
- $16,263/yr
For passive investors: Depreciation is non-cash, so a rental often shows a tax loss while cash-flowing — sheltering income. Rental losses are passive: they offset passive income freely, and up to $25,000/yr can offset ordinary (W-2) income if you actively participate and your MAGI is under $100k (phasing out to $0 by $150k); unused losses carry forward. On sale, claimed depreciation is recaptured at up to 25%, and gains may owe capital-gains tax (a 1031 exchange can defer both). Figures are a year-1 estimate at your 24.0% rate — not tax advice; consult a CPA.
Condition & rehab AI · 14 photos
This multi-family property is in good condition with a good curb appeal and well-maintained interiors. It has the potential to be a strong investment opportunity with minor cosmetic improvements.
Value-add opportunities
- Both Paint the exterior walls — Painting the exterior walls can enhance the curb appeal and increase the property's value.
- Both Replace worn-out carpet — Replacing the carpet can improve the living space and make it more attractive to potential buyers or renters.
Renovation cost estimate screening
Value-add ROI direction
- Both Paint the exterior walls — Painting the exterior walls can enhance the curb appeal and increase the property's value. ↑
- Both Replace worn-out carpet — Replacing the carpet can improve the living space and make it more attractive to potential buyers or renters. ↑
ⓘ Cost ranges are severity-bucket heuristics (US national rule-of-thumb). Get contractor quotes + a written scope before underwriting a rehab budget.
Schools (NCES district)
- District
- Houston ISD
- NCES district ID
- 4823640
- Math proficiency
- 27% ▼ -18.00%
- Reading proficiency
- 35% ▼ -6.00%
- Median HH income
- $46,054
- Composite
- 26.63/100
- National rank
- #7173
- State rank
- #593 of 826 in TX
Livability — Houston
- Score
- 74/100
- State rank
- #184
- US rank
- #4771
Category grades
Schools grade is shown separately in the Schools card above.
Census & demographics
- Census place
- Houston, TX
- County
- Harris County · 4,702,590 people
- City population
- 3,226,434
- Metro
- Houston-The Woodlands-Sugar Land, TX
- Population (ZIP)
- 28,874
- Household income
- $229,267
- Rent vs Own
- Severe rent burden
- 753.0
Population outlook (Harris County) Hauer SSP2
- Today (2025)
- 5,571,493 people
- By 2030
- 6,089,821 · +9.3%
- By 2040
- 7,142,806 · +28.2%
- By 2050
- 8,185,864 · +46.9%
- By 2075
- 10,574,329 · +89.8%
- By 2100
- 12,109,958 · +117.4%
Race, ethnicity, and origin ACS 2023
- Neighborhood character
- Predominantly White (68%)
- Race & ethnicity
- White 68% Asian 14% Two or more races 11% Hispanic / Latino 9% Black 3%
- Hispanic origin (detail)
- Mexican 5%
- Common ancestry
- Italian 3% Slovak 3% Romanian 3%
- Foreign-born
- 18% · Canada, China, South Korea
- Languages at home
- 75% English-only · Spanish 8% Chinese 6% Other Indo-European 4%
Political lean MEDSL · Harris
- 2024 margin
- Lean D (+5.5) · D 52.0% · R 46.4% · Other 1.6%
- 2008→2024 swing
- +3.9pp toward D · 2008: 1.6pp · 2024: 5.5pp
- All cycles
- 2024: D+5.5 2020: D+13.3 2016: D+12.4 2012: D+0.1 2008: D+1.6
Not yet ingested
- Civics
- —
Market trends
- HPI YoY
- ▼ -630.44%
- Current HPI
- 247.3475
- Rent YoY
- ▲ 5.95%
- Metro
- Houston-The Woodlands-Sugar Land, TX
- State GDP YoY
- ▲ 3.95%
- F500 in state
- 110
Industry mix (Fortune 500 HQ in TX)
| Industry | F500 HQs | Revenue |
|---|---|---|
| Energy | 16 | $1,198B |
|
||
| Technology | 5 | $198B |
|
||
| Engineering / Construction | 4 | $72B |
|
||
| Energy Services | 3 | $60B |
|
||
| Utilities | 3 | $41B |
|
||
| Healthcare | 2 | $330B |
|
||
Price history
-18.1% since first listed11 events — show timeline
- 2026-05-06 Listing Removed — HARMLS
- 2026-05-06 Listed $799,000 HARMLS
- 2026-04-13 Relisted — HARMLS
- 2026-03-11 Pending — HARMLS
- 2026-02-23 Pending — HARMLS
- 2026-02-05 Price Changed $849,000 HARMLS
- 2026-01-16 Price Changed $899,000 HARMLS
- 2026-01-06 Listed $949,000 HARMLS
- 2025-11-10 Listing Removed — HARMLS
- 2025-09-22 Price Changed $949,000 HARMLS
- 2025-08-06 Listed $975,000 HARMLS
Cash-flow waterfall
monthlySold comps — $/sqft
last 12 mo · ≤1 miLoading sold comps…