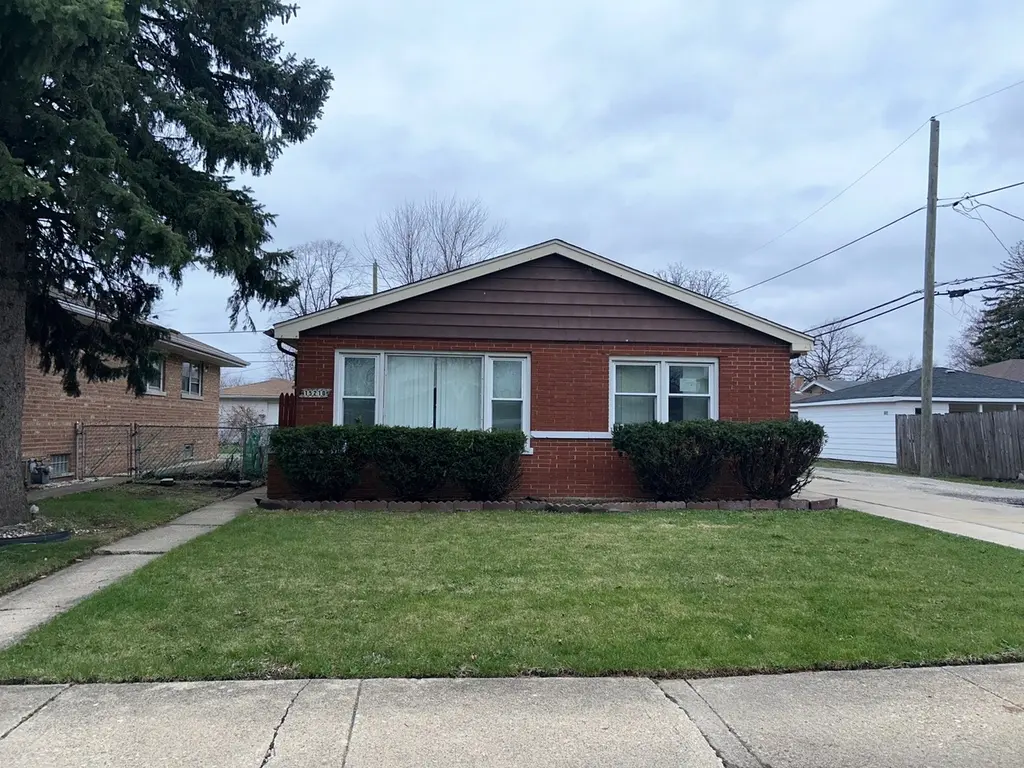
15210 Evers St · Dolton, IL
Flood risk 1/10 · Minimal
- FEMA flood zone
- X (unshaded)
- Chance of flooding over 30 yrs
- 0.0%
- Est. flood insurance / yr
- $507 – $1,088
Fire risk 1/10 · Minimal
- Est. fire insurance / yr
- $804 – $1,492
Heat risk 3/10 · Minor
- Hot days now (above 101°F)
- 7 days/yr
- Hot days in 30 yrs
- 15 days/yr
Wind risk 2/10 · Minimal
- Chance of severe wind over 30 yrs
- —
Air-quality risk 4/10 · Minor
- Unhealthy air days now
- 4 days/yr
- Unhealthy air days in 30 yrs
- 5 days/yr
Risk factors via First Street. Map © Google.
Why this score? — see what drove the B+ grade
The composite is a weighted blend of 9 inputs, each scored 0–100. Each bar is that input's sub-score; the figure is the points it added to the 100-point composite (weight × sub-score).
- Cash flow +30.0/30.0
- ARV discount +15.0/15.0
- 1% rule +10.0/10.0
- DSCR +10.0/10.0
- Rent growth +4.9/5.0
- Livability +3.7/5.0
- Condition / age +2.5/5.0
- Schools +0.7/10.0
- Appreciation +0.0/10.0
$120,000
🖨 Deal sheet (PDF) 📄 Offer letter ✓ Due diligence
Listing remarks
Exciting opportunity! This brick and frame split level offers 3 bedrooms, 1 bath, and a 2-car detached garage! This property is waiting for the right owner to unlock its full potential and turn it into a stunning home. Conveniently located near shopping and transportation, this is ideal for a first-time buyer ready to transform it into a fabulous living space or an investor looking to add to their rental portfolio.
Key facts
- 2 garage spots
- Built 1960
- Listed 77 days
Property features AI
Finance
- HOA & community: No master association fee required
Exterior
- Parking: Detached garage with 2 garage spaces (2 total parking spaces)
- Utilities: Public water; Public sewer
- Home design: Detached single-family home; Split-level layout; Built 61–70 years ago; Fee simple ownership; Built before 1978
- Construction: Brick and frame construction
- Exterior features: Lot under 0.25 acre
Interior
- Kitchen: Kitchen on main level (approx. 15 x 10)
- Bedrooms: 3 bedrooms (master and two additional bedrooms on the second floor; bedroom dimensions approx. 12 x 12, 12 x 12, and 12 x 11)
- Bathrooms: 1 full bathroom
- Heating & cooling: Natural gas forced-air heating
- Interior features: 6 total rooms
- Laundry & utility: Dedicated laundry room
Neighborhood map
What this means for you Summary
Snapshot
- This is a 3-bed/1.0-bath single-family listed at $120k.
Deal economics
- At list price, monthly cash flow is $1k ($14k/yr) — positive.
- The deal already cash-flows at list — no discount required.
- Meets the 1% rule at list price ($3k rent vs $120k).
- Recommended offer: $113k (6.0% below list) — sets the bar for market timing.
- Cap rate 17.8% vs local median 9.3% in Dolton — top-decile yield for the area; either an underpriced asset or a hidden risk that comps aren't pricing in. Stress-test before assuming the spread holds.
Location & tenants
- Location reads 74/100 on livability (#263 in IL, #4,883 nationally) — a middle-class / working-renter tenant base. Strengths: commute A+, cost of living A+, housing A+; Watch: employment C-, health & safety C-, schools F.
- Thornton Twp Hsd 205 (suburban): math 7% / reading 8% proficiency, ranked #594 of 620 in IL (top 96%) — low school quality limits family demand, transient renter base, plan for 1-2y turnover.
- Market conditions: Rents rising fast (+9.7%/yr); 130 active listings in the ZIP; 16 comparable units currently listed for rent nearby; rentals at typical pace (median 20d on market — plan ~3-4 weeks tenant-placement turnaround); 6,272 units permitted in Cook County in 2024 (4,658 in 5+ unit buildings).
- At $2,512/mo this rent would consume 52% of the median local household income ($58k/yr) (locally 919% of renters already pay >50% of income on rent) — very limited rent-growth headroom before tenants either downsize or default.
Forward outlook
- Local home prices are declining (-3.0%/yr); year-one equity from $830 of loan paydown is wiped out by about $4k of value loss. Plan a longer hold.
- At projected returns (-3.0% appreciation + 8.0% rent growth), your $34k cash investment doubles in ~3 years — after that, you're playing with house money.
Negotiation context
- It's been on market 77 days — a 6% lower offer ($113k) is reasonable based on typical stale-listing flexibility.
- 5 sale attempts since 6y ago; this cycle's ask has dropped $10k (8%) from the opening price — seller is motivated, your offer sets the floor, not the list.
- Current owner paid $86k; 40% above their basis — modest negotiation headroom, anchor on the comps not their cost.
Questions for the listing agent
- It's been on market 77 days. Have you received any prior offers? Is the seller open to a 6% concession, seller financing, or rate buy-down credit?
- Built in 1960 — when were the roof, HVAC, electrical panel, plumbing, and water heater last replaced?
- Why hasn't it sold? Are there any deal-killer items the seller is aware of (foundation, flood, title, zoning, code violations)?
- Is there a deadline driving the sale (1031 exchange, divorce, estate, relocation)? That informs how much negotiation room exists.
- Schools are F-rated, which usually means shorter tenancies and higher turnover. Who's the typical renter profile here, and what's been the actual vacancy rate?
- Crime grade is D in this area — have there been break-ins, vandalism, or insurance claims at this property in the last 3 years? What carrier currently insures it and at what premium?
- What's the average days-on-market for RENTAL listings here right now (not sales)? A rising rental-DOM trend means longer vacancies and softer asking-rent achievability than the comps imply.
- What's the recent tenant-quality profile in this submarket — average credit score on applications, eviction rate, late-payment / NSF rate, and stable-employment percentage? A property-management company in the area should have these aggregated.
- How much new for-sale + rental construction is in the pipeline within 1–3 miles? Heavy new supply typically softens prices + rents 12–24 months out; constrained supply supports both.
Investment metrics
- 1% rule
- 2.09% ✓
- Cap rate
- 17.84%
- Cash-on-cash
- 41.24%
- DSCR
- 2.84
- GRM
- 4.0
CMA / ARV
- ARV (on-the-fly)
- $185,790
- Comps found
- 12
Show comp detail 12 sales within ~0.75 mi
| Address | Dist | Beds/Ba | Sqft | Sold | Price | $/sf | Match |
|---|---|---|---|---|---|---|---|
| 619 E 152nd St | 0.06mi | 3/1.5 | 1,146 (+2%) | 1mo | $153,000 | $134 | 92 |
| 717 E 154th St | 0.38mi | 3/1.0 | 1,120 (-0%) | 2mo | $177,000 | $158 | 80 |
| 15310 Oak St | 0.14mi | 4/1.5 (+1) | 1,037 (-8%) | 1mo | $190,000 | $183 | 72 |
| 14813 Evers St | 0.50mi | 4/1.0 (+1) | 1,127 (+0%) | 3mo | $82,000 | $73 | 69 |
| 15061 Wabash Ave | 0.56mi | 3/1.5 | 1,116 (-1%) | 2mo | $150,000 | $134 | 69 |
| 15509 Rose Dr | 0.49mi | 2/1.0 (-1) | 1,100 (-2%) | 0mo | $135,000 | $123 | 68 |
| 14927 Cottage Grove Ave | 0.53mi | 3/2.0 | 1,095 (-3%) | 1mo | $250,000 | $228 | 66 |
| 15542 S Park Ave | 0.44mi | 4/2.0 (+1) | 1,066 (-5%) | 1mo | $193,900 | $182 | 60 |
| 14619 Martin Luther King Jr Dr | 0.75mi | 3/1.0 | 1,153 (+2%) | 2mo | $163,000 | $141 | 59 |
| 15503 Park Ln | 0.36mi | 3/2.0 | 968 (-14%) | 0mo | $170,000 | $176 | 56 |
| 15505 Drexel Ave | 0.64mi | 4/2.0 (+1) | 1,200 (+7%) | 2mo | $205,000 | $171 | 49 |
| 15444 State St | 0.70mi | 3/2.5 | 1,254 (+11%) | 2mo | $207,000 | $165 | 40 |
Match score weights: distance 35% · size 25% · config 20% · recency 20%. Top-matched comps best support the ARV.
Projected returns pro-forma
-3.0% appreciation · 8.0% rent growth · sell at horizon
- IRR
- 43.4%
- Equity multiple
- 3.01×
- Total profit
- $67,419
- Equity at exit
- $17,892
- IRR
- 51.7%
- Equity multiple
- 7.37×
- Total profit
- $213,985
- Equity at exit
- $10,375
Cash invested: $33,600 (down + closing). Projections, not guarantees.
Landlord ↔ Tenant lean methodology
- Overall (STATE)
- 43 Moderately Tenant-Leaning
- State Illinois
- 43 Moderately Tenant-Leaning · D+7
- County
- — inherits STATE
- City
- — inherits STATE
ZIP-level market 60419
- Home prices YoY
- -25.7%
- Rents YoY
- 9.7%
- Active inventory
- 130
- Price-to-rent
- 4.0×
Monthly cashflow live
- Estimated rent
- $2,512 high interval (Pro) →
- Mortgage (P&I)
- −$629
- Tax est. 1.5%
- −$150 /mo · $1,800/yr
- Insurance
- −$50
- HOA
- −$0
- Vacancy / Maint / Mgmt
- −$527
- Net cashflow
- $1,155
Break-even live
Sensitivity live
| Price | -10% $1,238 | -5% $1,196 | +0% $1,155 | +5% $1,113 | +10% $1,072 |
|---|---|---|---|---|---|
| Rent | -10% $956 | -5% $1,056 | +0% $1,155 | +5% $1,254 | +10% $1,353 |
| Rate | -1.0pp $1,215 | -0.5pp $1,185 | base $1,155 | +0.5pp $1,124 | +1.0pp $1,092 |
UW: 25.0% down · 7.5% · 30yr · 1.5% tax · 5.0% vac · 8.0% maint · 8.0% mgmt
Financing live
Cash to close
- Down payment
- $30,000
- Closing costs
- $3,600
- Reserves months
- —
- Total cash needed
- —
Loan-product check · same deal, 3 products live
Conventional
25% down · 7.5% · 30yr
- Down + closing
- —
- Monthly P&I
- —
- Monthly cashflow
- —
- DSCR
- —
- Eligible?
- —
Personal DTI + credit; lowest rate.
DSCR
20% down · 8.5% · 30yr
- Down + closing
- —
- Monthly P&I
- —
- Monthly cashflow
- —
- DSCR
- —
- Eligible?
- —
No personal income docs; deal must DSCR.
Hard money
10% down · 12.0% · 12mo
- Down + closing
- —
- Monthly P&I
- —
- Monthly cashflow
- —
- DSCR
- —
- Eligible?
- —
Short-term bridge; refi at stabilization.
Rent comps 16 comps
| Address | Beds | Baths | Sqft | Rent | $/sqft | DOM | Units | Dist |
|---|---|---|---|---|---|---|---|---|
| 15238 Doctor Martin Luther King Junior Dr Unit 2W Dolton, IL | 2.0 | 1.0 | 800 | $1,500 | $1.88 | 11d | 1 | 0.15mi |
| 15509 Park Ln South Holland, IL | 4.0 | 1.5 | 1200 | $3,400 | $2.83 | 8d | 1 | 0.33mi |
| 15509 Park Ln South Holland, IL | 4.0 | 1.5 | 1200 | $3,400 | $2.83 | 25d | 1 | 0.33mi |
| 14916 Langley Ave Dolton, IL | 3.0 | 1.5 | 1418 | $2,500 | $1.76 | 25d | 1 | 0.46mi |
| 14817 Champlain Ave Dolton, IL | 2.0 | 1.0 | 980 | $2,430 | $2.48 | 22d | 1 | 0.56mi |
| 15231 Hastings Dr Dolton, IL | 4.0 | 1.5 | 1487 | $2,146 | $1.44 | 8d | 1 | 0.94mi |
| 14844 Wabash Ave Dolton, IL | 3.0 | 1.5 | 1277 | $2,320 | $1.82 | 25d | 1 | 0.95mi |
| 14500 Cottage Grove Ave Unit 3 Dolton, IL | 2.0 | 1.0 | 1000 | $1,475 | $1.48 | 25d | 1 | 1.03mi |
| 14305 Irving Ave Unit 2 Dolton, IL | 3.0 | 1.0 | 1100 | $2,200 | $2.00 | 25d | 1 | 1.18mi |
| 14716 Dorchester Ave Dolton, IL | 3.0 | 2.0 | 1250 | $2,800 | $2.24 | 20d | 1 | 1.29mi |
| 16001 Avalon Ave South Holland, IL | 3.0 | 2.0 | 1136 | $3,330 | $2.93 | 7d | 1 | 1.32mi |
| 14433 Woodlawn Ave Dolton, IL | 4.0 | 2.0 | 1300 | $2,000 | $1.54 | 19d | 1 | 1.33mi |
| 14738 Blackstone Ave Dolton, IL | 3.0 | 1.0 | 1017 | $2,400 | $2.36 | 11d | 1 | 1.37mi |
| 16246 Dobson Ave South Holland, IL | 3.0 | 2.0 | 1250 | $3,170 | $2.54 | 2d | 1 | 1.43mi |
| 14610 Blackstone Ave Dolton, IL | 3.0 | 1.0 | 1017 | $2,400 | $2.36 | 7d | 1 | 1.47mi |
| 14124 Manor Ave Dolton, IL | 3.0 | 2.0 | 1440 | $2,390 | $1.66 | 25d | 1 | 1.48mi |
Listing history 29 events
-
2026-06-18days on market $120,000 Active 77 DOM
-
2026-06-17days on market $120,000 Active 76 DOM
-
2026-06-16days on market $120,000 Active 75 DOM
-
2026-06-15days on market $120,000 Active 74 DOM
-
2026-06-13days on market $120,000 Active 72 DOM
-
2026-06-13days on market $120,000 Active 71 DOM
-
2026-06-09days on market $120,000 Active 68 DOM
-
2026-06-08days on market $120,000 Active 67 DOM
-
2026-06-07pricedays on market $120,000 Active 66 DOM
-
2026-06-04days on market $125,000 Active 63 DOM
-
2026-06-03days on market $125,000 Active 62 DOM
-
2026-06-02days on market $125,000 Active 61 DOM
-
2026-06-01days on market $125,000 Active 60 DOM
-
2026-05-31days on market $125,000 Active 59 DOM
-
2026-05-05price $125,000
-
2026-04-02$130,000 Active
-
2025-10-29historical
-
2025-06-06Active
-
2025-05-17historical
-
2025-03-12status Active
-
2024-10-11status Pending
-
2024-08-02price
-
2024-05-18Active
-
2020-03-13
-
2020-03-13historical
-
1996-08-08soldstatus $86,000
-
1986-12-18soldstatus $57,800
-
1986-12-18soldstatus $57,800
-
1986-12-01soldstatus $57,800
ⓘ Source: listings_history table (triggers on properties + properties_extension) + one-shot
backfill from property_details.listing_events for pre-trigger history.
Climate risk First Street
- Flood 1/10 Low FEMA zone X (unshaded) · 0% chance over 30 yrs
- Wildfire 1/10 Low
- Heat 3/10 Moderate 7 d/yr ≥101°F today · 15 d/yr by 30 yrs out
- Wind 2/10 Low
- Air quality 4/10 Moderate 4 unhealthy d/yr today · 5 by 30 yrs out
Nearby sold comps map
Loading sold comps map…
Walkable amenities ~0.75 mi
Loading nearby amenities…
Taxation est. · year 1
- Rental income
- $30,139
- − Mortgage interest
- −$6,722
- − Property taxes
- −$1,800
- − Insurance
- −$600
- − Repairs & maintenance
- −$2,411
- − Management
- −$2,411
- − Depreciation
- −$3,491
- Taxable income
- $12,704
- Est. tax owed @ 24.0%
- −$3,049
- After-tax cash flow
- $10,809/yr
For passive investors: Depreciation is non-cash, so a rental often shows a tax loss while cash-flowing — sheltering income. Rental losses are passive: they offset passive income freely, and up to $25,000/yr can offset ordinary (W-2) income if you actively participate and your MAGI is under $100k (phasing out to $0 by $150k); unused losses carry forward. On sale, claimed depreciation is recaptured at up to 25%, and gains may owe capital-gains tax (a 1031 exchange can defer both). Figures are a year-1 estimate at your 24.0% rate — not tax advice; consult a CPA.
Schools (NCES district)
- District
- Thornton Twp Hsd 205
- NCES district ID
- 1738970
- Math proficiency
- 7% ▬ 0.00%
- Reading proficiency
- 8% ▼ -2.00%
- Median HH income
- $43,392
- Composite
- 6.92/100
- National rank
- #9976
- State rank
- #594 of 620 in IL
Livability — Dolton
- Score
- 74/100
- State rank
- #263
- US rank
- #4883
Category grades
Schools grade is shown separately in the Schools card above.
Census & demographics
- Census place
- Dolton, IL
- County
- Cook County · 4,486,803 people
- City population
- 20,825
- Metro
- Chicago-Naperville-Elgin, IL-IN-WI
- Population (ZIP)
- 20,825
- Household income
- $57,887
- Rent vs Own
- Severe rent burden
- 919.0
Population outlook (Cook County) Hauer SSP2
- Today (2025)
- 5,347,519 people
- By 2030
- 5,357,703 · +0.2%
- By 2040
- 5,324,924 · -0.4%
- By 2050
- 5,230,762 · -2.2%
- By 2075
- 4,785,735 · -10.5%
- By 2100
- 4,188,836 · -21.7%
Race, ethnicity, and origin ACS 2023
- Neighborhood character
- Predominantly Black (91%)
- Race & ethnicity
- Black 91% White 4% Two or more races 3% Hispanic / Latino 1%
- Common ancestry
- Romanian 1% Hispanic 1%
- Foreign-born
- 3% · Canada
- Languages at home
- 95% English-only · French/Haitian/Cajun 2% Spanish 1%
Political lean MEDSL · Cook
- 2024 margin
- Solid D (+42.0) · D 70.4% · R 28.4% · Other 1.2%
- 2008→2024 swing
- -11.4pp toward R · 2008: 53.4pp · 2024: 42.0pp
- All cycles
- 2024: D+42.0 2020: D+50.3 2016: D+53.0 2012: D+49.4 2008: D+53.4
Not yet ingested
- Civics
- —
Market trends
- HPI YoY
- ▼ -66.88%
- Current HPI
- 193.2346
- Rent YoY
- ▲ 9.65%
- Metro
- Chicago-Naperville-Elgin, IL-IN-WI
- State GDP YoY
- ▲ 1.59%
- F500 in state
- 60
Industry mix (Fortune 500 HQ in IL)
| Industry | F500 HQs | Revenue |
|---|---|---|
| Insurance | 4 | $201B |
|
||
| Consumer Goods | 4 | $87B |
|
||
| Industrial Machinery | 3 | $64B |
|
||
| Healthcare | 2 | $55B |
|
||
| Retail / Pharmacy | 1 | $148B |
|
||
| Agriculture / Food | 1 | $86B |
|
||
Price history
+116.3% since first listed15 events — show timeline
- 2026-05-05 Price Changed $125,000 MRED as Distributed by MLS Grid
- 2026-04-02 Listed $130,000 MRED as Distributed by MLS Grid
- 2025-10-29 Listing Removed — MRED as Distributed by MLS Grid
- 2025-06-06 Listed — MRED as Distributed by MLS Grid
- 2025-05-17 Listing Removed — MRED as Distributed by MLS Grid
- 2025-03-12 Relisted — MRED as Distributed by MLS Grid
- 2024-10-11 Pending — MRED as Distributed by MLS Grid
- 2024-08-02 Price Changed — MRED as Distributed by MLS Grid
- 2024-05-18 Listed — MRED as Distributed by MLS Grid
- 2020-03-13 Listing Removed — MRED as Distributed by MLS Grid
- 2020-03-13 Listed — MRED as Distributed by MLS Grid
- 1996-08-08 Sold (Public Records) $86,000 Public Records
- 1986-12-18 Sold (Public Records) $57,800 Public Records
- 1986-12-18 Sold (Public Records) $57,800 Public Records
- 1986-12-01 Sold (Public Records) $57,800 Public Records
Property tax history
+6.4%/yrLatest (2023): $8,544 · -6.4% YoY. Source: county tax records.
Cash-flow waterfall
monthlySold comps — $/sqft
last 12 mo · ≤1 miLoading sold comps…