303 N 7th St · Copperas Cove, TX
Flood risk 1/10 · Minimal
- FEMA flood zone
- X (unshaded)
- Chance of flooding over 30 yrs
- 0.0%
- Est. flood insurance / yr
- $507 – $1,088
Fire risk 5/10 · Moderate
- Est. fire insurance / yr
- $1,222 – $2,270
Heat risk 7/10 · Major
- Hot days now (above 106°F)
- 7 days/yr
- Hot days in 30 yrs
- 23 days/yr
Wind risk 6/10 · Moderate
- Chance of severe wind over 30 yrs
- 55.0%
Air-quality risk 1/10 · Minimal
- Unhealthy air days now
- 0 days/yr
- Unhealthy air days in 30 yrs
- 0 days/yr
Risk factors via First Street. Map © Google.
Why this score? — see what drove the C- grade
The composite is a weighted blend of 9 inputs, each scored 0–100. Each bar is that input's sub-score; the figure is the points it added to the 100-point composite (weight × sub-score).
- Cash flow +17.7/30.0
- ARV discount +12.0/15.0
- DSCR +5.5/10.0
- 1% rule +5.4/10.0
- Schools +3.6/10.0
- Livability +3.2/5.0
- Condition / age +2.5/5.0
- Rent growth +2.4/5.0
- Appreciation +0.0/10.0
$124,750
🖨 Deal sheet (PDF) 📄 Offer letter ✓ Due diligence
Listing remarks MLS
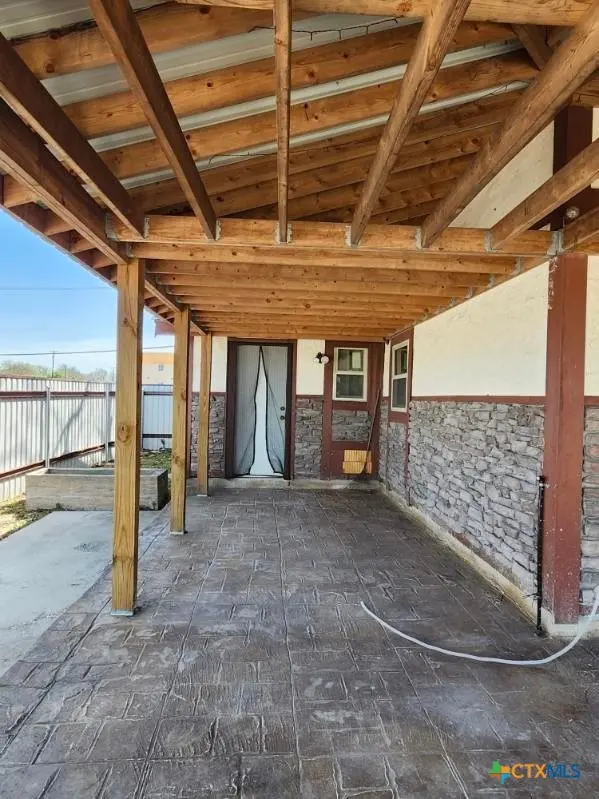
Amazing opportunity to make this your dream home! A Master bath and bedroom could be added in the attic area. In fact partial flooring and insulation has been done. Framing had also been started. Inside the layout is practical and flexible. The third bedroom area works well as a home office, playroom or hobby space. The kitchen includes a dishwasher, electric range and refrigerator. Washer and dryer will stay with the home. Large private backyard with metal fencing and two gates. Sizeable covered back patio for entertaining or relaxing in your own hot tub. The backyard provides ample space for gardening or future improvements.
Key facts
- Third bedroom area
- Flexible layout
- 8,624 sq ft lot
Tags
Neighborhood map
What this means for you Summary
Snapshot
- This is a 3-bed/1.0-bath single-family listed at $125k.
Deal economics
- At list price, monthly cash flow is $101 ($1k/yr) — positive.
- The deal already cash-flows at list — no discount required.
- Meets the 1% rule at list price ($1k rent vs $125k).
- Recommended offer: $114k (9.0% below list) — sets the bar for market timing.
- Cap rate 7.3% vs local median 3.4% in Copperas Cove — top-decile yield for the area; either an underpriced asset or a hidden risk that comps aren't pricing in. Stress-test before assuming the spread holds.
Location & tenants
- Location reads 65/100 on livability (#706 in TX) — a middle-class / working-renter tenant base. Strengths: cost of living A+, housing A+; Watch: schools C-, employment D+, amenities F.
- Copperas Cove ISD (suburban): math 41% / reading 42% proficiency, ranked #340 of 826 in TX (top 41%) — families likely to look elsewhere, expect single-tenant / working-renter base with shorter leases.
- Market conditions: Rents soft (-0.2%/yr); 608 active listings in the ZIP; 40 comparable units currently listed for rent nearby; rentals lingering (median 45d on market — plan ~5-8 weeks vacancy on turnover, expect pricing pressure); 68% of comp listings sitting > 30 days — soft ceiling on asking rent; 386 units permitted in Coryell County in 2024 (0 in 5+ unit buildings).
Forward outlook
- Local home prices are declining (-3.0%/yr); year-one equity from $862 of loan paydown is wiped out by about $4k of value loss. Plan a longer hold.
Negotiation context
- It's been on market 94 days — a 9% lower offer ($114k) is reasonable based on typical stale-listing flexibility.
- 8 sale attempts since 22y ago with the ask held roughly flat each time — persistent listings suggest the price (not the market) is what's stuck; bring a comps-based counter.
Risks & watch-outs
- Climate carrying-cost: major wind risk, 55% chance of damaging wind over 30y; moderate wildfire risk; extreme-heat days projected 7→23/yr by 2055 (HVAC capex compounding) — expect insurance premiums to compound above CPI over the hold.
Questions for the listing agent
- It's been on market 94 days. Have you received any prior offers? Is the seller open to a 9% concession, seller financing, or rate buy-down credit?
- Why hasn't it sold? Are there any deal-killer items the seller is aware of (foundation, flood, title, zoning, code violations)?
- Is there a deadline driving the sale (1031 exchange, divorce, estate, relocation)? That informs how much negotiation room exists.
- What's the average days-on-market for RENTAL listings here right now (not sales)? A rising rental-DOM trend means longer vacancies and softer asking-rent achievability than the comps imply.
- What's the recent tenant-quality profile in this submarket — average credit score on applications, eviction rate, late-payment / NSF rate, and stable-employment percentage? A property-management company in the area should have these aggregated.
- How much new for-sale + rental construction is in the pipeline within 1–3 miles? Heavy new supply typically softens prices + rents 12–24 months out; constrained supply supports both.
Investment metrics
- 1% rule
- 1.04% ✓
- Cap rate
- 7.26%
- Cash-on-cash
- 3.46%
- DSCR
- 1.15
- GRM
- 8.0
CMA / ARV
- ARV (median comp)
- $138,762
- List price
- $124,750
- Delta
- -10.10%
- Verdict
- UNDERPRICED
- Comps
- 20 within 1.0 mi
Show comp detail 12 sales within ~0.75 mi
| Address | Dist | Beds/Ba | Sqft | Sold | Price | $/sf | Match |
|---|---|---|---|---|---|---|---|
| 816 N 23rd St | 0.70mi | 3/2.0 | 1,333 (+1%) | 0mo | $191,000 | $143 | 61 |
| 612 N 13th St | 0.33mi | 3/1.5 | 1,152 (-12%) | 2mo | $168,350 | $146 | 61 |
| 208 N 2nd St | 0.36mi | 3/2.0 | 1,476 (+12%) | 2mo | $160,000 | $108 | 57 |
| 907 Hackberry St | 0.56mi | 3/2.0 | 1,212 (-8%) | 0mo | $185,000 | $153 | 56 |
| 1014 N 4th St | 0.74mi | 3/2.0 | 1,263 (-4%) | 1mo | $186,000 | $147 | 54 |
| 512 N 23rd St | 0.59mi | 4/2.0 (+1) | 1,400 (+6%) | 2mo | $210,000 | $150 | 51 |
| 112 W Hogan Dr | 0.75mi | 3/2.0 | 1,407 (+7%) | 0mo | $195,000 | $139 | 49 |
| 712 N 23rd St | 0.65mi | 3/2.0 | 1,190 (-10%) | 1mo | $154,000 | $129 | 49 |
| 918 Marilyn Dr | 0.68mi | 3/2.0 | 1,434 (+9%) | 0mo | $190,000 | $132 | 49 |
| 1301 Fairbanks St | 0.75mi | 4/2.0 (+1) | 1,371 (+4%) | 2mo | $220,000 | $160 | 48 |
| 802 S 23rd St | 0.70mi | 3/1.5 | 1,506 (+14%) | 1mo | $93,730 | $62 | 40 |
| 1202 Dryden Ave | 0.74mi | 3/1.5 | 1,142 (-13%) | 2mo | $180,000 | $158 | 40 |
Match score weights: distance 35% · size 25% · config 20% · recency 20%. Top-matched comps best support the ARV.
Projected returns pro-forma
-3.0% appreciation · 0.0% rent growth · sell at horizon
- IRR
- -14.5%
- Equity multiple
- 0.50×
- Total profit
- $-17,535
- Equity at exit
- $18,601
- IRR
- -12.1%
- Equity multiple
- 0.39×
- Total profit
- $-21,444
- Equity at exit
- $10,786
Cash invested: $34,930 (down + closing). Projections, not guarantees.
Landlord ↔ Tenant lean methodology
- Overall (STATE)
- 87 Strongly Landlord-Friendly
- State Texas
- 87 Strongly Landlord-Friendly · R+5
- County
- — inherits STATE
- City
- — inherits STATE
ZIP-level market 76522
- Home prices YoY
- -22.4%
- Rents YoY
- -0.2%
- Active inventory
- 608
- Price-to-rent
- 8.0×
Monthly cashflow live
- Estimated rent
- $1,295 high interval (Pro) →
- Mortgage (P&I)
- −$654
- Tax from tax record
- −$216 /mo · $2,596/yr
- Insurance
- −$52
- HOA
- −$0
- Vacancy / Maint / Mgmt
- −$272
- Net cashflow
- $101
Break-even live
Sensitivity live
| Price | -10% $171 | -5% $136 | +0% $101 | +5% $65 | +10% $30 |
|---|---|---|---|---|---|
| Rent | -10% $-2 | -5% $50 | +0% $101 | +5% $152 | +10% $203 |
| Rate | -1.0pp $164 | -0.5pp $133 | base $101 | +0.5pp $68 | +1.0pp $36 |
UW: 25.0% down · 7.5% · 30yr · 1.5% tax · 5.0% vac · 8.0% maint · 8.0% mgmt
Financing live
Cash to close
- Down payment
- $31,188
- Closing costs
- $3,742
- Reserves months
- —
- Total cash needed
- —
Loan-product check · same deal, 3 products live
Conventional
25% down · 7.5% · 30yr
- Down + closing
- —
- Monthly P&I
- —
- Monthly cashflow
- —
- DSCR
- —
- Eligible?
- —
Personal DTI + credit; lowest rate.
DSCR
20% down · 8.5% · 30yr
- Down + closing
- —
- Monthly P&I
- —
- Monthly cashflow
- —
- DSCR
- —
- Eligible?
- —
No personal income docs; deal must DSCR.
Hard money
10% down · 12.0% · 12mo
- Down + closing
- —
- Monthly P&I
- —
- Monthly cashflow
- —
- DSCR
- —
- Eligible?
- —
Short-term bridge; refi at stabilization.
Rent comps 40 comps
| Address | Beds | Baths | Sqft | Rent | $/sqft | DOM | Units | Dist |
|---|---|---|---|---|---|---|---|---|
| 509 West Avenue B Copperas Cove, TX | 3.0 | 2.0 | 1339 | $1,175 | $0.88 | 24d | 1 | 0.09mi |
| 414 West Avenue C Unit C Copperas Cove, TX | 3.0 | 2.0 | 1343 | $1,600 | $1.19 | 44d | 1 | 0.11mi |
| 412 West Avenue C Unit C Copperas Cove, TX | 3.0 | 2.0 | 1343 | $1,600 | $1.19 | 22d | 1 | 0.11mi |
| 605 N 11th St Copperas Cove, TX | 3.0 | 2.0 | 1432 | $1,575 | $1.10 | 44d | 1 | 0.25mi |
| 204 W Truman Ave Unit D Copperas Cove, TX | 2.0 | 1.0 | 895 | $800 | $0.89 | 44d | 1 | 0.33mi |
| 806 N 3rd St Unit A Copperas Cove, TX | 3.0 | 2.0 | 1130 | $1,150 | $1.02 | 44d | 1 | 0.33mi |
| 502 S 9th St Copperas Cove, TX | 3.0 | 1.5 | 1479 | $1,150 | $0.78 | 44d | 1 | 0.34mi |
| 403 S 7th St Copperas Cove, TX | 3.0 | 1.0 | 910 | $1,100 | $1.21 | 44d | 1 | 0.34mi |
| 204 West Avenue F Unit B Copperas Cove, TX | 2.0 | 1.0 | 895 | $705 | $0.79 | 44d | 1 | 0.34mi |
| 204 West Avenue F Unit A Copperas Cove, TX | 2.0 | 1.0 | 895 | $725 | $0.81 | 44d | 1 | 0.34mi |
| 604 N Main St Apt C Copperas Cove, TX | 2.0 | 1.5 | 1000 | $750 | $0.75 | 44d | 1 | 0.39mi |
| 604 N Main St Apt D Copperas Cove, TX | 3.0 | 1.5 | 1100 | $900 | $0.82 | 44d | 1 | 0.39mi |
| 910 Hill St Copperas Cove, TX | 3.0 | 1.0 | 1036 | $995 | $0.96 | 24d | 1 | 0.44mi |
| 105 E Reagan Ave Copperas Cove, TX | 2.0 | 1.0 | 1758 | $675 | $0.38 | 44d | 1 | 0.45mi |
| 604 S 11th St Copperas Cove, TX | 3.0 | 2.0 | 1119 | $1,300 | $1.16 | 44d | 1 | 0.48mi |
| 614 N 21st St Copperas Cove, TX | 3.0 | 2.0 | 1683 | $1,300 | $0.77 | 24d | 1 | 0.53mi |
| 906 Tanner Rd Copperas Cove, TX | 3.0 | 2.0 | 1725 | $1,550 | $0.90 | 14d | 1 | 0.54mi |
| 611 N 21st St Copperas Cove, TX | 3.0 | 2.0 | 1128 | $1,250 | $1.11 | 14d | 1 | 0.55mi |
| 1002 W Avenue B Unit B Copperas Cove, TX | 2.0 | 2.0 | 1842 | $975 | $0.53 | 44d | 1 | 0.56mi |
| 803 Michelle Dr Copperas Cove, TX | 3.0 | 1.5 | 1026 | $1,000 | $0.97 | 44d | 1 | 0.62mi |
| 309 Myra Lou Ave Copperas Cove, TX | 3.0 | 2.0 | 1269 | $1,125 | $0.89 | 44d | 1 | 0.64mi |
| 808 Mary St Copperas Cove, TX | 3.0 | 1.0 | 1028 | $1,300 | $1.26 | 44d | 1 | 0.66mi |
| 820 Michelle Dr Copperas Cove, TX | 3.0 | 2.0 | 1053 | $1,095 | $1.04 | 24d | 1 | 0.67mi |
| 204 South Dr Unit A Copperas Cove, TX | 2.0 | 1.0 | 895 | $999 | $1.12 | 44d | 1 | 0.68mi |
| 904 Mary St Copperas Cove, TX | 3.0 | 2.0 | 1041 | $1,052 | $1.01 | 44d | 1 | 0.70mi |
| 833 Michelle Dr Copperas Cove, TX | 3.0 | 2.0 | 1200 | $1,325 | $1.10 | 14d | 1 | 0.72mi |
| 1204 Dryden Ave Copperas Cove, TX | 3.0 | 2.0 | 1156 | $1,100 | $0.95 | 44d | 1 | 0.73mi |
| 806 S 25th St Copperas Cove, TX | 3.0 | 2.0 | 1400 | $1,400 | $1.00 | 44d | 1 | 0.76mi |
| 1517 Dryden Ave Copperas Cove, TX | 3.0 | 2.0 | 1841 | $1,800 | $0.98 | 14d | 1 | 0.76mi |
| 915 S 15th St Copperas Cove, TX | 3.0 | 2.0 | 1008 | $850 | $0.84 | 14d | 1 | 0.77mi |
| 848 Michelle Dr Copperas Cove, TX | 3.0 | 2.0 | 1120 | $1,195 | $1.07 | 14d | 1 | 0.79mi |
| 1004 S 3rd St Copperas Cove, TX | 3.0 | 1.0 | 940 | $950 | $1.01 | 24d | 1 | 0.79mi |
| 1005 S 11th St Copperas Cove, TX | 4.0 | 2.0 | 1236 | $1,090 | $0.88 | 44d | 1 | 0.81mi |
| 1010 Georgetown Rd Copperas Cove, TX | 3.0 | 1.0 | 1018 | $995 | $0.98 | 44d | 1 | 0.81mi |
| 504 Highway Ave Unit B Copperas Cove, TX | 2.0 | 1.0 | 1500 | $700 | $0.47 | 44d | 1 | 0.83mi |
| 211 E Hogan Dr Copperas Cove, TX | 3.0 | 2.0 | 1372 | $1,400 | $1.02 | 14d | 1 | 0.86mi |
| 114 Nelson Dr Copperas Cove, TX | 3.0 | 2.0 | 1448 | $1,400 | $0.97 | 44d | 1 | 0.86mi |
| 1005 S 19th St Copperas Cove, TX | 3.0 | 1.5 | 1356 | $1,100 | $0.81 | 44d | 1 | 0.87mi |
| 1006 S 21st St Copperas Cove, TX | 4.0 | 2.0 | 1445 | $1,100 | $0.76 | 44d | 1 | 0.91mi |
| 1202 S 3rd St Copperas Cove, TX | 3.0 | 2.0 | 1056 | $1,175 | $1.11 | 44d | 1 | 0.93mi |
Listing history 35 events
-
2026-06-21days on market $124,750 Active 94 DOM
-
2026-06-18days on market $124,750 Active 91 DOM
-
2026-06-17days on market $124,750 Active 90 DOM
-
2026-06-16days on market $124,750 Active 89 DOM
-
2026-06-15days on market $124,750 Active 88 DOM
-
2026-06-14days on market $124,750 Active 86 DOM
-
2026-06-13days on market $124,750 Active 85 DOM
-
2026-06-10days on market $124,750 Active 83 DOM
-
2026-06-09days on market $124,750 Active 82 DOM
-
2026-06-08days on market $124,750 Active 81 DOM
-
2026-06-07days on market $124,750 Active 80 DOM
-
2026-06-05days on market $124,750 Active 77 DOM
-
2026-06-03days on market $124,750 Active 76 DOM
-
2026-06-02days on market $124,750 Active 75 DOM
-
2026-06-01days on market $124,750 Active 74 DOM
-
2026-05-31days on market $124,750 Active 73 DOM
-
2026-05-30days on market $124,750 Active 72 DOM
-
2026-03-19$124,750 Active 634-char remark
Show marketing remark (634 chars)
Amazing opportunity to make this your dream home! A Master bath and bedroom could be added in the attic area. In fact partial flooring and insulation has been done. Framing had also been started. Inside the layout is practical and flexible. The third bedroom area works well as a home office, playroom or hobby space. The kitchen includes a dishwasher, electric range and refrigerator. Washer and dryer will stay with the home. Large private backyard with metal fencing and two gates. Sizeable covered back patio for entertaining or relaxing in your own hot tub. The backyard provides ample space for gardening or future improvements.
-
2026-03-04historical
-
2026-01-04price $125,000
-
2026-01-03status Active
-
2025-12-29status Pending
-
2025-12-26status Active
-
2025-12-22status Pending
-
2025-10-24price $135,000
-
2025-08-05status Active
-
2025-05-27status Pending
-
2025-05-12price $139,000
-
2025-03-05$140,000 Active
-
2014-07-24soldstatus
-
2014-01-04$39,500
-
2011-10-28soldstatus
-
2011-06-02$29,500
-
2004-08-20soldstatus
-
2004-06-11$29,900
ⓘ Source: listings_history table (triggers on properties + properties_extension) + one-shot
backfill from property_details.listing_events for pre-trigger history.
Tax reassessment forecast TX · Resets to sale price
- Current annual tax
- $2,596 · $216/mo
- Projected year-2 tax
- $2,596 · $216/mo
- Expected delta
- $0/yr ($0/mo · 0.0%)
ⓘ Screening estimate from a state-policy table — verify with the county assessor before closing.
Climate risk First Street
- Flood 1/10 Low FEMA zone X (unshaded) · 0% chance over 30 yrs
- Wildfire 5/10 Major
- Heat 7/10 Severe 7 d/yr ≥106°F today · 23 d/yr by 30 yrs out
- Wind 6/10 Major 55% chance of damaging wind over 30 yrs
- Air quality 1/10 Low 0 unhealthy d/yr today · 0 by 30 yrs out
Nearby sold comps map
Loading sold comps map…
Walkable amenities ~0.75 mi
Loading nearby amenities…
Taxation est. · year 1
- Rental income
- $15,543
- − Mortgage interest
- −$6,988
- − Property taxes
- −$2,596
- − Insurance
- −$624
- − Repairs & maintenance
- −$1,243
- − Management
- −$1,243
- − Depreciation
- −$3,629
- Taxable loss
- −$780
- Est. tax savings @ 24.0%
- +$187
- After-tax cash flow
- $1,397/yr
For passive investors: Depreciation is non-cash, so a rental often shows a tax loss while cash-flowing — sheltering income. Rental losses are passive: they offset passive income freely, and up to $25,000/yr can offset ordinary (W-2) income if you actively participate and your MAGI is under $100k (phasing out to $0 by $150k); unused losses carry forward. On sale, claimed depreciation is recaptured at up to 25%, and gains may owe capital-gains tax (a 1031 exchange can defer both). Figures are a year-1 estimate at your 24.0% rate — not tax advice; consult a CPA.
Schools (NCES district)
- District
- Copperas Cove ISD
- NCES district ID
- 4815240
- Math proficiency
- 41% ▼ -6.00%
- Reading proficiency
- 42% ▼ -2.00%
- Median HH income
- $51,072
- Composite
- 35.85/100
- National rank
- #4822
- State rank
- #340 of 826 in TX
Livability — Copperas Cove
- Score
- 65/100
- State rank
- #706
- US rank
- #13158
Category grades
Schools grade is shown separately in the Schools card above.
Census & demographics
- Census place
- Copperas Cove, TX
- County
- Coryell County · 61,053 people
- City population
- 42,118
- Metro
- Killeen-Temple, TX
- Population (ZIP)
- 42,118
- Household income
- $72,206
- Rent vs Own
- Severe rent burden
- 1019.0
Population outlook (Coryell County) Hauer SSP2
- Today (2025)
- 75,485 people
- By 2030
- 75,627 · +0.2%
- By 2040
- 74,898 · -0.8%
- By 2050
- 74,221 · -1.7%
- By 2075
- 72,688 · -3.7%
- By 2100
- 66,862 · -11.4%
Race, ethnicity, and origin ACS 2023
- Neighborhood character
- Diverse neighborhood (Simpson 0.66)
- Race & ethnicity
- White 53% Hispanic / Latino 21% Two or more races 20% Black 14% Asian 2%
- Hispanic origin (detail)
- Mexican 11% Puerto Rican 6%
- Common ancestry
- Romanian 2% Italian 2% Lithuanian 2%
- Foreign-born
- 7% · Canada, South Korea
- Languages at home
- 85% English-only · Spanish 10% German/W. Germanic 2% Other Asian/Pacific 1%
Political lean MEDSL · Coryell
- 2024 margin
- Solid R (+40.7) · D 29.1% · R 69.8% · Other 1.1%
- 2008→2024 swing
- -13.8pp toward R · 2008: -26.9pp · 2024: -40.7pp
- All cycles
- 2024: R+40.7 2020: R+33.5 2016: R+39.5 2012: R+36.6 2008: R+26.9
Not yet ingested
- Civics
- —
Market trends
- HPI YoY
- ▼ -53.11%
- Current HPI
- 183.9452
- Rent YoY
- ▼ -0.25%
- Metro
- Killeen-Temple, TX
- State GDP YoY
- ▲ 3.95%
- F500 in state
- 110
Industry mix (Fortune 500 HQ in TX)
| Industry | F500 HQs | Revenue |
|---|---|---|
| Energy | 16 | $1,198B |
|
||
| Technology | 5 | $198B |
|
||
| Engineering / Construction | 4 | $72B |
|
||
| Energy Services | 3 | $60B |
|
||
| Utilities | 3 | $41B |
|
||
| Healthcare | 2 | $330B |
|
||
Price history
+317.2% since first listed18 events — show timeline
- 2026-03-19 Listed $124,750 CTXMLS
- 2026-03-04 Listing Removed — CTXMLS
- 2026-01-04 Price Changed $125,000 CTXMLS
- 2026-01-03 Relisted — CTXMLS
- 2025-12-29 Pending — CTXMLS
- 2025-12-26 Relisted — CTXMLS
- 2025-12-22 Pending — CTXMLS
- 2025-10-24 Price Changed $135,000 CTXMLS
- 2025-08-05 Relisted — CTXMLS
- 2025-05-27 Pending — CTXMLS
- 2025-05-12 Price Changed $139,000 CTXMLS
- 2025-03-05 Listed $140,000 CTXMLS
- 2014-07-24 Sold (Public Records) — Public Records
- 2014-01-04 Listed $39,500 CTXMLS
- 2011-10-28 Sold (Public Records) — Public Records
- 2011-06-02 Listed $29,500 CTXMLS
- 2004-08-20 Sold (Public Records) — Public Records
- 2004-06-11 Listed $29,900 CTXMLS
Property tax history
+5.4%/yrLatest (2025): $2,596 · +2.8% YoY. Source: county tax records.
Cash-flow waterfall
monthlySold comps — $/sqft
last 12 mo · ≤1 miLoading sold comps…