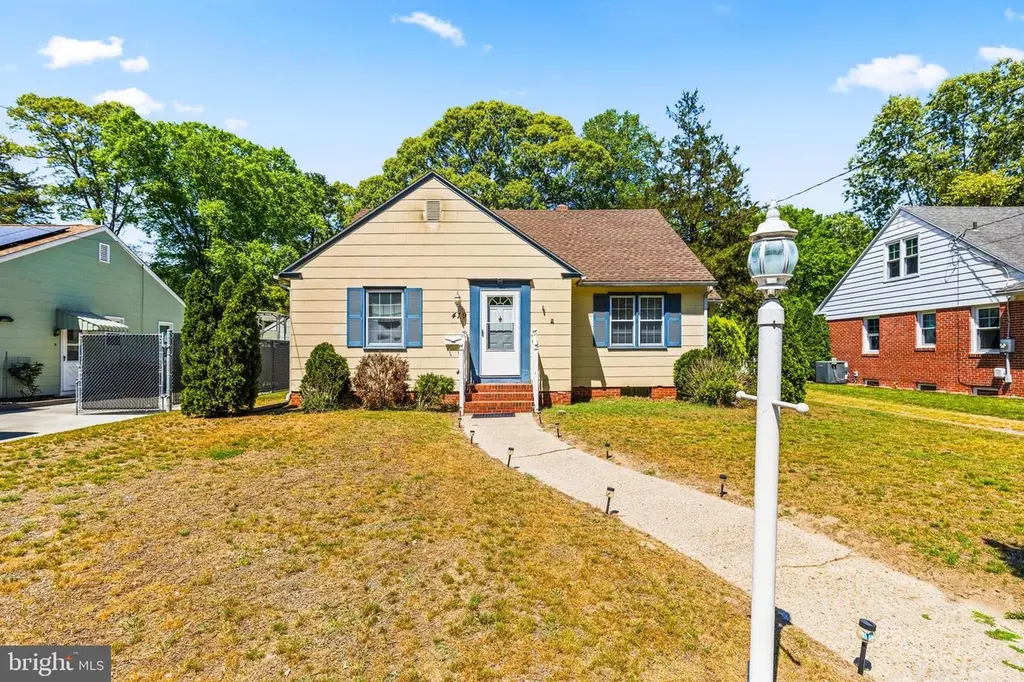
419 Somerset Ave · Salisbury, MD
Flood risk 1/10 · Minimal
- FEMA flood zone
- X (unshaded)
- Chance of flooding over 30 yrs
- 0.0%
- Est. flood insurance / yr
- $507 – $1,088
Fire risk 1/10 · Minimal
- Est. fire insurance / yr
- $755 – $1,403
Heat risk 8/10 · Major
- Hot days now (above 105°F)
- 7 days/yr
- Hot days in 30 yrs
- 15 days/yr
Wind risk 8/10 · Major
- Chance of severe wind over 30 yrs
- 80.0%
Air-quality risk 2/10 · Minimal
- Unhealthy air days now
- 1 days/yr
- Unhealthy air days in 30 yrs
- 2 days/yr
Risk factors via First Street. Map © Google.
Why this score? — see what drove the C- grade
The composite is a weighted blend of 9 inputs, each scored 0–100. Each bar is that input's sub-score; the figure is the points it added to the 100-point composite (weight × sub-score).
- Cash flow +16.8/30.0
- ARV discount +15.0/15.0
- DSCR +5.2/10.0
- Rent growth +4.3/5.0
- 1% rule +3.5/10.0
- Livability +3.0/5.0
- Condition / age +2.5/5.0
- Schools +1.9/10.0
- Appreciation +0.0/10.0
$229,900
🖨 Deal sheet 📄 Offer letter ✓ Due diligence
Listing remarks MLS
SHOW & SELL
Key facts
- Screened in porch
- Plenty of storage
- Exceptional lighting
Tags
Property features AI
Exterior
- Parking: Driveway; On-street parking
- Utilities: Public water; Public sewer; Electric hot water
- Home design: Detached property; Fee simple ownership
- Construction: Block foundation
- Exterior features: Not in a federal flood zone; Tidal water: No
Interior
- Kitchen: Electric range/oven; Refrigerator; Dishwasher not specified
- Bedrooms: Two bedrooms on the main level; One bedroom on the upper level
- Bathrooms: One full bathroom on the main level; One full bathroom total
- Heating & cooling: Forced air heating (electric); Window air conditioning units (electric)
- Interior features: Partially finished basement; Washer and electric dryer included; Oven/Range (electric) included; Refrigerator included
- Laundry & utility: Washer; Electric dryer
Neighborhood map
What this means for you Summary
Snapshot
- This is a 3-bed/1.0-bath single-family listed at $230k.
Deal economics
- At list price, monthly cash flow is $149 ($2k/yr) — positive.
- The deal already cash-flows at list — no discount required.
- To meet the 1% rule (rent ≥ 1% of price), the offer needs to be $196k (14.9% below list).
- Recommended offer: $196k (14.9% below list) — sets the bar for 1% rule.
- Cap rate 7.1% vs local median 4.8% in Salisbury — top-decile yield for the area; either an underpriced asset or a hidden risk that comps aren't pricing in. Stress-test before assuming the spread holds.
Location & tenants
- Location reads 60/100 on livability (#351 in MD) — a middle-class / working-renter tenant base. Strengths: health & safety A+, cost of living A, housing A; Watch: schools D-, crime F, amenities F.
- Wicomico County Public Schools (urban): math 16% / reading 26% proficiency, ranked #19 of 24 in MD (top 79%) — low school quality limits family demand, transient renter base, plan for 1-2y turnover.
- Market conditions: Rents rising fast (+7.2%/yr); 190 active listings in the ZIP; 10 comparable units currently listed for rent nearby; rentals lingering (median 44d on market — plan ~5-8 weeks vacancy on turnover, expect pricing pressure); 60% of comp listings sitting > 30 days — soft ceiling on asking rent; 278 units permitted in Wicomico County in 2024 (44 in 5+ unit buildings).
- This rent runs 33% of the median local income ($71k/yr) — at the standard rent-burdened threshold; future hikes will face affordability resistance.
Forward outlook
- Local home prices are declining (-3.0%/yr); year-one equity from $2k of loan paydown is wiped out by about $7k of value loss. Plan a longer hold.
- Wicomico County population projected at +14% by 2050 — modest demand growth; plan on rents tracking national, not racing it.
Negotiation context
- Only 8 days on market — expect competitive offers; lowballing is unlikely to land.
- 2 sale attempts since 30y ago with the ask held roughly flat each time — persistent listings suggest the price (not the market) is what's stuck; bring a comps-based counter.
Risks & watch-outs
- Watch-outs: built in 1956 — expect roof / HVAC / electrical / plumbing capex.
- Climate carrying-cost: severe wind risk, 80% chance of damaging wind over 30y; extreme-heat days projected 7→15/yr by 2055 (HVAC capex compounding) — expect insurance premiums to compound above CPI over the hold.
Questions for the listing agent
- Built in 1956 — when were the roof, HVAC, electrical panel, plumbing, and water heater last replaced?
- Is there a deadline driving the sale (1031 exchange, divorce, estate, relocation)? That informs how much negotiation room exists.
- Schools are D-rated, which usually means shorter tenancies and higher turnover. Who's the typical renter profile here, and what's been the actual vacancy rate?
- Crime grade is F in this area — have there been break-ins, vandalism, or insurance claims at this property in the last 3 years? What carrier currently insures it and at what premium?
- What's the average days-on-market for RENTAL listings here right now (not sales)? A rising rental-DOM trend means longer vacancies and softer asking-rent achievability than the comps imply.
- What's the recent tenant-quality profile in this submarket — average credit score on applications, eviction rate, late-payment / NSF rate, and stable-employment percentage? A property-management company in the area should have these aggregated.
- How much new for-sale + rental construction is in the pipeline within 1–3 miles? Heavy new supply typically softens prices + rents 12–24 months out; constrained supply supports both.
Investment metrics
- 1% rule
- 0.85% ✗
- Cap rate
- 7.07%
- Cash-on-cash
- 2.78%
- DSCR
- 1.12
- GRM
- 9.8
CMA / ARV
- ARV (median comp)
- $310,828
- List price
- $229,900
- Delta
- -26.04%
- Verdict
- UNDERPRICED
- Comps
- 20 within 1.0 mi
Show comp detail 12 sales within ~0.75 mi
| Address | Dist | Beds/Ba | Sqft | Sold | Price | $/sf | Match |
|---|---|---|---|---|---|---|---|
| 426 Pinehurst Ave | 0.08mi | 3/2.0 | 1,692 (+5%) | 1mo | $325,000 | $192 | 84 |
| 412 Somerset Ave | 0.04mi | 3/1.0 | 1,454 (-10%) | 2mo | $280,000 | $193 | 79 |
| 414 Monticello Ave | 0.19mi | 3/1.5 | 1,550 (-4%) | 6mo | $285,000 | $184 | 77 |
| 232 North Blvd | 0.47mi | 3/1.5 | 1,594 (-2%) | 5mo | $210,000 | $132 | 69 |
| 1001 Riverside Dr | 0.33mi | 3/2.0 | 1,552 (-4%) | 6mo | $225,000 | $145 | 69 |
| 421 Loblolly Ln | 0.25mi | 3/2.0 | 1,514 (-6%) | 8mo | $291,000 | $192 | 67 |
| 608 Manor Dr | 0.40mi | 3/2.0 | 1,538 (-5%) | 4mo | $320,000 | $208 | 66 |
| 301 North Blvd | 0.48mi | 3/1.5 | 1,568 (-3%) | 8mo | $240,000 | $153 | 64 |
| 303 Powell Ave | 0.25mi | 3/2.5 | 1,800 (+11%) | 8mo | $415,000 | $231 | 57 |
| 431 Monticello Ave | 0.23mi | 4/1.5 (+1) | 1,420 (-12%) | 7mo | $245,000 | $173 | 56 |
| 223 North Blvd | 0.51mi | 4/1.5 (+1) | 1,460 (-10%) | 1mo | $215,000 | $147 | 52 |
| 308 Ohio Ave | 0.57mi | 3/1.0 | 1,400 (-14%) | 0mo | $200,000 | $143 | 51 |
Match score weights: distance 35% · size 25% · config 20% · recency 20%. Top-matched comps best support the ARV.
Projected returns pro-forma
-3.0% appreciation · 7.21% rent growth · sell at horizon
- IRR
- -7.8%
- Equity multiple
- 0.70×
- Total profit
- $-19,214
- Equity at exit
- $34,279
- IRR
- 6.0%
- Equity multiple
- 1.52×
- Total profit
- $33,781
- Equity at exit
- $19,878
Cash invested: $64,372 (down + closing). Projections, not guarantees.
Landlord ↔ Tenant lean methodology
- Overall (STATE)
- 27 Tenant-Leaning
- State Maryland
- 27 Tenant-Leaning · D+14
- County
- — inherits STATE
- City
- — inherits STATE
ZIP-level market 21801
- Home prices YoY
- -30.6%
- Rents YoY
- 7.2%
- Active inventory
- 190
- Price-to-rent
- 9.8×
Monthly cashflow live
- Estimated rent
- $1,955 high interval (Pro) →
- Mortgage (P&I)
- −$1,206
- Tax from tax record
- −$94 /mo · $1,132/yr
- Insurance
- −$96
- HOA
- −$0
- Vacancy / Maint / Mgmt
- −$411
- Net cashflow
- $149
Break-even live
UW: 25.0% down · 7.5% · 30yr · 1.5% tax · 5.0% vac · 8.0% maint · 8.0% mgmt
Financing live
Cash to close
- Down payment
- $57,475
- Closing costs
- $6,897
- Reserves months
- —
- Total cash needed
- —
Loan-product check · same deal, 3 products live
Conventional
25% down · 7.5% · 30yr
- Down + closing
- —
- Monthly P&I
- —
- Monthly cashflow
- —
- DSCR
- —
- Eligible?
- —
Personal DTI + credit; lowest rate.
DSCR
20% down · 8.5% · 30yr
- Down + closing
- —
- Monthly P&I
- —
- Monthly cashflow
- —
- DSCR
- —
- Eligible?
- —
No personal income docs; deal must DSCR.
Hard money
10% down · 12.0% · 12mo
- Down + closing
- —
- Monthly P&I
- —
- Monthly cashflow
- —
- DSCR
- —
- Eligible?
- —
Short-term bridge; refi at stabilization.
Rent comps 10 comps
| Address | Beds | Baths | Sqft | Rent | $/sqft | DOM | Units | Dist |
|---|---|---|---|---|---|---|---|---|
| 421 Loblolly Ln Salisbury, MD | 3.0 | 2.0 | 1514 | $2,250 | $1.49 | 43d | 1 | 0.24mi |
| 518 Alabama Ave Salisbury, MD | 1.0–3.0 | 1.0–2.5 | 1028 | $1,784 | $1.73 | 13d | 14 | 0.55mi |
| 550 Riverside Dr Salisbury, MD | 3.0 | 2.0 | 1250 | $1,975 | $1.58 | 43d | 1 | 0.75mi |
| 101 Cedar Xing Salisbury, MD | 4.0 | 2.0–4.0 | 965 | $1,375 | $1.42 | 13d | 9 | 0.85mi |
| 306 Carrollton Ave Salisbury, MD | 4.0 | 1.0 | 1163 | $1,700 | $1.46 | 43d | 1 | 0.88mi |
| 218 W Main St Unit 401 Salisbury, MD | 2.0 | 1.0 | 1060 | $1,695 | $1.60 | 43d | 1 | 1.06mi |
| 255 Canal Park Dr Apt C Salisbury, MD | 4.0 | 2.0 | 1250 | $1,600 | $1.28 | 43d | 1 | 1.06mi |
| 1120 Wintermead Loop Salisbury, MD | 4.0 | 2.5 | 1968 | $2,500 | $1.27 | 21d | 1 | 1.24mi |
| 719 Shiloh St Unit 1 Salisbury, MD | 3.0 | 1.0 | 1152 | $1,625 | $1.41 | 13d | 1 | 1.25mi |
| 801 W Main St Fruitland, MD | 4.0 | 1.0 | 1232 | $1,700 | $1.38 | 43d | 1 | 1.48mi |
Listing history 6 events
-
2026-05-09status Pending 804-char remark
-
2026-05-01$229,900 Active 804-char remark
-
1996-07-03soldstatus $76,300
-
1996-06-28soldstatus $76,300 17-char remark
Show marketing remark (17 chars)
SHOW & SELL
-
1996-05-05$76,500 17-char remark
Show marketing remark (17 chars)
SHOW & SELL
-
1992-04-23soldstatus $48,000
ⓘ Source: listings_history table (triggers on properties + properties_extension) + one-shot
backfill from property_details.listing_events for pre-trigger history.
Tax reassessment forecast MD · Partial reset (capped growth)
- Current annual tax
- $1,132 · $94/mo
- Projected year-2 tax
- $1,819 · $152/mo
- Expected delta
- +$687/yr (+$57/mo · 60.7%)
ⓘ Screening estimate from a state-policy table — verify with the county assessor before closing.
Climate risk First Street
- Flood 1/10 Low FEMA zone X (unshaded) · 0% chance over 30 yrs
- Wildfire 1/10 Low
- Heat 8/10 Severe 7 d/yr ≥105°F today · 15 d/yr by 30 yrs out
- Wind 8/10 Severe 80% chance of damaging wind over 30 yrs
- Air quality 2/10 Low 1 unhealthy d/yr today · 2 by 30 yrs out
Nearby sold comps map
Loading sold comps map…
Walkable amenities ~0.75 mi
Loading nearby amenities…
Taxation est. · year 1
- Rental income
- $23,466
- − Mortgage interest
- −$12,878
- − Property taxes
- −$1,132
- − Insurance
- −$1,150
- − Repairs & maintenance
- −$1,877
- − Management
- −$1,877
- − Depreciation
- −$6,688
- Taxable loss
- −$2,136
- Est. tax savings @ 24.0%
- +$513
- After-tax cash flow
- $2,302/yr
For passive investors: Depreciation is non-cash, so a rental often shows a tax loss while cash-flowing — sheltering income. Rental losses are passive: they offset passive income freely, and up to $25,000/yr can offset ordinary (W-2) income if you actively participate and your MAGI is under $100k (phasing out to $0 by $150k); unused losses carry forward. On sale, claimed depreciation is recaptured at up to 25%, and gains may owe capital-gains tax (a 1031 exchange can defer both). Figures are a year-1 estimate at your 24.0% rate — not tax advice; consult a CPA.
Schools (NCES district)
- District
- Wicomico County Public Schools
- NCES district ID
- 2400690
- Math proficiency
- 16% ▼ -18.00%
- Reading proficiency
- 26% ▼ -13.00%
- Median HH income
- $51,745
- Composite
- 18.87/100
- National rank
- #8860
- State rank
- #19 of 24 in MD
Livability — Salisbury
- Score
- 60/100
- State rank
- #351
- US rank
- #18948
Category grades
Schools grade is shown separately in the Schools card above.
Census & demographics
- Census place
- Salisbury, MD
- County
- Wicomico County · 75,969 people
- City population
- 70,518
- Metro
- Salisbury, MD-DE
- Population (ZIP)
- 30,088
- Household income
- $71,313
- Rent vs Own
- Severe rent burden
- 964.0
Population outlook (Wicomico County) Hauer SSP2
- Today (2025)
- 108,548 people
- By 2030
- 111,783 · +3.0%
- By 2040
- 118,139 · +8.8%
- By 2050
- 123,641 · +13.9%
- By 2075
- 139,784 · +28.8%
- By 2100
- 145,334 · +33.9%
Race, ethnicity, and origin ACS 2023
- Neighborhood character
- Diverse neighborhood (Simpson 0.60)
- Race & ethnicity
- White 54% Black 33% Two or more races 6% Hispanic / Latino 6% Asian 2%
- Hispanic origin (detail)
- Mexican 3%
- Common ancestry
- Hispanic 4% Romanian 2% Slovak 2%
- Foreign-born
- 8% · Canada, China
- Languages at home
- 89% English-only · Spanish 4% French/Haitian/Cajun 3% Other Indo-European 2%
Political lean MEDSL · Wicomico
- 2024 margin
- Lean R (+5.5) · D 46.1% · R 51.5% · Other 2.4%
- 2008→2024 swing
- +0.3pp no change · 2008: -5.8pp · 2024: -5.5pp
- All cycles
- 2024: R+5.5 2020: R+1.9 2016: R+11.6 2012: R+6.9 2008: R+5.8
Not yet ingested
- Civics
- —
Market trends
- HPI YoY
- ▼ -102.55%
- Current HPI
- 232.3103
- Rent YoY
- ▲ 7.21%
- Metro
- Salisbury, MD-DE
- State GDP YoY
- ▲ 2.97%
- F500 in state
- 12
Industry mix (Fortune 500 HQ in MD)
| Industry | F500 HQs | Revenue |
|---|---|---|
| Aerospace / Defense | 1 | $71B |
|
||
| Utilities | 1 | $25B |
|
||
| Hotels | 1 | $24B |
|
||
| Consumer Goods | 1 | $7B |
|
||
| Real Estate | 1 | $6B |
|
||
| Chemicals | 1 | $2B |
|
||
Price history
+347.9% since first listed7 events — show timeline
- 2026-06-02 Sold (Public Records) $215,000 Public Records
- 2026-05-09 Pending — BRIGHT MLS
- 2026-05-01 Listed $229,900 BRIGHT MLS
- 1996-07-03 Sold (Public Records) $76,300 Public Records
- 1996-06-28 Sold (MLS) $76,300 BRIGHT MLS
- 1996-05-05 Listed $76,500 BRIGHT MLS
- 1992-04-23 Sold (Public Records) $48,000 Public Records
Property tax history
-2.2%/yrLatest (2025): $1,132 · +1.5% YoY. Source: county tax records.
Cash-flow waterfall
monthlySold comps — $/sqft
last 12 mo · ≤1 miLoading sold comps…