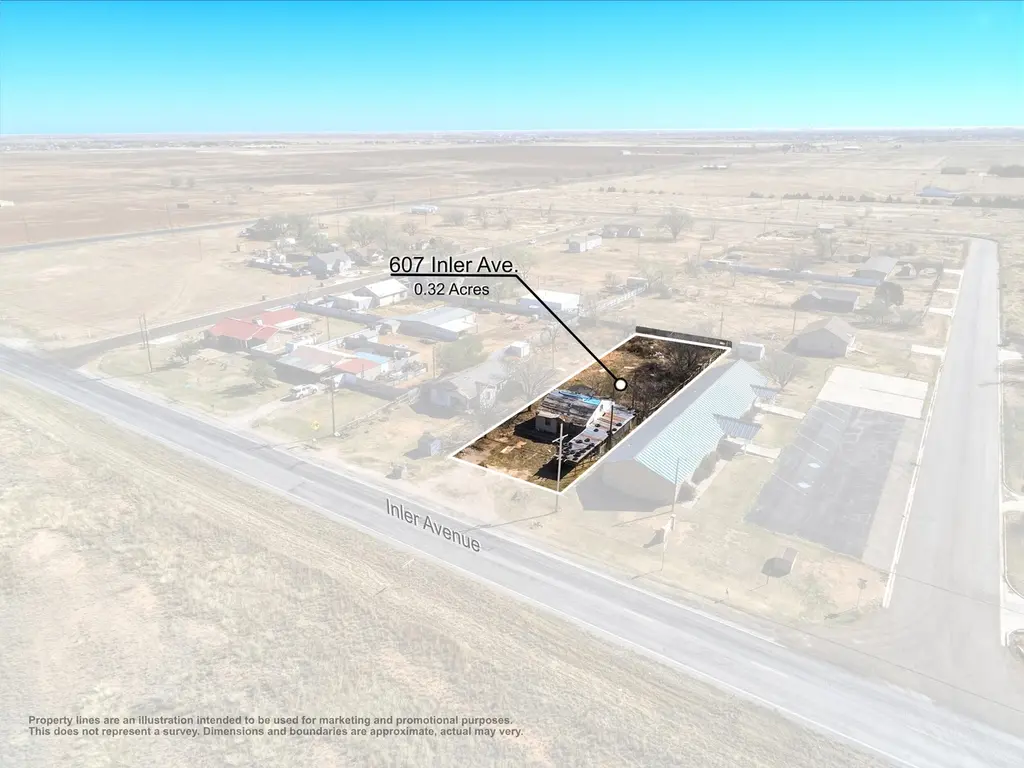
607 Inler Ave · Lubbock, TX
Flood risk 1/10 · Minimal
- FEMA flood zone
- X (unshaded)
- Chance of flooding over 30 yrs
- 0.0%
- Est. flood insurance / yr
- $507 – $1,088
Fire risk 8/10 · Major
- Est. fire insurance / yr
- $1,222 – $2,270
Heat risk 5/10 · Moderate
- Hot days now (above 99°F)
- 7 days/yr
- Hot days in 30 yrs
- 22 days/yr
Wind risk 2/10 · Minimal
- Chance of severe wind over 30 yrs
- 1.0%
Air-quality risk 2/10 · Minimal
- Unhealthy air days now
- 1 days/yr
- Unhealthy air days in 30 yrs
- 1 days/yr
Risk factors via First Street. Map © Google.
Why this score? — see what drove the B grade
The composite is a weighted blend of 9 inputs, each scored 0–100. Each bar is that input's sub-score; the figure is the points it added to the 100-point composite (weight × sub-score).
- Cash flow +30.0/30.0
- DSCR +10.0/10.0
- 1% rule +9.1/10.0
- ARV discount +7.5/15.0
- Schools +4.4/10.0
- Livability +4.0/5.0
- Rent growth +3.1/5.0
- Condition / age +2.5/5.0
- Appreciation +0.0/10.0
$119,000
🖨 Deal sheet 📄 Offer letter ✓ Due diligence
Listing remarks MLS
Selling Frenship ISD zoned neighbor homes 605 Inler and 607 Inler together! $135,000. Northwest Lubbock is one of the city's fastest-growing areas and these two homes are positioned right in the path of that expansion! With both homes sitting on . 32acres for a total of . 64 acres, a little over half an acre! Continued development by Betenbough Homes and the growth around the Reese Center home to employers like South Plains College and the Lubbock Police Academy are fueling job creation and increasing demand in the area. This is a true value-add opportunity. One home will require updates, (Electricity is on) while the second offers a full redevelopment option. A buyer could renovate both, rebuild, or even combine the lots to create a larger custom home, maximizing both use and long-term equity. With convenient access to Texas Tech University and the Lubbock Business Park, this is more than a purchase it's a strategic investment in a high-growth area.
Key facts
- Convenient access
- Total of .64 acres
- 0.32 acre lot
Tags
Neighborhood map
What this means for you Summary
Snapshot
- This is a 3-bed/1.0-bath single-family listed at $119k.
Deal economics
- At list price, monthly cash flow is $573 ($7k/yr) — positive.
- The deal already cash-flows at list — no discount required.
- Meets the 1% rule at list price ($2k rent vs $119k).
- Recommended offer: $112k (6.0% below list) — sets the bar for market timing.
Location & tenants
- Location reads 80/100 on livability (#37 in TX, #1,749 nationally) — a professional / high-income tenant draw. Strengths: commute A+, cost of living A+, housing A+; Watch: employment C-, schools D+, crime F.
- Frenship ISD (urban): math 47% / reading 54% proficiency, ranked #162 of 826 in TX (top 20%) — acceptable for families but not a draw, mixed tenant base, ~2y average lease.
- Market conditions: Rents rising (+2.2%/yr); 464 active listings in the ZIP; 33 comparable units currently listed for rent nearby; rentals at typical pace (median 21d on market — plan ~3-4 weeks tenant-placement turnaround); 2,219 units permitted in Lubbock County in 2024 (252 in 5+ unit buildings).
- This rent runs 32% of the median local income ($64k/yr) — at the standard rent-burdened threshold; future hikes will face affordability resistance.
Forward outlook
- Local home prices are declining (-3.0%/yr); year-one equity from $823 of loan paydown is wiped out by about $4k of value loss. Plan a longer hold.
- Lubbock County population projected at +39% by 2050 — long-run rental-demand tailwind backs the buy-and-hold thesis.
- At projected returns (-3.0% appreciation + 2.2% rent growth), your $33k cash investment doubles in ~7 years — after that, you're playing with house money.
Negotiation context
- It's been on market 85 days — a 6% lower offer ($112k) is reasonable based on typical stale-listing flexibility.
Risks & watch-outs
- Watch-outs: built in 1955 — expect roof / HVAC / electrical / plumbing capex.
- Climate carrying-cost: severe wildfire risk; extreme-heat days projected 7→22/yr by 2055 (HVAC capex compounding) — expect insurance premiums to compound above CPI over the hold.
Questions for the listing agent
- It's been on market 85 days. Have you received any prior offers? Is the seller open to a 6% concession, seller financing, or rate buy-down credit?
- Built in 1955 — when were the roof, HVAC, electrical panel, plumbing, and water heater last replaced?
- Why hasn't it sold? Are there any deal-killer items the seller is aware of (foundation, flood, title, zoning, code violations)?
- Is there a deadline driving the sale (1031 exchange, divorce, estate, relocation)? That informs how much negotiation room exists.
- Schools are D-rated, which usually means shorter tenancies and higher turnover. Who's the typical renter profile here, and what's been the actual vacancy rate?
- Crime grade is F in this area — have there been break-ins, vandalism, or insurance claims at this property in the last 3 years? What carrier currently insures it and at what premium?
- What's the average days-on-market for RENTAL listings here right now (not sales)? A rising rental-DOM trend means longer vacancies and softer asking-rent achievability than the comps imply.
- What's the recent tenant-quality profile in this submarket — average credit score on applications, eviction rate, late-payment / NSF rate, and stable-employment percentage? A property-management company in the area should have these aggregated.
- How much new for-sale + rental construction is in the pipeline within 1–3 miles? Heavy new supply typically softens prices + rents 12–24 months out; constrained supply supports both.
Investment metrics
- 1% rule
- 1.41% ✓
- Cap rate
- 12.07%
- Cash-on-cash
- 20.62%
- DSCR
- 1.92
- GRM
- 5.9
CMA / ARV
No comps found within radius.
Projected returns pro-forma
-3.0% appreciation · 2.21% rent growth · sell at horizon
- IRR
- 12.1%
- Equity multiple
- 1.48×
- Total profit
- $15,843
- Equity at exit
- $17,743
- IRR
- 20.4%
- Equity multiple
- 2.66×
- Total profit
- $55,336
- Equity at exit
- $10,289
Cash invested: $33,320 (down + closing). Projections, not guarantees.
Landlord ↔ Tenant lean methodology
- Overall (STATE)
- 87 Strongly Landlord-Friendly
- State Texas
- 87 Strongly Landlord-Friendly · R+5
- County
- — inherits STATE
- City
- — inherits STATE
ZIP-level market 79416
- Home prices YoY
- -20.0%
- Rents YoY
- 2.2%
- Active inventory
- 464
- Price-to-rent
- 5.9×
Monthly cashflow live
- Estimated rent
- $1,680 high interval (Pro) →
- Mortgage (P&I)
- −$624
- Tax from tax record
- −$81 /mo · $969/yr
- Insurance
- −$50
- HOA
- −$0
- Vacancy / Maint / Mgmt
- −$353
- Net cashflow
- $573
Break-even live
UW: 25.0% down · 7.5% · 30yr · 1.5% tax · 5.0% vac · 8.0% maint · 8.0% mgmt
Financing live
Cash to close
- Down payment
- $29,750
- Closing costs
- $3,570
- Reserves months
- —
- Total cash needed
- —
Loan-product check · same deal, 3 products live
Conventional
25% down · 7.5% · 30yr
- Down + closing
- —
- Monthly P&I
- —
- Monthly cashflow
- —
- DSCR
- —
- Eligible?
- —
Personal DTI + credit; lowest rate.
DSCR
20% down · 8.5% · 30yr
- Down + closing
- —
- Monthly P&I
- —
- Monthly cashflow
- —
- DSCR
- —
- Eligible?
- —
No personal income docs; deal must DSCR.
Hard money
10% down · 12.0% · 12mo
- Down + closing
- —
- Monthly P&I
- —
- Monthly cashflow
- —
- DSCR
- —
- Eligible?
- —
Short-term bridge; refi at stabilization.
Rent comps 33 comps
| Address | Beds | Baths | Sqft | Rent | $/sqft | DOM | Units | Dist |
|---|---|---|---|---|---|---|---|---|
| 8704 10th St Lubbock, TX | 3.0 | 2.0 | 1423 | $1,450 | $1.02 | 43d | 1 | 0.22mi |
| 1903 Langford Ave Unit B Lubbock, TX | 3.0 | 2.0 | 1500 | $1,300 | $0.87 | 43d | 1 | 0.98mi |
| 1903 Langford Ave Unit A Lubbock, TX | 3.0 | 2.0 | 1500 | $1,575 | $1.05 | 13d | 1 | 0.98mi |
| 1903 Langford Ave Unit A Lubbock, TX | 3.0 | 2.0 | 1500 | $1,575 | $1.05 | 43d | 1 | 0.98mi |
| 1918 Langford Ave Unit B Lubbock, TX | 3.0 | 2.0 | 1500 | $1,399 | $0.93 | 13d | 1 | 1.06mi |
| 1919 Langford Ave Unit A Lubbock, TX | 3.0 | 2.0 | 1500 | $1,399 | $0.93 | 43d | 1 | 1.06mi |
| 1919 Langford Ave Lubbock, TX | 3.0 | 2.0 | 1500 | $1,350 | $0.90 | 43d | 1 | 1.06mi |
| 2101 Langford Ave Lubbock, TX | 3.0 | 2.0 | 1500 | $1,400 | $0.93 | 43d | 1 | 1.10mi |
| 2028 Kenwood Ave Lubbock, TX | 3.0 | 2.0 | 1450 | $1,650 | $1.14 | 13d | 1 | 1.12mi |
| 2125 Kirksey Ave Lubbock, TX | 3.0 | 2.0 | 1450 | $1,650 | $1.14 | 13d | 1 | 1.16mi |
| 2122 Langford Ave Lubbock, TX | 3.0 | 2.0 | 1450 | $1,699 | $1.17 | 13d | 1 | 1.21mi |
| 2055 Kenwood Ave Lubbock, TX | 3.0 | 2.0 | 1450 | $1,649 | $1.14 | 13d | 1 | 1.22mi |
| 2123 Langford Ave Lubbock, TX | 3.0 | 2.0 | 1450 | $1,799 | $1.24 | 21d | 1 | 1.22mi |
| 2128 Langford Ave Lubbock, TX | 3.0 | 2.0 | 1450 | $1,699 | $1.17 | 13d | 1 | 1.25mi |
| 2130 Kokomo Ave Lubbock, TX | 4.0 | 2.0 | 1450 | $2,199 | $1.52 | 21d | 1 | 1.25mi |
| 2131 Kokomo Ave Unit A Lubbock, TX | 3.0 | 2.0 | 1360 | $1,500 | $1.10 | 21d | 1 | 1.25mi |
| 2132 Langford Ave Lubbock, TX | 3.0 | 2.0 | 1450 | $1,699 | $1.17 | 13d | 1 | 1.26mi |
| 2140 Kokomo Ave Lubbock, TX | 4.0 | 2.0 | 1450 | $1,999 | $1.38 | 43d | 1 | 1.30mi |
| 2138 Langford Ave Lubbock, TX | 3.0 | 2.0 | 1450 | $1,699 | $1.17 | 43d | 1 | 1.30mi |
| 2137 Langford Ave Lubbock, TX | 3.0 | 2.0 | 1450 | $1,700 | $1.17 | 21d | 1 | 1.30mi |
| 2139 Langford Ave Lubbock, TX | 3.0 | 2.0 | 1450 | $1,899 | $1.31 | 21d | 1 | 1.31mi |
| 2509 Kenwood Ave Lubbock, TX | 3.0 | 2.0 | 1450 | $1,699 | $1.17 | 21d | 1 | 1.32mi |
| 2143 Langford Ave Lubbock, TX | 3.0 | 2.0 | 1450 | $1,750 | $1.21 | 43d | 1 | 1.32mi |
| 2154 Kokomo Ave Lubbock, TX | 3.0 | 2.0 | 1450 | $1,799 | $1.24 | 21d | 1 | 1.32mi |
| 2511 Kenwood Ave Lubbock, TX | 3.0 | 2.0 | 1450 | $2,099 | $1.45 | 21d | 1 | 1.33mi |
| 2147 Langford Ave Lubbock, TX | 3.0 | 2.0 | 1450 | $1,699 | $1.17 | 21d | 1 | 1.33mi |
| 2148 Langford Ave Lubbock, TX | 3.0 | 2.0 | 1450 | $1,699 | $1.17 | 43d | 1 | 1.34mi |
| 2152 Langford Ave Unit Labs Lubbock, TX | 3.0 | 2.0 | 1450 | $1,660 | $1.14 | 21d | 1 | 1.35mi |
| 2162 Langford Ave Lubbock, TX | 3.0 | 2.0 | 1450 | $1,699 | $1.17 | 43d | 1 | 1.37mi |
| 2168 Langford Ave Lubbock, TX | 3.0 | 2.0 | 1450 | $1,699 | $1.17 | 43d | 1 | 1.38mi |
| 2603 Harmony Ave Lubbock, TX | 3.0 | 2.0 | 1450 | $1,749 | $1.21 | 13d | 1 | 1.42mi |
| 2603 Harmony Ave Lubbock, TX | 3.0 | 2.0 | 1450 | $1,749 | $1.21 | 21d | 1 | 1.42mi |
| 8607 29th St Lubbock, TX | 3.0 | 2.0 | 1350 | $1,749 | $1.30 | 43d | 1 | 1.48mi |
Listing history 18 events
-
2026-06-18days on market $119,000 Active 85 DOM
-
2026-06-17days on market $119,000 Active 84 DOM
-
2026-06-16days on market $119,000 Active 83 DOM
-
2026-06-15days on market $119,000 Active 82 DOM
-
2026-06-13days on market $119,000 Active 79 DOM
-
2026-06-10days on market $119,000 Active 77 DOM
-
2026-06-09days on market $119,000 Active 76 DOM
-
2026-06-08days on market $119,000 Active 75 DOM
-
2026-06-07days on market $119,000 Active 74 DOM
-
2026-06-05days on market $119,000 Active 71 DOM
-
2026-06-03days on market $119,000 Active 70 DOM
-
2026-06-02days on market $119,000 Active 69 DOM
-
2026-06-01days on market $119,000 Active 68 DOM
-
2026-05-31days on market $119,000 Active 67 DOM
-
2026-05-30days on market $119,000 Active 66 DOM
-
2026-05-14price $119,000 964-char remark
Show marketing remark (964 chars)
Selling Frenship ISD zoned neighbor homes 605 Inler and 607 Inler together! $135,000. Northwest Lubbock is one of the city's fastest-growing areas and these two homes are positioned right in the path of that expansion! With both homes sitting on . 32acres for a total of . 64 acres, a little over half an acre! Continued development by Betenbough Homes and the growth around the Reese Center home to employers like South Plains College and the Lubbock Police Academy are fueling job creation and increasing demand in the area. This is a true value-add opportunity. One home will require updates, (Electricity is on) while the second offers a full redevelopment option. A buyer could renovate both, rebuild, or even combine the lots to create a larger custom home, maximizing both use and long-term equity. With convenient access to Texas Tech University and the Lubbock Business Park, this is more than a purchase it's a strategic investment in a high-growth area.
-
2026-03-25$135,000 Active 964-char remark
Show marketing remark (964 chars)
Selling Frenship ISD zoned neighbor homes 605 Inler and 607 Inler together! $135,000. Northwest Lubbock is one of the city's fastest-growing areas and these two homes are positioned right in the path of that expansion! With both homes sitting on . 32acres for a total of . 64 acres, a little over half an acre! Continued development by Betenbough Homes and the growth around the Reese Center home to employers like South Plains College and the Lubbock Police Academy are fueling job creation and increasing demand in the area. This is a true value-add opportunity. One home will require updates, (Electricity is on) while the second offers a full redevelopment option. A buyer could renovate both, rebuild, or even combine the lots to create a larger custom home, maximizing both use and long-term equity. With convenient access to Texas Tech University and the Lubbock Business Park, this is more than a purchase it's a strategic investment in a high-growth area.
-
1986-12-31soldstatus
ⓘ Source: listings_history table (triggers on properties + properties_extension) + one-shot
backfill from property_details.listing_events for pre-trigger history.
Tax reassessment forecast TX · Resets to sale price
- Current annual tax
- $969 · $81/mo
- Projected year-2 tax
- $2,178 · $181/mo
- Expected delta
- +$1,208/yr (+$101/mo · 124.7%)
ⓘ Screening estimate from a state-policy table — verify with the county assessor before closing.
Climate risk First Street
- Flood 1/10 Low FEMA zone X (unshaded) · 0% chance over 30 yrs
- Wildfire 8/10 Severe
- Heat 5/10 Major 7 d/yr ≥99°F today · 22 d/yr by 30 yrs out
- Wind 2/10 Low 100% chance of damaging wind over 30 yrs
- Air quality 2/10 Low 1 unhealthy d/yr today · 1 by 30 yrs out
Nearby sold comps map
Loading sold comps map…
Walkable amenities ~0.75 mi
Loading nearby amenities…
Taxation est. · year 1
- Rental income
- $20,157
- − Mortgage interest
- −$6,666
- − Property taxes
- −$969
- − Insurance
- −$595
- − Repairs & maintenance
- −$1,613
- − Management
- −$1,613
- − Depreciation
- −$3,462
- Taxable income
- $5,240
- Est. tax owed @ 24.0%
- −$1,257
- After-tax cash flow
- $5,613/yr
For passive investors: Depreciation is non-cash, so a rental often shows a tax loss while cash-flowing — sheltering income. Rental losses are passive: they offset passive income freely, and up to $25,000/yr can offset ordinary (W-2) income if you actively participate and your MAGI is under $100k (phasing out to $0 by $150k); unused losses carry forward. On sale, claimed depreciation is recaptured at up to 25%, and gains may owe capital-gains tax (a 1031 exchange can defer both). Figures are a year-1 estimate at your 24.0% rate — not tax advice; consult a CPA.
Schools (NCES district)
- District
- Frenship ISD
- NCES district ID
- 4819830
- Math proficiency
- 47% ▼ -8.00%
- Reading proficiency
- 54% ▬ 0.00%
- Median HH income
- $54,376
- Composite
- 43.59/100
- National rank
- #2976
- State rank
- #162 of 826 in TX
Livability — Lubbock
- Score
- 80/100
- State rank
- #37
- US rank
- #1749
Category grades
Schools grade is shown separately in the Schools card above.
Census & demographics
- Census place
- Lubbock, TX
- County
- Lubbock County · 293,542 people
- City population
- 283,030
- Metro
- Lubbock, TX
- Population (ZIP)
- 36,442
- Household income
- $63,896
- Rent vs Own
- Severe rent burden
- 2214.0
Population outlook (Lubbock County) Hauer SSP2
- Today (2025)
- 345,960 people
- By 2030
- 371,449 · +7.4%
- By 2040
- 424,539 · +22.7%
- By 2050
- 481,150 · +39.1%
- By 2075
- 633,467 · +83.1%
- By 2100
- 746,853 · +115.9%
Race, ethnicity, and origin ACS 2023
- Neighborhood character
- Diverse neighborhood (Simpson 0.62)
- Race & ethnicity
- White 49% Hispanic / Latino 35% Two or more races 14% Black 9% Asian 3%
- Hispanic origin (detail)
- Mexican 28%
- Common ancestry
- Slovak 3% Italian 1% Serbian 1%
- Foreign-born
- 7% · Canada, China, South Korea
- Languages at home
- 81% English-only · Spanish 13% Chinese 1% Tagalog/Filipino 1%
Political lean MEDSL · Lubbock
- 2024 margin
- Solid R (+39.5) · D 29.7% · R 69.2% · Other 1.0%
- 2008→2024 swing
- -2.8pp toward R · 2008: -36.7pp · 2024: -39.5pp
- All cycles
- 2024: R+39.5 2020: R+32.2 2016: R+38.4 2012: R+40.9 2008: R+36.7
Not yet ingested
- Civics
- —
Market trends
- HPI YoY
- ▼ -56.94%
- Current HPI
- 227.7841
- Rent YoY
- ▲ 2.21%
- Metro
- Lubbock, TX
- State GDP YoY
- ▲ 3.95%
- F500 in state
- 110
Industry mix (Fortune 500 HQ in TX)
| Industry | F500 HQs | Revenue |
|---|---|---|
| Energy | 16 | $1,198B |
|
||
| Technology | 5 | $198B |
|
||
| Engineering / Construction | 4 | $72B |
|
||
| Energy Services | 3 | $60B |
|
||
| Utilities | 3 | $41B |
|
||
| Healthcare | 2 | $330B |
|
||
Price history
-11.9% since first listed3 events — show timeline
- 2026-05-14 Price Changed $119,000 LARMLS
- 2026-03-25 Listed $135,000 LARMLS
- 1986-12-31 Sold (Public Records) — Public Records
Property tax history
+7.7%/yrLatest (2025): $969 · +19.7% YoY. Source: county tax records.
Cash-flow waterfall
monthlySold comps — $/sqft
last 12 mo · ≤1 miLoading sold comps…