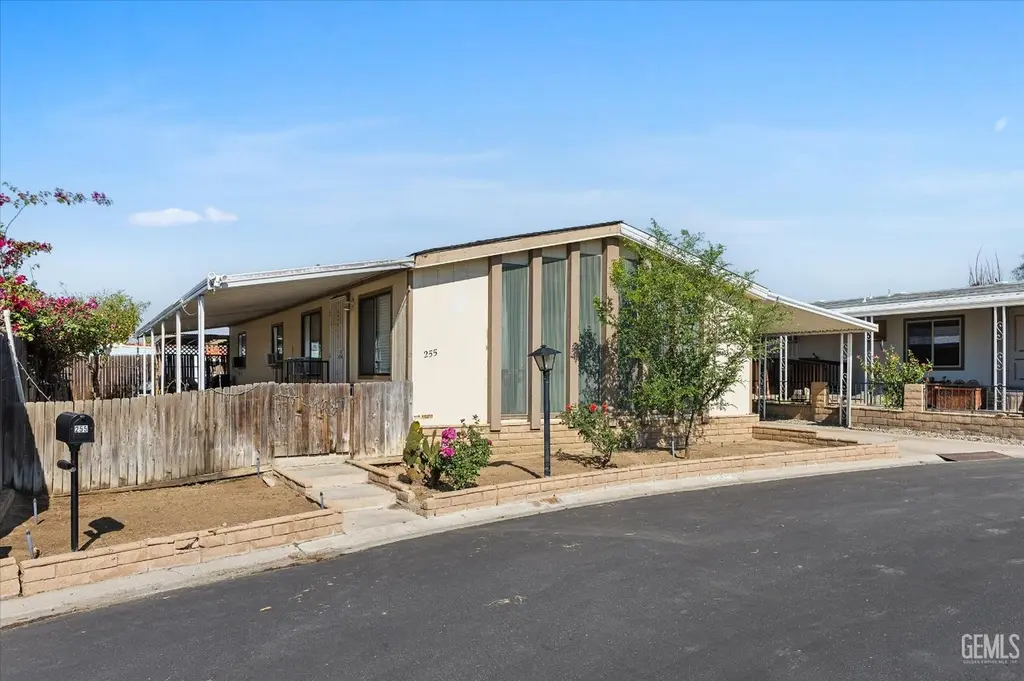
8536 Kern Cyn #255 · East Niles, CA
Flood risk 1/10 · Minimal
- FEMA flood zone
- X (unshaded)
- Chance of flooding over 30 yrs
- 0.0%
- Est. flood insurance / yr
- $507 – $1,088
Fire risk 7/10 · Major
- Est. fire insurance / yr
- $659 – $1,223
Heat risk 8/10 · Major
- Hot days now (above 105°F)
- 6 days/yr
- Hot days in 30 yrs
- 16 days/yr
Wind risk 1/10 · Minimal
- Chance of severe wind over 30 yrs
- —
Air-quality risk 10/10 · Severe
- Unhealthy air days now
- 34 days/yr
- Unhealthy air days in 30 yrs
- 40 days/yr
Risk factors via First Street. Map © Google.
Why this score? — see what drove the C+ grade
The composite is a weighted blend of 9 inputs, each scored 0–100. Each bar is that input's sub-score; the figure is the points it added to the 100-point composite (weight × sub-score).
- Cash flow +30.0/30.0
- DSCR +10.0/10.0
- 1% rule +8.6/10.0
- Schools +3.4/10.0
- Rent growth +3.1/5.0
- Livability +2.5/5.0
- Condition / age +2.5/5.0
- ARV discount +0.0/15.0
- Appreciation +0.0/10.0
$120,000
🖨 Deal sheet 📄 Offer letter ✓ Due diligence
Listing remarks
Beautifully upgraded and well-maintained manufactured home located in a peaceful cul-de-sac. Featuring fresh interior paint and updated flooring, this spacious home reflects true pride of ownership throughout. Ideal for first-time buyers, downsizers or investors seeking comfort, style, and value. Community amenities include a pool, basketball court, pickleball court, and clubhouse for residents to enjoy. The monthly space fee provides added convenience by covering utilities such as electricity, gas, and water, offering a predictable and manageable cost.
Key facts
- Community amenities
- Peaceful cul-de-sac
- Basketball court
Tags
Property features AI
Exterior
- Parking: Carport
- Utilities: Sewer service
- Home design: Manufactured home zoning (MH); Leased space
- Construction: Slab foundation; Composition roof; Exterior finished with other material (see remarks)
- Exterior features: Covered patio; Community pool; Cul-de-sac location
Interior
- Kitchen: Range/Oven; Microwave
- Bathrooms: 2 full bathrooms
- Interior features: Formal living room; Great room; Range/Oven; Microwave
Neighborhood map
What this means for you Summary
Snapshot
- This is a 2-bed/2.0-bath manufactured listed at $120k.
Deal economics
- At list price, monthly cash flow is $584 ($7k/yr) — positive.
- The deal already cash-flows at list — no discount required.
- Meets the 1% rule at list price ($2k rent vs $120k).
- Recommended offer: $116k (3.0% below list) — sets the bar for market timing.
- Cap rate 12.1% vs local median 4.4% in East Niles — top-decile yield for the area; either an underpriced asset or a hidden risk that comps aren't pricing in. Stress-test before assuming the spread holds.
Location & tenants
- Location reads: area grade C — affects rentability + tenant quality, not the cash-flow math above.
- Kern High (urban): math 21% / reading 51% proficiency, ranked #860 of 1,400 in CA (top 61%) — families likely to look elsewhere, expect single-tenant / working-renter base with shorter leases.
- Market conditions: Rents rising (+2.2%/yr); 387 active listings in the ZIP; 10 comparable units currently listed for rent nearby; rentals at typical pace (median 14d on market — plan ~3-4 weeks tenant-placement turnaround); 3,244 units permitted in Kern County in 2024 (73 in 5+ unit buildings).
Forward outlook
- Local home prices are declining (-3.0%/yr); year-one equity from $830 of loan paydown is wiped out by about $4k of value loss. Plan a longer hold.
- Kern County population projected at +17% by 2050 — long-run rental-demand tailwind backs the buy-and-hold thesis.
- At projected returns (-3.0% appreciation + 2.2% rent growth), your $34k cash investment doubles in ~7 years — after that, you're playing with house money.
Negotiation context
- It's been on market 49 days — a 3% lower offer ($116k) is reasonable based on typical stale-listing flexibility.
- 4 sale attempts since 19y ago with the ask held roughly flat each time — persistent listings suggest the price (not the market) is what's stuck; bring a comps-based counter.
- Current owner paid $44k; list at $120k implies a 170% gain — meaningful room to come down on a strong offer.
Risks & watch-outs
- Climate carrying-cost: major wildfire risk; extreme-heat days projected 6→16/yr by 2055 (HVAC capex compounding) — expect insurance premiums to compound above CPI over the hold.
Questions for the listing agent
- It's been on market 49 days. Have you received any prior offers? Is the seller open to a 3% concession, seller financing, or rate buy-down credit?
- Is there a deadline driving the sale (1031 exchange, divorce, estate, relocation)? That informs how much negotiation room exists.
- What's the average days-on-market for RENTAL listings here right now (not sales)? A rising rental-DOM trend means longer vacancies and softer asking-rent achievability than the comps imply.
- What's the recent tenant-quality profile in this submarket — average credit score on applications, eviction rate, late-payment / NSF rate, and stable-employment percentage? A property-management company in the area should have these aggregated.
- How much new for-sale + rental construction is in the pipeline within 1–3 miles? Heavy new supply typically softens prices + rents 12–24 months out; constrained supply supports both.
Investment metrics
- 1% rule
- 1.36% ✓
- Cap rate
- 12.13%
- Cash-on-cash
- 20.85%
- DSCR
- 1.93
- GRM
- 6.1
CMA / ARV
- ARV (median comp)
- $98,521
- List price
- $120,000
- Delta
- 21.80%
- Verdict
- OVERPRICED
- Comps
- 20 within 1.0 mi
Show comp detail 12 sales within ~0.75 mi
| Address | Dist | Beds/Ba | Sqft | Sold | Price | $/sf | Match |
|---|---|---|---|---|---|---|---|
| 8536 Kern Canyon Rd #146 | 0.00mi | 2/2.0 | 1,248 (0%) | 8mo | $85,000 | $68 | 94 |
| 8300 Kern Canyon Rd #93 | 0.19mi | 2/2.0 | 1,248 (0%) | 2mo | $68,000 | $54 | 90 |
| 8536 Kern Canyon Rd #44 | 0.00mi | 2/2.0 | 1,344 (+8%) | 6mo | $63,000 | $47 | 82 |
| 8904 Eastwind Cir | 0.28mi | 2/2.0 | 1,248 (0%) | 6mo | $285,000 | $228 | 82 |
| 8536 Kern Canyon Rd #100 | 0.00mi | 2/2.0 | 1,344 (+8%) | 8mo | $105,000 | $78 | 80 |
| 8536 Kern Canyon Rd #236 | 0.00mi | 2/2.0 | 1,344 (+8%) | 9mo | $58,000 | $43 | 79 |
| 8500 Kern Canyon Rd #139 | 0.18mi | 2/2.0 | 1,344 (+8%) | 3mo | $74,000 | $55 | 76 |
| 9220 Eastwind Cir | 0.24mi | 2/2.0 | 1,196 (-4%) | 9mo | $110,000 | $92 | 75 |
| 8300 Kern Canyon Rd #150 | 0.19mi | 3/2.0 (+1) | 1,344 (+8%) | 1mo | $93,000 | $69 | 72 |
| 8536 Kern Canyon Rd #136 | 0.00mi | 2/2.0 | 1,430 (+15%) | 8mo | $125,000 | $87 | 69 |
| 9305 Eastwind Cir | 0.25mi | 3/2.0 (+1) | 1,344 (+8%) | 6mo | $250,000 | $186 | 65 |
| 9108 Eastwind Cir | 0.31mi | 2/2.0 | 1,404 (+12%) | 7mo | $245,000 | $175 | 59 |
Match score weights: distance 35% · size 25% · config 20% · recency 20%. Top-matched comps best support the ARV.
Projected returns pro-forma
-3.0% appreciation · 2.24% rent growth · sell at horizon
- IRR
- 12.4%
- Equity multiple
- 1.49×
- Total profit
- $16,440
- Equity at exit
- $17,892
- IRR
- 20.8%
- Equity multiple
- 2.70×
- Total profit
- $56,966
- Equity at exit
- $10,375
Cash invested: $33,600 (down + closing). Projections, not guarantees.
Landlord ↔ Tenant lean methodology
- Overall (STATE)
- 18 Strongly Tenant-Friendly
- State California
- 18 Strongly Tenant-Friendly · D+13
- County
- — inherits STATE
- City
- — inherits STATE
ZIP-level market 93306
- Rents YoY
- 2.2%
- Active inventory
- 387
- Price-to-rent
- 6.1×
Monthly cashflow live
- Estimated rent
- $1,637 high interval (Pro) →
- Mortgage (P&I)
- −$629
- Tax from tax record
- −$30 /mo · $361/yr
- Insurance
- −$50
- HOA
- −$0
- Vacancy / Maint / Mgmt
- −$344
- Net cashflow
- $584
Break-even live
UW: 25.0% down · 7.5% · 30yr · 1.5% tax · 5.0% vac · 8.0% maint · 8.0% mgmt
Financing live
Cash to close
- Down payment
- $30,000
- Closing costs
- $3,600
- Reserves months
- —
- Total cash needed
- —
Loan-product check · same deal, 3 products live
Conventional
25% down · 7.5% · 30yr
- Down + closing
- —
- Monthly P&I
- —
- Monthly cashflow
- —
- DSCR
- —
- Eligible?
- —
Personal DTI + credit; lowest rate.
DSCR
20% down · 8.5% · 30yr
- Down + closing
- —
- Monthly P&I
- —
- Monthly cashflow
- —
- DSCR
- —
- Eligible?
- —
No personal income docs; deal must DSCR.
Hard money
10% down · 12.0% · 12mo
- Down + closing
- —
- Monthly P&I
- —
- Monthly cashflow
- —
- DSCR
- —
- Eligible?
- —
Short-term bridge; refi at stabilization.
Rent comps 10 comps
| Address | Beds | Baths | Sqft | Rent | $/sqft | DOM | Units | Dist |
|---|---|---|---|---|---|---|---|---|
| 3217 Fortier St Unit B Bakersfield, CA | 3.0 | 2.0 | 1072 | $1,650 | $1.54 | 2d | 1 | 0.39mi |
| 600 Morning Dr Unit 661-363-6434 Bakersfield, CA | 2.0 | 1.0 | 884 | $1,005 | $1.14 | 2d | 1 | 0.98mi |
| 600 Morning Dr Unit 661-363-6434 Bakersfield, CA | 3.0 | 1.0 | 1054 | $1,067 | $1.01 | 43d | 1 | 0.98mi |
| 7000 College Ave Bakersfield, CA | 2.0 | 1.0 | 849 | $1,480 | $1.74 | 19d | 1 | 0.99mi |
| 7000 College Ave Unit 035 Bakersfield, CA | 2.0 | 1.0 | 849 | $1,525 | $1.80 | 14d | 1 | 1.00mi |
| 7000 College Ave Apt 168 Bakersfield, CA | 2.0 | 2.0 | 957 | $1,655 | $1.73 | 19d | 1 | 1.00mi |
| 8817 Butternut Ave Bakersfield, CA | 3.0 | 2.0 | 1383 | $2,200 | $1.59 | 2d | 1 | 1.16mi |
| 9802 Krista Vineyard Way Bakersfield, CA | 3.0 | 2.0 | 1300 | $2,195 | $1.69 | 2d | 1 | 1.17mi |
| 6900 Valleyview Dr Unit 152 Bakersfield, CA | 2.0 | 2.0 | 1040 | $1,610 | $1.55 | 2d | 1 | 1.40mi |
| 6900 Valleyview Dr Apt 127 Bakersfield, CA | 2.0 | 1.5 | 975 | $1,535 | $1.57 | 43d | 1 | 1.40mi |
Listing history 23 events
-
2026-06-18days on market $120,000 Active 49 DOM
-
2026-06-17days on market $120,000 Active 48 DOM
-
2026-06-16days on market $120,000 Active 47 DOM
-
2026-06-15days on market $120,000 Active 46 DOM
-
2026-06-14days on market $120,000 Active 44 DOM
-
2026-06-10days on market $120,000 Active 41 DOM
-
2026-06-09days on market $120,000 Active 40 DOM
-
2026-06-08days on market $120,000 Active 39 DOM
-
2026-06-07days on market $120,000 Active 38 DOM
-
2026-06-05days on market $120,000 Active 35 DOM
-
2026-06-03days on market $120,000 Active 34 DOM
-
2026-06-03days on market $120,000 Active 33 DOM
-
2026-06-01days on market $120,000 Active 32 DOM
-
2026-05-31days on market $120,000 Active 31 DOM
-
2026-04-30$120,000 Active 559-char remark
-
2025-12-03$120,000 Active
-
2025-07-11price $120,000
-
2025-04-30$125,000 Active
-
2018-03-14price $47,900
-
2007-12-05soldstatus $44,500
-
2007-10-23historical
-
2007-10-23price $49,900
-
2007-04-03$44,500
ⓘ Source: listings_history table (triggers on properties + properties_extension) + one-shot
backfill from property_details.listing_events for pre-trigger history.
Tax reassessment forecast CA · Resets to sale price
- Current annual tax
- $361 · $30/mo
- Projected year-2 tax
- $912 · $76/mo
- Expected delta
- +$551/yr (+$46/mo · 152.8%)
ⓘ Screening estimate from a state-policy table — verify with the county assessor before closing.
Climate risk First Street
- Flood 1/10 Low FEMA zone X (unshaded) · 0% chance over 30 yrs
- Wildfire 7/10 Severe
- Heat 8/10 Severe 6 d/yr ≥105°F today · 16 d/yr by 30 yrs out
- Wind 1/10 Low
- Air quality 10/10 Extreme 34 unhealthy d/yr today · 40 by 30 yrs out
Nearby sold comps map
Loading sold comps map…
Walkable amenities ~0.75 mi
Loading nearby amenities…
Taxation est. · year 1
- Rental income
- $19,641
- − Mortgage interest
- −$6,722
- − Property taxes
- −$361
- − Insurance
- −$600
- − Repairs & maintenance
- −$1,571
- − Management
- −$1,571
- − Depreciation
- −$3,491
- Taxable income
- $5,325
- Est. tax owed @ 24.0%
- −$1,278
- After-tax cash flow
- $5,726/yr
For passive investors: Depreciation is non-cash, so a rental often shows a tax loss while cash-flowing — sheltering income. Rental losses are passive: they offset passive income freely, and up to $25,000/yr can offset ordinary (W-2) income if you actively participate and your MAGI is under $100k (phasing out to $0 by $150k); unused losses carry forward. On sale, claimed depreciation is recaptured at up to 25%, and gains may owe capital-gains tax (a 1031 exchange can defer both). Figures are a year-1 estimate at your 24.0% rate — not tax advice; consult a CPA.
Schools (NCES district)
- District
- Kern High
- NCES district ID
- 0619540
- Math proficiency
- 21% ▬ 0.00%
- Reading proficiency
- 51% ▲ 2.00%
- Median HH income
- $49,686
- Composite
- 33.68/100
- National rank
- #10443
- State rank
- #860 of 1400 in CA
Livability — East Niles
No livability data for this city. (Only ~50 U.S. cities are tracked.)
Census & demographics
- Census place
- East Niles, CA
- County
- Kern County · 710,371 people
- Metro
- Bakersfield, CA
- Population (ZIP)
- 74,116
- Household income
- $69,805
- Rent vs Own
- Severe rent burden
- 2871.0
Population outlook (Kern County) Hauer SSP2
- Today (2025)
- 947,286 people
- By 2030
- 978,984 · +3.3%
- By 2040
- 1,045,018 · +10.3%
- By 2050
- 1,105,232 · +16.7%
- By 2075
- 1,229,538 · +29.8%
- By 2100
- 1,238,059 · +30.7%
Race, ethnicity, and origin ACS 2023
- Neighborhood character
- Predominantly Hispanic (67%)
- Race & ethnicity
- Hispanic / Latino 67% White 23% Two or more races 20% Black 3% Asian 2% Native American 1%
- Hispanic origin (detail)
- Mexican 63%
- Common ancestry
- Italian 2% Slovak 1% Russian 1%
- Foreign-born
- 19% · Canada
- Languages at home
- 50% English-only · Spanish 46% Other Asian/Pacific 1% Arabic 1%
Political lean MEDSL · Kern
- 2024 margin
- Strong R (+21.1) · D 38.2% · R 59.3% · Other 2.5%
- 2008→2024 swing
- -3.3pp toward R · 2008: -17.8pp · 2024: -21.1pp
- All cycles
- 2024: R+21.1 2020: R+10.2 2016: R+15.0 2012: R+20.9 2008: R+17.8
Not yet ingested
- Civics
- —
Market trends
- HPI YoY
- ▼ -323.02%
- Current HPI
- 358.5434
- Rent YoY
- ▲ 2.24%
- Metro
- Bakersfield, CA
- State GDP YoY
- ▲ 3.21%
- F500 in state
- 116
Industry mix (Fortune 500 HQ in CA)
| Industry | F500 HQs | Revenue |
|---|---|---|
| Technology | 27 | $1,492B |
|
||
| Financial Services | 3 | $174B |
|
||
| Retail | 3 | $44B |
|
||
| Insurance | 3 | $26B |
|
||
| Media / Entertainment | 2 | $115B |
|
||
| Pharmaceuticals / Biotech | 2 | $62B |
|
||
Price history
+169.7% since first listed9 events — show timeline
- 2026-04-30 Listed $120,000 GEMLS
- 2025-12-03 Listed $120,000 GEMLS
- 2025-07-11 Price Changed $120,000 GEMLS
- 2025-04-30 Listed $125,000 GEMLS
- 2018-03-14 Price Changed $47,900 GEMLS
- 2007-12-05 Sold (MLS) $44,500 GEMLS
- 2007-10-23 Price Changed $49,900 GEMLS
- 2007-10-23 Delisted — GEMLS
- 2007-04-03 Listed $44,500 GEMLS
Property tax history
+2.4%/yrLatest (2025): $361 · +5.3% YoY. Source: county tax records.
Cash-flow waterfall
monthlySold comps — $/sqft
last 12 mo · ≤1 miLoading sold comps…