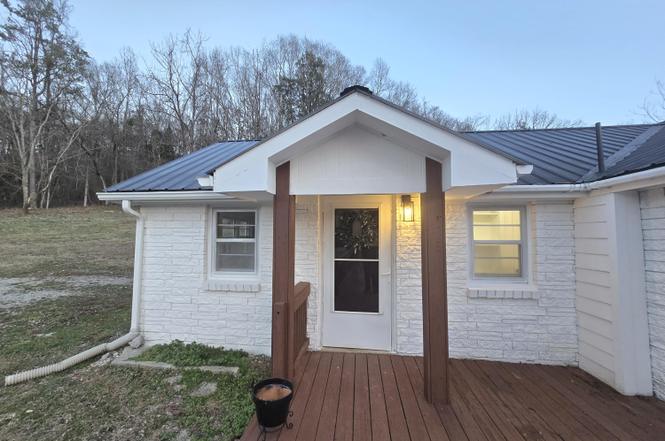
13711 Sherwood Rd · Sherwood, TN
Flood risk 1/10 · Minimal
- FEMA flood zone
- X (unshaded)
- Chance of flooding over 30 yrs
- 0.0%
- Est. flood insurance / yr
- $473 – $860
Fire risk 3/10 · Minor
- Est. fire insurance / yr
- $949 – $1,763
Heat risk 6/10 · Moderate
- Hot days now (above 105°F)
- 7 days/yr
- Hot days in 30 yrs
- 20 days/yr
Wind risk 4/10 · Minor
- Chance of severe wind over 30 yrs
- 11.0%
Air-quality risk 3/10 · Minor
- Unhealthy air days now
- 2 days/yr
- Unhealthy air days in 30 yrs
- 2 days/yr
Risk factors via First Street. Map © Google.
Why this score? — see what drove the D grade
The composite is a weighted blend of 9 inputs, each scored 0–100. Each bar is that input's sub-score; the figure is the points it added to the 100-point composite (weight × sub-score).
- Cash flow +12.2/30.0
- ARV discount +7.5/15.0
- Appreciation +6.1/10.0
- DSCR +3.6/10.0
- Rent growth +2.5/5.0
- Livability +2.5/5.0
- Condition / age +2.5/5.0
- 1% rule +2.3/10.0
- Schools +1.7/10.0
$150,000
🖨 Deal sheet 📄 Offer letter ✓ Due diligence
Listing remarks
Welcome to peaceful country living at 13711 Sherwood Road in Sherwood, Tennessee! Nestled on a quiet Tennessee hillside, this charming two-bedroom farmhouse offers the perfect escape from city life. Enjoy relaxing mornings and evenings on the large front deck, ideal for entertaining or simply taking in the scenic surroundings. Inside, the home features two spacious bedrooms, new kitchen cabinets and countertops, and new flooring throughout, giving it a fresh, updated feel while still maintaining its farmhouse charm. The bathroom is beautifully finished with a tiled walk-in shower, and the home offers plenty of storage space for everyday living. An outbuilding adds extra flexibility for s
Key facts
- Tiled walk-in shower
- Outbuilding
- New kitchen cabinets
Tags
Property features AI
Exterior
- Parking: Concrete and gravel driveway
- Utilities: Well water; Septic tank; Electricity connected; Water service connected; Publicly maintained asphalt county road frontage
- Home design: Single-family residence; One story
- Construction: Brick and vinyl siding exterior; Block foundation; Built with traditional construction materials
- Exterior features: Deck; Storage structure on property; Back yard; Cleared lot
Interior
- Kitchen: Eat-in kitchen
- Flooring: Vinyl flooring
- Bathrooms: 1 full bathroom
- Heating & cooling: Propane heating; Window air conditioning units; Ceiling fans
- Interior features: Ceiling fans; Eat-in kitchen; Recessed lighting; Walk-in closet(s)
- Laundry & utility: Dedicated laundry room
Neighborhood map
What this means for you Summary
Snapshot
- This is a 2-bed/1.0-bath single-family listed at $150k.
Deal economics
- At list price, monthly cash flow is $-29 ($-347/yr) — negative.
- To cash-flow at today's rent, offer at most $145k (3.4% below list).
- To meet the 1% rule (rent ≥ 1% of price), the offer needs to be $110k (26.5% below list).
- Recommended offer: $110k (26.5% below list) — sets the bar for 1% rule.
Location & tenants
- Location reads: area grade D — affects rentability + tenant quality, not the cash-flow math above.
- Franklin County (town): math 18% / reading 22% proficiency, ranked #111 of 139 in TN (top 80%) — low school quality limits family demand, transient renter base, plan for 1-2y turnover.
- Zoned schools: Cowan Elementary (math 32% / reading 17%, grade F, #546 of 952 statewide, top 61%, 279 students, 0% FRL); South Middle School (math 11% / reading 13%, grade F, #242 of 333 statewide, top 74%, 292 students, 0% FRL); Franklin Co High School (math 5% / reading 22%, grade F, #255 of 332 statewide, top 77%, 1,180 students, 0% FRL) — zoned schools average 0% FRL vs 48% district-wide (48 pts lower); this property's tenant base skews higher-income than the district average.
- Market conditions: 3 active listings in the ZIP; 422 units permitted in Franklin County in 2024 (5 in 5+ unit buildings).
Forward outlook
- In year one you build about $4k of equity ($1k loan paydown + $3k appreciation (2.3% local appreciation)).
- Franklin County population projected at +6% by 2050 — modest demand growth; plan on rents tracking national, not racing it.
- At projected returns (2.3% appreciation + 3.0% rent growth), your $42k cash investment doubles in ~8 years — after that, you're playing with house money.
- By year 8, paydown + projected appreciation supports a ~$33k cash-out refi (75% LTV) — recoverable capital for the next deal without selling this one.
Negotiation context
- It's been on market 118 days — a 9% lower offer ($136k) is reasonable based on typical stale-listing flexibility.
- 2 sale attempts; this cycle's ask has dropped $25k (14%) from the opening price — seller is motivated, your offer sets the floor, not the list.
- Current owner paid $25k; list at $150k implies a 500% gain — meaningful room to come down on a strong offer.
Risks & watch-outs
- Watch-outs: built in 1948 — expect roof / HVAC / electrical / plumbing capex.
- Climate carrying-cost: extreme-heat days projected 7→20/yr by 2055 (HVAC capex compounding) — expect insurance premiums to compound above CPI over the hold.
Questions for the listing agent
- What do current leases actually rent for vs. the listed asking? Can we see a recent rent roll and the last 12 months of T-12 income?
- It's been on market 118 days. Have you received any prior offers? Is the seller open to a 27% concession, seller financing, or rate buy-down credit?
- Built in 1948 — when were the roof, HVAC, electrical panel, plumbing, and water heater last replaced?
- Why hasn't it sold? Are there any deal-killer items the seller is aware of (foundation, flood, title, zoning, code violations)?
- Is there a deadline driving the sale (1031 exchange, divorce, estate, relocation)? That informs how much negotiation room exists.
- The area grade is low — what's the realistic commute time and amenity access for the typical tenant pool here? Any planned neighborhood developments (good or bad) we should know about?
- What's the average days-on-market for RENTAL listings here right now (not sales)? A rising rental-DOM trend means longer vacancies and softer asking-rent achievability than the comps imply.
- What's the recent tenant-quality profile in this submarket — average credit score on applications, eviction rate, late-payment / NSF rate, and stable-employment percentage? A property-management company in the area should have these aggregated.
- How much new for-sale + rental construction is in the pipeline within 1–3 miles? Heavy new supply typically softens prices + rents 12–24 months out; constrained supply supports both.
Investment metrics
- 1% rule
- 0.73% ✗
- Cap rate
- 6.06%
- Cash-on-cash
- -0.83%
- DSCR
- 0.96
- GRM
- 11.3
CMA / ARV
No comps found within radius.
Projected returns pro-forma
2.27% appreciation · 3.0% rent growth · sell at horizon
- IRR
- 4.5%
- Equity multiple
- 1.25×
- Total profit
- $10,419
- Equity at exit
- $61,338
- IRR
- 8.0%
- Equity multiple
- 2.12×
- Total profit
- $46,962
- Equity at exit
- $90,030
Cash invested: $42,000 (down + closing). Projections, not guarantees.
Landlord ↔ Tenant lean methodology
- Overall (STATE)
- 87 Strongly Landlord-Friendly
- State Tennessee
- 87 Strongly Landlord-Friendly · R+13
- County
- — inherits STATE
- City
- — inherits STATE
ZIP-level market 37376
- Home prices YoY
- 2.3%
- Active inventory
- 3
- Price-to-rent
- 11.3×
Monthly cashflow live
- Estimated rent
- $1,102 medium interval (Pro) →
- Mortgage (P&I)
- −$787
- Tax from tax record
- −$50 /mo · $606/yr
- Insurance
- −$62
- HOA
- −$0
- Vacancy / Maint / Mgmt
- −$231
- Net cashflow
- $-29
Break-even live
UW: 25.0% down · 7.5% · 30yr · 1.5% tax · 5.0% vac · 8.0% maint · 8.0% mgmt
Financing live
Cash to close
- Down payment
- $37,500
- Closing costs
- $4,500
- Reserves months
- —
- Total cash needed
- —
Loan-product check · same deal, 3 products live
Conventional
25% down · 7.5% · 30yr
- Down + closing
- —
- Monthly P&I
- —
- Monthly cashflow
- —
- DSCR
- —
- Eligible?
- —
Personal DTI + credit; lowest rate.
DSCR
20% down · 8.5% · 30yr
- Down + closing
- —
- Monthly P&I
- —
- Monthly cashflow
- —
- DSCR
- —
- Eligible?
- —
No personal income docs; deal must DSCR.
Hard money
10% down · 12.0% · 12mo
- Down + closing
- —
- Monthly P&I
- —
- Monthly cashflow
- —
- DSCR
- —
- Eligible?
- —
Short-term bridge; refi at stabilization.
Listing history 14 events
-
2026-06-09status $150,000 Pending 118 DOM
-
2026-06-08days on market $150,000 Active 118 DOM
-
2026-06-07days on market $150,000 Active 117 DOM
-
2026-06-05days on market $150,000 Active 114 DOM
-
2026-06-03days on market $150,000 Active 113 DOM
-
2026-06-02pricedays on market $150,000 Active 112 DOM
-
2026-06-01days on market $165,000 Active 111 DOM
-
2026-05-31days on market $165,000 Active 110 DOM
-
2026-05-30days on market $165,000 Active 109 DOM
-
2026-05-12status Active
-
2026-04-23status Pending
-
2026-03-25price $165,000
-
2026-01-22$175,000 Active
-
1998-02-15soldstatus $25,000
ⓘ Source: listings_history table (triggers on properties + properties_extension) + one-shot
backfill from property_details.listing_events for pre-trigger history.
Tax reassessment forecast TN · Resets to sale price
- Current annual tax
- $606 · $50/mo
- Projected year-2 tax
- $1,065 · $89/mo
- Expected delta
- +$459/yr (+$38/mo · 75.7%)
ⓘ Screening estimate from a state-policy table — verify with the county assessor before closing.
Climate risk First Street
- Flood 1/10 Low FEMA zone X (unshaded) · 0% chance over 30 yrs
- Wildfire 3/10 Moderate
- Heat 6/10 Major 7 d/yr ≥105°F today · 20 d/yr by 30 yrs out
- Wind 4/10 Moderate 11% chance of damaging wind over 30 yrs
- Air quality 3/10 Moderate 2 unhealthy d/yr today · 2 by 30 yrs out
Nearby sold comps map
Loading sold comps map…
Walkable amenities ~0.75 mi
Loading nearby amenities…
Taxation est. · year 1
- Rental income
- $13,226
- − Mortgage interest
- −$8,402
- − Property taxes
- −$606
- − Insurance
- −$750
- − Repairs & maintenance
- −$1,058
- − Management
- −$1,058
- − Depreciation
- −$4,364
- Taxable loss
- −$3,012
- Est. tax savings @ 24.0%
- +$723
- After-tax cash flow
- $376/yr
For passive investors: Depreciation is non-cash, so a rental often shows a tax loss while cash-flowing — sheltering income. Rental losses are passive: they offset passive income freely, and up to $25,000/yr can offset ordinary (W-2) income if you actively participate and your MAGI is under $100k (phasing out to $0 by $150k); unused losses carry forward. On sale, claimed depreciation is recaptured at up to 25%, and gains may owe capital-gains tax (a 1031 exchange can defer both). Figures are a year-1 estimate at your 24.0% rate — not tax advice; consult a CPA.
Schools (NCES district)
- District
- Franklin County
- NCES district ID
- 4701290
- Math proficiency
- 18% ▼ -9.00%
- Reading proficiency
- 22% ▼ -8.00%
- Median HH income
- $43,108
- Composite
- 17.24/100
- National rank
- #9094
- State rank
- #111 of 139 in TN
Livability — Sherwood
No livability data for this city. (Only ~50 U.S. cities are tracked.)
Census & demographics
- Population (ZIP)
- 342
Population outlook (Franklin County) Hauer SSP2
- Today (2025)
- 42,858 people
- By 2030
- 43,540 · +1.6%
- By 2040
- 44,623 · +4.1%
- By 2050
- 45,523 · +6.2%
- By 2075
- 48,954 · +14.2%
- By 2100
- 50,170 · +17.1%
Race, ethnicity, and origin ACS 2023
- Neighborhood character
- Predominantly White (89%)
- Race & ethnicity
- White 89%
- Common ancestry
- Serbian 6%
Political lean MEDSL · Franklin
- 2024 margin
- Solid R (+53.2) · D 23.0% · R 76.1%
- 2008→2024 swing
- -30.6pp toward R · 2008: -22.5pp · 2024: -53.2pp
- All cycles
- 2024: R+53.2 2020: R+47.7 2016: R+43.7 2012: R+28.9 2008: R+22.5
Not yet ingested
- Civics
- —
Market trends
- HPI YoY
- ▲ 2.27%
- Current HPI
- 102.6354
- Rent YoY
- —
- Metro
- —
- State GDP YoY
- ▲ 2.78%
- F500 in state
- 22
Industry mix (Fortune 500 HQ in TN)
| Industry | F500 HQs | Revenue |
|---|---|---|
| Healthcare | 3 | $91B |
|
||
| Retail | 3 | $72B |
|
||
| Transportation / Logistics | 1 | $88B |
|
||
| Paper / Packaging | 1 | $19B |
|
||
| Insurance | 1 | $13B |
|
||
| Energy | 1 | $12B |
|
||
Price history
+560.0% since first listed5 events — show timeline
- 2026-05-12 Relisted — GCAR
- 2026-04-23 Pending — GCAR
- 2026-03-25 Price Changed $165,000 GCAR
- 2026-01-22 Listed $175,000 GCAR
- 1998-02-15 Sold (Public Records) $25,000 Public Records
Property tax history
+2.8%/yrLatest (2025): $606 · +17.0% YoY. Source: county tax records.
Cash-flow waterfall
monthlySold comps — $/sqft
last 12 mo · ≤1 miLoading sold comps…