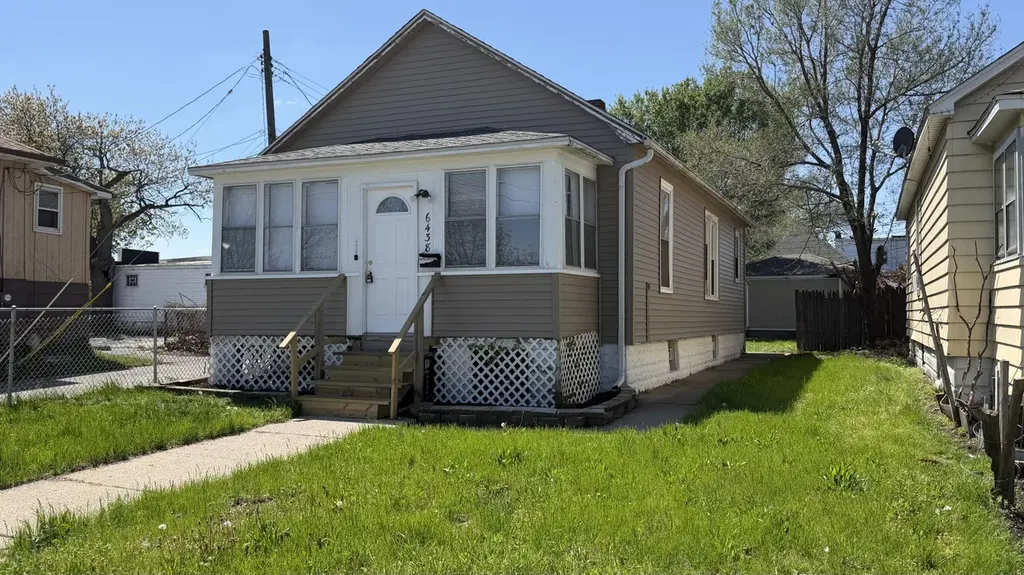
6438 Jefferson Ave · Hammond, IN
Flood risk 1/10 · Minimal
- FEMA flood zone
- X (unshaded)
- Chance of flooding over 30 yrs
- 0.0%
- Est. flood insurance / yr
- $473 – $860
Fire risk 1/10 · Minimal
- Est. fire insurance / yr
- $717 – $1,331
Heat risk 3/10 · Minor
- Hot days now (above 102°F)
- 7 days/yr
- Hot days in 30 yrs
- 15 days/yr
Wind risk 2/10 · Minimal
- Chance of severe wind over 30 yrs
- 1.0%
Air-quality risk 4/10 · Minor
- Unhealthy air days now
- 5 days/yr
- Unhealthy air days in 30 yrs
- 6 days/yr
Risk factors via First Street. Map © Google.
Why this score? — see what drove the C grade
The composite is a weighted blend of 9 inputs, each scored 0–100. Each bar is that input's sub-score; the figure is the points it added to the 100-point composite (weight × sub-score).
- Cash flow +20.4/30.0
- ARV discount +14.1/15.0
- DSCR +6.5/10.0
- 1% rule +4.7/10.0
- Rent growth +3.9/5.0
- Livability +3.5/5.0
- Condition / age +2.5/5.0
- Schools +1.1/10.0
- Appreciation +0.0/10.0
$139,900
🖨 Deal sheet 📄 Offer letter ✓ Due diligence
Listing remarks MLS
Property Sold as Is. Seller Will Do No Repairs Needs Work. Great For The Handyman. Has Possibilities.
Key facts
- New siding
- New roof
- Enclosed front porch
Tags
Property features AI
Exterior
- Parking: Detached or attached garage with 1 parking space
- Utilities: Public water; Public sewer; 100 Amp electrical service
- Home design: One-story property; Built in 1919
- Construction: Has basement (unfinished)
- Exterior features: Neighborhood view; Public lot/assessor lot information
Interior
- Kitchen: Gas water heater
- Bedrooms: Primary bedroom; Second bedroom
- Flooring: Laminate flooring; Vinyl flooring
- Bathrooms: 1 full bathroom
- Heating & cooling: Forced air heating (natural gas); Ceiling fan cooling
- Interior features: Ceiling fans; Open floor plan; Unfinished basement
- Laundry & utility: Washer hookup; Gas dryer hookup
Neighborhood map
What this means for you Summary
Snapshot
- This is a 2-bed/1.0-bath single-family listed at $140k.
Deal economics
- At list price, monthly cash flow is $182 ($2k/yr) — positive.
- The deal already cash-flows at list — no discount required.
- To meet the 1% rule (rent ≥ 1% of price), the offer needs to be $136k (2.6% below list).
- Recommended offer: $136k (2.6% below list) — sets the bar for 1% rule.
- Cap rate 7.9% vs local median 5.8% in Hammond — top-decile yield for the area; either an underpriced asset or a hidden risk that comps aren't pricing in. Stress-test before assuming the spread holds.
Location & tenants
- Location reads 70/100 on livability (#143 in IN) — a middle-class / working-renter tenant base. Strengths: cost of living A+, housing A+, commute A; Watch: health & safety D+, employment D, schools F.
- School City Of Hammond (suburban): math 8% / reading 18% proficiency, ranked #289 of 301 in IN (top 96%) — low school quality limits family demand, transient renter base, plan for 1-2y turnover; 74% free/reduced lunch — lower-income household profile, screen leases tightly.
- Market conditions: Rents rising fast (+5.5%/yr); 63 active listings in the ZIP; 18 comparable units currently listed for rent nearby; rentals at typical pace (median 17d on market — plan ~3-4 weeks tenant-placement turnaround); 1,642 units permitted in Lake County in 2024 (14 in 5+ unit buildings).
Forward outlook
- Local home prices are declining (-3.0%/yr); year-one equity from $967 of loan paydown is wiped out by about $4k of value loss. Plan a longer hold.
- Lake County population projected to shrink 7% by 2050 — rents likely to lag national; underwrite the cash flow, not the appreciation.
Negotiation context
- Only 4 days on market — expect competitive offers; lowballing is unlikely to land.
- 5 sale attempts since 29y ago with the ask held roughly flat each time — persistent listings suggest the price (not the market) is what's stuck; bring a comps-based counter.
- Current owner paid $19k; list at $140k implies a 636% gain — meaningful room to come down on a strong offer.
Risks & watch-outs
- Watch-outs: built in 1919 — expect roof / HVAC / electrical / plumbing capex.
Questions for the listing agent
- Built in 1919 — when were the roof, HVAC, electrical panel, plumbing, and water heater last replaced?
- Is there a deadline driving the sale (1031 exchange, divorce, estate, relocation)? That informs how much negotiation room exists.
- Schools are F-rated, which usually means shorter tenancies and higher turnover. Who's the typical renter profile here, and what's been the actual vacancy rate?
- Crime grade is F in this area — have there been break-ins, vandalism, or insurance claims at this property in the last 3 years? What carrier currently insures it and at what premium?
- What's the average days-on-market for RENTAL listings here right now (not sales)? A rising rental-DOM trend means longer vacancies and softer asking-rent achievability than the comps imply.
- What's the recent tenant-quality profile in this submarket — average credit score on applications, eviction rate, late-payment / NSF rate, and stable-employment percentage? A property-management company in the area should have these aggregated.
- How much new for-sale + rental construction is in the pipeline within 1–3 miles? Heavy new supply typically softens prices + rents 12–24 months out; constrained supply supports both.
Investment metrics
- 1% rule
- 0.97% ✗
- Cap rate
- 7.86%
- Cash-on-cash
- 5.58%
- DSCR
- 1.25
- GRM
- 8.6
CMA / ARV
- ARV (on-the-fly)
- $163,856
- Comps found
- 12
Show comp detail 12 sales within ~0.75 mi
| Address | Dist | Beds/Ba | Sqft | Sold | Price | $/sf | Match |
|---|---|---|---|---|---|---|---|
| 6412 Euclid Ave | 0.14mi | 2/1.0 | 829 (-1%) | 12mo | $173,000 | $209 | 82 |
| 718 Cherry St | 0.49mi | 2/1.0 | 814 (-3%) | 1mo | $187,000 | $230 | 72 |
| 6636 Van Buren Ave | 0.35mi | 2/1.0 | 912 (+9%) | 2mo | $155,000 | $170 | 67 |
| 515 165th St | 0.26mi | 2/1.0 | 926 (+11%) | 6mo | $110,000 | $119 | 65 |
| 907 Cherry St | 0.49mi | 2/1.0 | 824 (-1%) | 13mo | $77,000 | $93 | 64 |
| 6436 Monroe Ave | 0.13mi | 2/1.0 | 936 (+12%) | 13mo | $183,000 | $196 | 63 |
| 1007 Moss St | 0.35mi | 2/2.0 | 912 (+9%) | 3mo | $175,000 | $192 | 62 |
| 6438 Garfield Ave | 0.37mi | 3/1.0 (+1) | 938 (+12%) | 0mo | $196,500 | $209 | 57 |
| 439 Vine St | 0.35mi | 3/1.0 (+1) | 940 (+12%) | 9mo | $187,000 | $199 | 51 |
| 434 Mulberry St | 0.49mi | 2/1.0 | 764 (-9%) | 18mo | $169,000 | $221 | 48 |
| 823 Spruce St | 0.42mi | 2/1.0 | 744 (-11%) | 20mo | $139,900 | $188 | 46 |
| 1135 Cherry St | 0.67mi | 3/1.0 (+1) | 792 (-5%) | 16mo | $154,000 | $194 | 42 |
Match score weights: distance 35% · size 25% · config 20% · recency 20%. Top-matched comps best support the ARV.
Projected returns pro-forma
-3.0% appreciation · 5.51% rent growth · sell at horizon
- IRR
- -5.1%
- Equity multiple
- 0.81×
- Total profit
- $-7,559
- Equity at exit
- $20,860
- IRR
- 7.2%
- Equity multiple
- 1.60×
- Total profit
- $23,506
- Equity at exit
- $12,096
Cash invested: $39,172 (down + closing). Projections, not guarantees.
Landlord ↔ Tenant lean methodology
- Overall (STATE)
- 90 Strongly Landlord-Friendly
- State Indiana
- 90 Strongly Landlord-Friendly · R+11
- County
- — inherits STATE
- City
- — inherits STATE
ZIP-level market 46324
- Home prices YoY
- -9.6%
- Rents YoY
- 5.5%
- Active inventory
- 63
- Price-to-rent
- 8.6×
Monthly cashflow live
- Estimated rent
- $1,363 high interval (Pro) →
- Mortgage (P&I)
- −$734
- Tax from tax record
- −$102 /mo · $1,227/yr
- Insurance
- −$58
- HOA
- −$0
- Vacancy / Maint / Mgmt
- −$286
- Net cashflow
- $182
Break-even live
UW: 25.0% down · 7.5% · 30yr · 1.5% tax · 5.0% vac · 8.0% maint · 8.0% mgmt
Financing live
Cash to close
- Down payment
- $34,975
- Closing costs
- $4,197
- Reserves months
- —
- Total cash needed
- —
Loan-product check · same deal, 3 products live
Conventional
25% down · 7.5% · 30yr
- Down + closing
- —
- Monthly P&I
- —
- Monthly cashflow
- —
- DSCR
- —
- Eligible?
- —
Personal DTI + credit; lowest rate.
DSCR
20% down · 8.5% · 30yr
- Down + closing
- —
- Monthly P&I
- —
- Monthly cashflow
- —
- DSCR
- —
- Eligible?
- —
No personal income docs; deal must DSCR.
Hard money
10% down · 12.0% · 12mo
- Down + closing
- —
- Monthly P&I
- —
- Monthly cashflow
- —
- DSCR
- —
- Eligible?
- —
Short-term bridge; refi at stabilization.
Rent comps 18 comps
| Address | Beds | Baths | Sqft | Rent | $/sqft | DOM | Units | Dist |
|---|---|---|---|---|---|---|---|---|
| 407 Kenwood St Hammond, IN | 2.0 | 1.0 | 920 | $1,495 | $1.62 | 24d | 1 | 0.48mi |
| 407 Kenwood St Hammond, IN | 2.0 | 1.0 | 920 | $1,495 | $1.62 | 17d | 1 | 0.48mi |
| 230 Wildwood Rd Unit 103 Hammond, IN | 1.0 | 1.0 | 750 | $1,295 | $1.73 | 24d | 1 | 0.62mi |
| 5945 Hyslop Pl Unit 204 Hammond, IN | 1.0 | 1.0 | 700 | $1,195 | $1.71 | 24d | 1 | 0.84mi |
| 5940 Hyslop Pl #226 Hammond, IN | 1.0 | 1.0 | 800 | $950 | $1.19 | 2d | 1 | 0.87mi |
| 5950 Hohman Ave Unit 416 Hammond, IN | 1.0 | 1.0 | 550 | $1,095 | $1.99 | 6d | 1 | 0.91mi |
| 7129 Columbia Ave Unit 1E Hammond, IN | 2.0 | 1.0 | 900 | $1,195 | $1.33 | 11d | 1 | 1.00mi |
| 1338 Wentworth Ave Unit 1338 Calumet City, IL | 2.0 | 1.0 | 800 | $1,430 | $1.79 | 24d | 1 | 1.05mi |
| 1454 Sherman St Hammond, IN | 3.0 | 1.0 | 960 | $1,400 | $1.46 | 4d | 1 | 1.09mi |
| 5 Ruth St Unit 2W Hammond, IN | 2.0 | 1.0 | 900 | $1,250 | $1.39 | 13d | 1 | 1.09mi |
| 3 Ruth St Hammond, IN | 2.0 | 1.0 | 900 | $1,250 | $1.39 | 24d | 1 | 1.09mi |
| 7234 Columbia Ave Hammond, IN | 2.0 | 1.0 | 960 | $1,300 | $1.35 | 24d | 1 | 1.10mi |
| 1539 Wentworth Ave Unit 3W Calumet City, IL | 3.0 | 1.0 | 1100 | $1,700 | $1.55 | 12d | 1 | 1.12mi |
| 1227 Logan St Hammond, IN | 2.0 | 1.0 | 768 | $1,350 | $1.76 | 10d | 1 | 1.32mi |
| 1227 Logan St Hammond, IN | 2.0 | 1.0 | 768 | $1,350 | $1.76 | 15d | 1 | 1.32mi |
| 115 157th St Unit 3 Calumet City, IL | 3.0 | 1.0 | 800 | $1,350 | $1.69 | 24d | 1 | 1.36mi |
| 3649 173rd Ct Lansing, IL | 2.0 | 2.0 | 972 | $1,357 | $1.40 | 24d | 1 | 1.43mi |
| 1344 Michigan St Hammond, IN | 3.0 | 1.0 | 1006 | $1,595 | $1.59 | 15d | 1 | 1.43mi |
Listing history 10 events
-
2026-05-05status Pending
-
2026-05-01$139,900 Active
-
2026-01-08historical $1,150
-
2025-12-31$1,150
-
2022-12-22historical
-
2012-12-26soldstatus $19,000 101-char remark
Show marketing remark (101 chars)
Property Sold as Is. Seller Will Do No Repairs Needs Work. Great For The Handyman. Has Possibilities.
-
2012-08-01$35,000 101-char remark
Show marketing remark (101 chars)
Property Sold as Is. Seller Will Do No Repairs Needs Work. Great For The Handyman. Has Possibilities.
-
2012-07-31historical
-
2012-01-11$35,000
-
1997-05-15$34,900
ⓘ Source: listings_history table (triggers on properties + properties_extension) + one-shot
backfill from property_details.listing_events for pre-trigger history.
Tax reassessment forecast IN · Partial reset (capped growth)
- Current annual tax
- $1,227 · $102/mo
- Projected year-2 tax
- $1,227 · $102/mo
- Expected delta
- $0/yr ($0/mo · 0.0%)
ⓘ Screening estimate from a state-policy table — verify with the county assessor before closing.
Climate risk First Street
- Flood 1/10 Low FEMA zone X (unshaded) · 0% chance over 30 yrs
- Wildfire 1/10 Low
- Heat 3/10 Moderate 7 d/yr ≥102°F today · 15 d/yr by 30 yrs out
- Wind 2/10 Low 100% chance of damaging wind over 30 yrs
- Air quality 4/10 Moderate 5 unhealthy d/yr today · 6 by 30 yrs out
Nearby sold comps map
Loading sold comps map…
Walkable amenities ~0.75 mi
Loading nearby amenities…
Taxation est. · year 1
- Rental income
- $16,351
- − Mortgage interest
- −$7,837
- − Property taxes
- −$1,227
- − Insurance
- −$700
- − Repairs & maintenance
- −$1,308
- − Management
- −$1,308
- − Depreciation
- −$4,070
- Taxable loss
- −$98
- Est. tax savings @ 24.0%
- +$24
- After-tax cash flow
- $2,211/yr
For passive investors: Depreciation is non-cash, so a rental often shows a tax loss while cash-flowing — sheltering income. Rental losses are passive: they offset passive income freely, and up to $25,000/yr can offset ordinary (W-2) income if you actively participate and your MAGI is under $100k (phasing out to $0 by $150k); unused losses carry forward. On sale, claimed depreciation is recaptured at up to 25%, and gains may owe capital-gains tax (a 1031 exchange can defer both). Figures are a year-1 estimate at your 24.0% rate — not tax advice; consult a CPA.
Schools (NCES district)
- District
- School City Of Hammond
- NCES district ID
- 1804320
- Math proficiency
- 8% ▼ -18.00%
- Reading proficiency
- 18% ▼ -15.00%
- Median HH income
- $39,970
- Composite
- 11.11/100
- National rank
- #9730
- State rank
- #289 of 301 in IN
Livability — Hammond
- Score
- 70/100
- State rank
- #143
- US rank
- #7343
Category grades
Schools grade is shown separately in the Schools card above.
Census & demographics
- Census place
- Hammond, IN
- County
- Lake County · 422,878 people
- City population
- 58,809
- Metro
- Chicago-Naperville-Elgin, IL-IN-WI
- Population (ZIP)
- 21,409
- Household income
- $63,052
- Rent vs Own
- Severe rent burden
- 507.0
Population outlook (Lake County) Hauer SSP2
- Today (2025)
- 484,026 people
- By 2030
- 478,091 · -1.2%
- By 2040
- 462,974 · -4.3%
- By 2050
- 449,894 · -7.1%
- By 2075
- 436,169 · -9.9%
- By 2100
- 426,607 · -11.9%
Race, ethnicity, and origin ACS 2023
- Neighborhood character
- Diverse neighborhood (Simpson 0.69)
- Race & ethnicity
- Hispanic / Latino 39% White 34% Black 22% Two or more races 14% Asian 1% Native American 1%
- Hispanic origin (detail)
- Mexican 31% Puerto Rican 5%
- Common ancestry
- Romanian 5% Lithuanian 1% Italian 1%
- Foreign-born
- 10% · Canada
- Languages at home
- 79% English-only · Spanish 20%
Political lean MEDSL · Lake
- 2024 margin
- Lean D (+5.6) · D 52.1% · R 46.5% · Other 1.5%
- 2008→2024 swing
- -28.6pp toward R · 2008: 34.3pp · 2024: 5.6pp
- All cycles
- 2024: D+5.6 2020: D+15.1 2016: D+20.6 2012: D+31.0 2008: D+34.3
Not yet ingested
- Civics
- —
Market trends
- HPI YoY
- ▼ -37.65%
- Current HPI
- 352.8678
- Rent YoY
- ▲ 5.51%
- Metro
- Chicago-Naperville-Elgin, IL-IN-WI
- State GDP YoY
- ▲ 2.90%
- F500 in state
- 18
Industry mix (Fortune 500 HQ in IN)
| Industry | F500 HQs | Revenue |
|---|---|---|
| Industrial Machinery | 2 | $37B |
|
||
| Healthcare | 1 | $177B |
|
||
| Pharmaceuticals | 1 | $45B |
|
||
| Metals / Steel | 1 | $18B |
|
||
| Agriculture | 1 | $17B |
|
||
| Packaging | 1 | $12B |
|
||
Price history
+300.9% since first listed10 events — show timeline
- 2026-05-05 Pending — NIRA MLS as Distributed by MLS Grid
- 2026-05-01 Listed $139,900 NIRA MLS as Distributed by MLS Grid
- 2026-01-08 Rental Removed $1,150 APPFOLIO
- 2025-12-31 Listed for Rent $1,150 APPFOLIO
- 2022-12-22 Rental Removed — RENT.
- 2012-12-26 Sold (MLS) $19,000 NIRA MLS as Distributed by MLS Grid
- 2012-08-01 Listed $35,000 NIRA MLS as Distributed by MLS Grid
- 2012-07-31 Listing Removed — NIRA MLS as Distributed by MLS Grid
- 2012-01-11 Listed $35,000 NIRA MLS as Distributed by MLS Grid
- 1997-05-15 Listed $34,900 NIRA MLS as Distributed by MLS Grid
Property tax history
-5.4%/yrLatest (2024): $1,227 · -10.6% YoY. Source: county tax records.
Cash-flow waterfall
monthlySold comps — $/sqft
last 12 mo · ≤1 miLoading sold comps…