 🏷️ Likely Rental
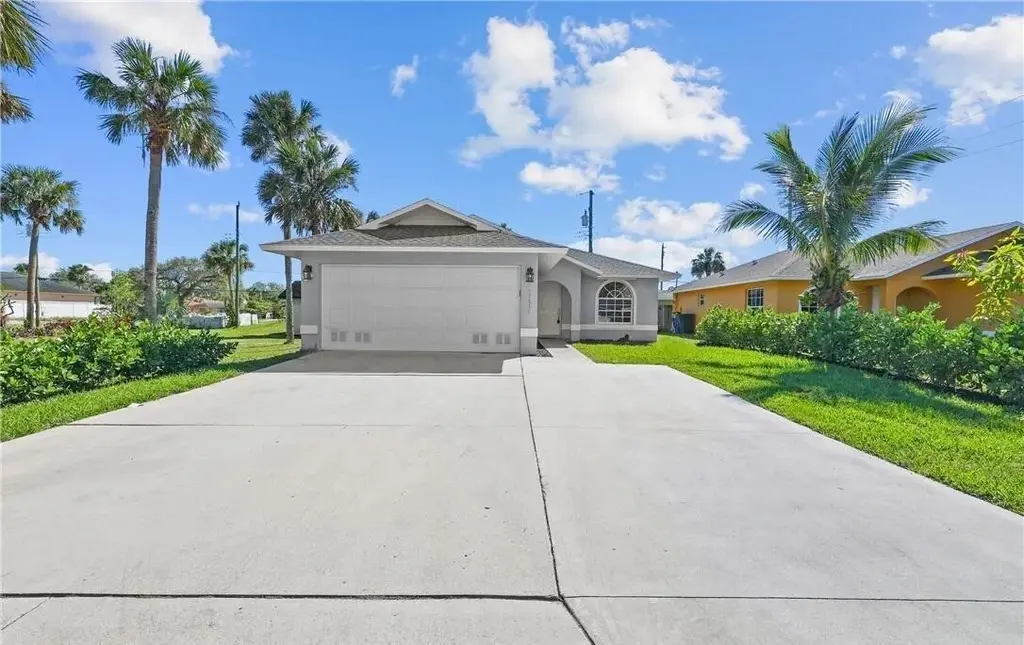
11536 McKenna Ave · Bonita Springs, FL
Flood risk 6/10 · Moderate
- FEMA flood zone
- AE
- Chance of flooding over 30 yrs
- 0.54%
- Est. flood insurance / yr
- $1,737 – $8,500
Fire risk 1/10 · Minimal
- Est. fire insurance / yr
- $947 – $1,759
Heat risk 10/10 · Severe
- Hot days now (above 107°F)
- 7 days/yr
- Hot days in 30 yrs
- 33 days/yr
Wind risk 10/10 · Severe
- Chance of severe wind over 30 yrs
- 99.0%
Air-quality risk 2/10 · Minimal
- Unhealthy air days now
- 1 days/yr
- Unhealthy air days in 30 yrs
- 1 days/yr
Risk factors via First Street. Map © Google.
Why this score? — see what drove the D grade
The composite is a weighted blend of 9 inputs, each scored 0–100. Each bar is that input's sub-score; the figure is the points it added to the 100-point composite (weight × sub-score).
- Cash flow +15.0/30.0
- ARV discount +7.5/15.0
- 1% rule +5.0/10.0
- DSCR +5.0/10.0
- Schools +4.1/10.0
- Livability +3.5/5.0
- Condition / age +2.5/5.0
- Rent growth +2.3/5.0
- Appreciation +0.0/10.0
$5,000
🖨 Deal sheet 📄 Offer letter ✓ Due diligence
Listing remarks MLS
Looking for a home that is move-in ready?? This home features three bedrooms and two baths. Home has a brand-new roof, fresh paint inside and out. New front door and back. brand new garage door opener, upgraded kitchen with granite counter tops, stainless steel appliances, Upgraded electrical and plumbing, new vanity in guest bathroom, with light fixture and toilet. Landscaping with irrigation system, just put in. Great location to start your family, or investment property. Conveniently located to I-75, shopping and favorite restaurants. Bonita beaches are minutes from this location. Schedule you're showing today before it sells.
Key facts
- 6,600 sq ft lot
- Built 2006
- Listed 6 days
Property features AI
Finance
- Other: Pets: other (see remarks); Rentals not allowed; No deed restrictions
- Financial info: Property is listed for auction
- HOA & community: No association fee; Association fee covers: other; No first right of refusal
Exterior
- Utilities: Utilities: other (see remarks)
- Home design: Other property type; Built in 2006; Less than 1/4 acre lot; Zoned OTH (Other Zoning); Subdivision: Other
- Construction: Other construction; Not above flood
- Exterior features: No waterfront; No waterview; Dockage: other
Interior
- Bedrooms: Bedroom 1; Bedroom 2; Bedroom 3
- Bathrooms: 2 full bathrooms
- Interior features: Other appliances (see remarks)
Neighborhood map
What this means for you Summary
Snapshot
- This is a 3-bed/2.0-bath single-family listed at $5k.
Deal economics
- At list price, monthly cash flow is $1k ($18k/yr) — positive.
- The deal already cash-flows at list — no discount required.
- Meets the 1% rule at list price ($2k rent vs $5k).
- Cap rate 463.5% vs local median 1.7% in Bonita Springs — top-decile yield for the area; either an underpriced asset or a hidden risk that comps aren't pricing in. Stress-test before assuming the spread holds.
Location & tenants
- Location reads 70/100 on livability (#428 in FL) — a middle-class / working-renter tenant base. Strengths: crime A+, housing A+, employment A; Watch: schools C-, cost of living C-, health & safety D.
- Lee (suburban): math 47% / reading 50% proficiency, ranked #42 of 73 in FL (top 58%) — families likely to look elsewhere, expect single-tenant / working-renter base with shorter leases.
- Market conditions: Rents soft (-0.6%/yr); 835 active listings in the ZIP; 40 comparable units currently listed for rent nearby; rentals at typical pace (median 24d on market — plan ~3-4 weeks tenant-placement turnaround); solid renter incomes; 15,411 units permitted in Lee County in 2024 (4,686 in 5+ unit buildings).
- This rent runs 32% of the median local income ($91k/yr) — at the standard rent-burdened threshold; future hikes will face affordability resistance.
Forward outlook
- Local home prices are declining (-3.0%/yr); year-one equity from $35 of loan paydown is wiped out by about $150 of value loss. Plan a longer hold.
- Lee County population projected at +44% by 2050 — long-run rental-demand tailwind backs the buy-and-hold thesis.
- At projected returns (-3.0% appreciation + 0.0% rent growth), your $1k cash investment doubles in ~1 year — after that, you're playing with house money.
Negotiation context
- Only 6 days on market — expect competitive offers; lowballing is unlikely to land.
- 4 sale attempts since 8y ago with the ask held roughly flat each time — persistent listings suggest the price (not the market) is what's stuck; bring a comps-based counter.
Risks & watch-outs
- Watch-outs: flood insurance adds $427/mo.
- Climate carrying-cost: in FEMA flood zone AE (mandatory federal flood insurance); severe wind risk, 99% chance of damaging wind over 30y; extreme-heat days projected 7→33/yr by 2055 (HVAC capex compounding) — expect insurance premiums to compound above CPI over the hold.
Questions for the listing agent
- What's the actual annual flood-insurance premium (NFIP or private), and is the property in a SFHA with mandatory coverage?
- Is there a deadline driving the sale (1031 exchange, divorce, estate, relocation)? That informs how much negotiation room exists.
- The area grade is low — what's the realistic commute time and amenity access for the typical tenant pool here? Any planned neighborhood developments (good or bad) we should know about?
- What's the average days-on-market for RENTAL listings here right now (not sales)? A rising rental-DOM trend means longer vacancies and softer asking-rent achievability than the comps imply.
- What's the recent tenant-quality profile in this submarket — average credit score on applications, eviction rate, late-payment / NSF rate, and stable-employment percentage? A property-management company in the area should have these aggregated.
- How much new for-sale + rental construction is in the pipeline within 1–3 miles? Heavy new supply typically softens prices + rents 12–24 months out; constrained supply supports both.
Investment metrics
- 1% rule
- 49.10% ✓
- Cap rate
- 463.47%
- Cash-on-cash
- 1632.77%
- DSCR
- 73.65
- GRM
- 0.2
CMA / ARV
- ARV (on-the-fly)
- $355,250
- Comps found
- 7
Show comp detail 7 sales within ~0.75 mi
| Address | Dist | Beds/Ba | Sqft | Sold | Price | $/sf | Match |
|---|---|---|---|---|---|---|---|
| 27971 Carl Cir | 0.51mi | 3/2.0 | 1,209 (-1%) | 13mo | $425,000 | $352 | 63 |
| 27965 Lime St | 0.28mi | 2/2.0 (-1) | 1,334 (+9%) | 7mo | $360,000 | $270 | 61 |
| 10901 Citrus Dr | 0.66mi | 3/2.0 | 1,161 (-5%) | 5mo | $328,000 | $283 | 56 |
| 10881 Citrus Dr | 0.68mi | 2/2.0 (-1) | 1,175 (-4%) | 12mo | $360,000 | $306 | 46 |
| 27616 Pinecrest Ln | 0.61mi | 3/2.0 | 1,102 (-10%) | 10mo | $320,000 | $290 | 46 |
| 11015 Smokey Dr | 0.61mi | 2/1.0 (-1) | 1,257 (+3%) | 20mo | $319,000 | $254 | 42 |
| 11860 Imperial Pines Way | 0.65mi | 3/2.0 | 1,148 (-6%) | 22mo | $400,000 | $348 | 41 |
Match score weights: distance 35% · size 25% · config 20% · recency 20%. Top-matched comps best support the ARV.
Projected returns pro-forma
-3.0% appreciation · 0.0% rent growth · sell at horizon
- IRR
- —
- Equity multiple
- 62.75×
- Total profit
- $86,452
- Equity at exit
- $746
- IRR
- —
- Equity multiple
- 122.38×
- Total profit
- $169,935
- Equity at exit
- $432
Cash invested: $1,400 (down + closing). Projections, not guarantees.
Landlord ↔ Tenant lean methodology
- Overall (STATE)
- 87 Strongly Landlord-Friendly
- State Florida
- 87 Strongly Landlord-Friendly · R+3
- County
- — inherits STATE
- City
- — inherits STATE
ZIP-level market 34135
- Rents YoY
- -0.6%
- Active inventory
- 835
- Price-to-rent
- 0.2×
Monthly cashflow live
- Estimated rent
- $2,455 high interval (Pro) →
- Mortgage (P&I)
- −$26
- Tax est. 1.5%
- −$6 /mo · $75/yr
- Insurance
- −$2
- Flood insurance flood zone
- −$427 /mo · $5,118/yr
- HOA
- −$0
- Vacancy / Maint / Mgmt
- −$516
- Net cashflow
- $1,478
Break-even live
UW: 25.0% down · 7.5% · 30yr · 1.5% tax · 5.0% vac · 8.0% maint · 8.0% mgmt
Financing live
Cash to close
- Down payment
- $1,250
- Closing costs
- $150
- Reserves months
- —
- Total cash needed
- —
Loan-product check · same deal, 3 products live
Conventional
25% down · 7.5% · 30yr
- Down + closing
- —
- Monthly P&I
- —
- Monthly cashflow
- —
- DSCR
- —
- Eligible?
- —
Personal DTI + credit; lowest rate.
DSCR
20% down · 8.5% · 30yr
- Down + closing
- —
- Monthly P&I
- —
- Monthly cashflow
- —
- DSCR
- —
- Eligible?
- —
No personal income docs; deal must DSCR.
Hard money
10% down · 12.0% · 12mo
- Down + closing
- —
- Monthly P&I
- —
- Monthly cashflow
- —
- DSCR
- —
- Eligible?
- —
Short-term bridge; refi at stabilization.
Rent comps 40 comps
| Address | Beds | Baths | Sqft | Rent | $/sqft | DOM | Units | Dist |
|---|---|---|---|---|---|---|---|---|
| 11350 Pendleton St #352 Bonita Springs, FL | 2.0 | 1.0 | 1020 | $1,800 | $1.76 | 23d | 1 | 0.17mi |
| 27599 Lime St Bonita Springs, FL | 2.0 | 1.0 | 900 | $1,800 | $2.00 | 23d | 1 | 0.32mi |
| 28000 Crest Preserve Cir Bonita Springs, FL | 1.0–2.0 | 1.0–2.0 | 897 | $2,519 | $2.81 | 3d | 23 | 0.57mi |
| 28160 Pine Haven Way Bonita Springs, FL | 2.0 | 2.0 | 884 | $1,900 | $2.15 | 10d | 1 | 0.65mi |
| 28100 Pine Haven Way #6 Bonita Springs, FL | 2.0 | 2.0 | 884 | $1,895 | $2.14 | 23d | 1 | 0.65mi |
| 28100 Pine Haven Way #5 Bonita Springs, FL | 2.0 | 2.0 | 884 | $1,800 | $2.04 | 23d | 1 | 0.65mi |
| 28121 Pine Haven Way #110 Bonita Springs, FL | 2.0 | 2.0 | 884 | $2,100 | $2.38 | 23d | 1 | 0.70mi |
| 28121 Pine Haven Way #109 Bonita Springs, FL | 2.0 | 2.0 | 1040 | $1,795 | $1.73 | 23d | 1 | 0.70mi |
| 28260 Pine Haven Way #84 Bonita Springs, FL | 2.0 | 2.0 | 1030 | $1,950 | $1.89 | 19d | 1 | 0.71mi |
| 28260 Pine Haven Way #81 Bonita Springs, FL | 2.0 | 2.0 | 1030 | $1,700 | $1.65 | 11d | 1 | 0.71mi |
| 28161 Pine Haven Way #131 Bonita Springs, FL | 2.0 | 2.0 | 884 | $2,050 | $2.32 | 23d | 1 | 0.72mi |
| 12015 Matera Ln #102 Bonita Springs, FL | 3.0 | 2.0 | 1467 | $7,500 | $5.11 | 23d | 1 | 0.72mi |
| 12015 Matera Ln #101 Bonita Springs, FL | 2.0 | 2.0 | 1467 | $6,000 | $4.09 | 23d | 1 | 0.72mi |
| 28280 Pine Haven Way #91 Bonita Springs, FL | 2.0 | 2.0 | 913 | $3,000 | $3.29 | 23d | 1 | 0.73mi |
| 28280 Pine Haven Way #93 Bonita Springs, FL | 2.0 | 2.0 | 1030 | $3,200 | $3.11 | 23d | 1 | 0.73mi |
| 28201 Pine Haven Way #145 Bonita Springs, FL | 2.0 | 2.0 | 1030 | $1,800 | $1.75 | 16d | 1 | 0.73mi |
| 28231 Pine Haven Way #163 Bonita Springs, FL | 2.0 | 2.0 | 913 | $1,850 | $2.03 | 21d | 1 | 0.76mi |
| 28231 Pine Haven Way #163 Bonita Springs, FL | 2.0 | 2.0 | 913 | $1,850 | $2.03 | 19d | 1 | 0.76mi |
| 28261 Pine Haven Way Bonita Springs, FL | 2.0 | 2.0 | 1068 | $1,795 | $1.68 | 23d | 1 | 0.76mi |
| 27123 Matheson Ave Bonita Springs, FL | 2.0 | 2.0 | 970 | $1,300 | $1.34 | 3d | 1 | 0.77mi |
| 12040 Matera Ln #104 Bonita Springs, FL | 2.0 | 2.0 | 1467 | $7,500 | $5.11 | 14d | 1 | 0.79mi |
| 27107 Matheson Ave Unit 4-108 Bonita Springs, FL | 2.0 | 2.0 | 975 | $3,995 | $4.10 | 23d | 1 | 0.80mi |
| 12080 Matera Ln #204 Bonita Springs, FL | 2.0 | 2.0 | 1467 | $7,500 | $5.11 | 16d | 1 | 0.87mi |
| 27310 Dortch Ave Bonita Springs, FL | 3.0 | 2.0 | 1400 | $2,850 | $2.04 | 14d | 1 | 0.89mi |
| 27302 Dortch Ave #304 Bonita Springs, FL | 2.0 | 1.0 | 800 | $2,550 | $3.19 | 3d | 1 | 0.89mi |
| 27302 Dortch Ave Bonita Springs, FL | 3.0 | 2.0 | 1400 | $3,100 | $2.21 | 3d | 1 | 0.89mi |
| 10671 Hampton St Bonita Springs, FL | 4.0 | 2.0 | 1500 | $3,400 | $2.27 | 19d | 1 | 0.91mi |
| 27083 Matheson Ave #208 Bonita Springs, FL | 2.0 | 2.0 | 970 | $1,750 | $1.80 | 23d | 1 | 0.93mi |
| 11931 Palm Bay Ct Unit 202 Bonita Springs, FL | 2.0 | 2.0 | 940 | $1,700 | $1.81 | 3d | 1 | 0.95mi |
| 11931 Palm Bay Ct Unit 102 Bonita Springs, FL | 2.0 | 2.0 | 940 | $1,800 | $1.91 | 23d | 1 | 0.95mi |
| 11931 Palm Bay Ct Unit 202 Bonita Springs, FL | 2.0 | 2.0 | 940 | $1,885 | $2.01 | 10d | 1 | 0.95mi |
| 10897 Goodwin St #899 Bonita Springs, FL | 2.0 | 1.0 | 770 | $1,950 | $2.53 | 23d | 1 | 0.97mi |
| 10575 Crockett St Unit 303 Bonita Springs, FL | 2.0 | 2.0 | 1000 | $2,400 | $2.40 | 23d | 1 | 0.97mi |
| 10575 Crockett St Unit 406 Bonita Springs, FL | 2.0 | 2.0 | 900 | $2,450 | $2.72 | 3d | 1 | 0.97mi |
| 10725 Wilson St #11 Bonita Springs, FL | 2.0 | 12.0 | 1008 | $1,800 | $1.79 | 23d | 1 | 0.98mi |
| 27249 Pullen Ave #4 Bonita Springs, FL | 2.0 | 2.5 | 956 | $3,200 | $3.35 | 23d | 1 | 1.01mi |
| 27249 Pullen Ave #5 Bonita Springs, FL | 2.0 | 2.0 | 956 | $1,950 | $2.04 | 23d | 1 | 1.01mi |
| 27250 Shriver Ave Unit 1073504P Bonita Springs, FL | 2.0 | 1.0 | 661 | $4,275 | $6.46 | 3d | 2 | 1.09mi |
| 11495 Forest Mere Dr Bonita Springs, FL | 3.0 | 2.0 | 1422 | $2,400 | $1.69 | 23d | 1 | 1.14mi |
| 12349 Londonderry Ln Bonita Springs, FL | 2.0 | 2.0 | 1142 | $2,295 | $2.01 | 23d | 1 | 1.19mi |
Listing history 6 events
-
2026-06-18days on market $5,000 Active 6 DOM
-
2026-06-17days on market $5,000 Active 5 DOM
-
2026-06-16days on market $5,000 Active 4 DOM
-
2026-06-15days on market $5,000 Active 3 DOM
-
2026-06-13remarks 301-char remark
-
2026-06-13$5,000 Active 1 DOM
ⓘ Source: listings_history table (triggers on properties + properties_extension) + one-shot
backfill from property_details.listing_events for pre-trigger history.
Climate risk First Street
- Flood 6/10 Major FEMA zone AE · 54% chance over 30 yrs
- Wildfire 1/10 Low
- Heat 10/10 Extreme 7 d/yr ≥107°F today · 33 d/yr by 30 yrs out
- Wind 10/10 Extreme 99% chance of damaging wind over 30 yrs
- Air quality 2/10 Low 1 unhealthy d/yr today · 1 by 30 yrs out
Nearby sold comps map
Loading sold comps map…
Walkable amenities ~0.75 mi
Loading nearby amenities…
Taxation est. · year 1
- Rental income
- $29,460
- − Mortgage interest
- −$280
- − Property taxes
- −$75
- − Insurance
- −$5,144
- − Repairs & maintenance
- −$2,357
- − Management
- −$2,357
- − Depreciation
- −$145
- Taxable income
- $19,102
- Est. tax owed @ 24.0%
- −$4,585
- After-tax cash flow
- $13,156/yr
For passive investors: Depreciation is non-cash, so a rental often shows a tax loss while cash-flowing — sheltering income. Rental losses are passive: they offset passive income freely, and up to $25,000/yr can offset ordinary (W-2) income if you actively participate and your MAGI is under $100k (phasing out to $0 by $150k); unused losses carry forward. On sale, claimed depreciation is recaptured at up to 25%, and gains may owe capital-gains tax (a 1031 exchange can defer both). Figures are a year-1 estimate at your 24.0% rate — not tax advice; consult a CPA.
Schools (NCES district)
- District
- Lee
- NCES district ID
- 1201080
- Math proficiency
- 47% ▼ -11.00%
- Reading proficiency
- 50% ▼ -4.00%
- Median HH income
- $49,518
- Composite
- 41.49/100
- National rank
- #3458
- State rank
- #42 of 73 in FL
Livability — Bonita Springs
- Score
- 70/100
- State rank
- #428
- US rank
- #7576
Category grades
Schools grade is shown separately in the Schools card above.
Census & demographics
- Census place
- Bonita Springs, FL
- County
- Lee County · 788,662 people
- City population
- 64,727
- Metro
- Cape Coral-Fort Myers, FL
- Population (ZIP)
- 48,252
- Household income
- $91,380
- Rent vs Own
- Severe rent burden
- 976.0
Population outlook (Lee County) Hauer SSP2
- Today (2025)
- 871,946 people
- By 2030
- 955,468 · +9.6%
- By 2040
- 1,113,587 · +27.7%
- By 2050
- 1,256,891 · +44.1%
- By 2075
- 1,560,270 · +78.9%
- By 2100
- 1,726,848 · +98.0%
Race, ethnicity, and origin ACS 2023
- Neighborhood character
- Predominantly White (69%)
- Race & ethnicity
- White 69% Hispanic / Latino 26% Two or more races 13% Native American 3% Black 2%
- Hispanic origin (detail)
- Mexican 8% Puerto Rican 4% Cuban 3%
- Common ancestry
- Romanian 5% Lithuanian 2% Slovak 2%
- Foreign-born
- 22% · Canada, Jamaica
- Languages at home
- 74% English-only · Spanish 21% French/Haitian/Cajun 1% Russian/Polish/Slavic 1%
Political lean MEDSL · Lee
- 2024 margin
- Strong R (+28.4) · D 35.5% · R 63.9%
- 2008→2024 swing
- -18.0pp toward R · 2008: -10.4pp · 2024: -28.4pp
- All cycles
- 2024: R+28.4 2020: R+19.2 2016: R+20.4 2012: R+16.6 2008: R+10.4
Not yet ingested
- Civics
- —
Market trends
- HPI YoY
- ▼ -188.86%
- Current HPI
- 243.4153
- Rent YoY
- ▼ -0.61%
- Metro
- Cape Coral-Fort Myers, FL
- State GDP YoY
- ▲ 3.28%
- F500 in state
- 36
Industry mix (Fortune 500 HQ in FL)
| Industry | F500 HQs | Revenue |
|---|---|---|
| Industrial Technology | 2 | $29B |
|
||
| Insurance | 2 | $17B |
|
||
| Retail | 1 | $60B |
|
||
| Technology Distribution | 1 | $58B |
|
||
| Homebuilding | 1 | $35B |
|
||
| Technology Manufacturing | 1 | $35B |
|
||
Price history
-97.9% since first listed15 events — show timeline
- 2026-06-12 Listed $5,000 FLKMLS
- 2023-02-10 Sold (Public Records) $410,000 Public Records
- 2023-02-07 Sold (MLS) $410,000 FORTMLS
- 2023-01-02 Pending — FORTMLS
- 2022-11-21 Price Changed $425,000 FORTMLS
- 2022-11-20 Price Changed $450,000 FORTMLS
- 2022-10-26 Listed $475,000 FORTMLS
- 2022-07-25 Sold (MLS) $380,000 NAPLESMLS
- 2022-07-19 Sold (Public Records) $380,000 Public Records
- 2022-06-19 Pending — NAPLESMLS
- 2022-06-06 Listed $380,000 NAPLESMLS
- 2018-06-12 Sold (Public Records) $239,000 Public Records
- 2018-06-08 Sold (MLS) $239,000 FORTMLS
- 2018-04-27 Pending — FORTMLS
- 2018-02-09 Listed $239,000 FORTMLS
Property tax history
+8.2%/yrLatest (2025): $4,787 · +1.1% YoY. Source: county tax records.
Cash-flow waterfall
monthlySold comps — $/sqft
last 12 mo · ≤1 miLoading sold comps…