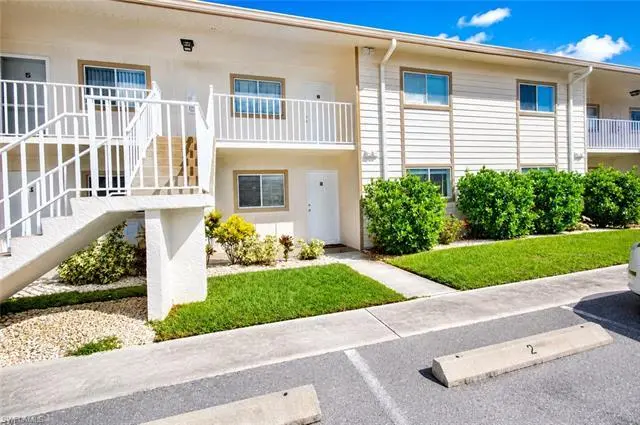
2385 Naples Trace Cir #2 · Pelican Marsh, FL
Flood risk 6/10 · Moderate
- FEMA flood zone
- X (shaded)
- Chance of flooding over 30 yrs
- 0.56%
- Est. flood insurance / yr
- $507 – $1,088
Fire risk 1/10 · Minimal
- Est. fire insurance / yr
- $947 – $1,759
Heat risk 10/10 · Severe
- Hot days now (above 107°F)
- 7 days/yr
- Hot days in 30 yrs
- 31 days/yr
Wind risk 10/10 · Severe
- Chance of severe wind over 30 yrs
- 99.0%
Air-quality risk 2/10 · Minimal
- Unhealthy air days now
- 1 days/yr
- Unhealthy air days in 30 yrs
- 1 days/yr
Risk factors via First Street. Map © Google.
Why this score? — see what drove the D grade
The composite is a weighted blend of 9 inputs, each scored 0–100. Each bar is that input's sub-score; the figure is the points it added to the 100-point composite (weight × sub-score).
- Cash flow +8.9/30.0
- ARV discount +7.5/15.0
- Appreciation +5.1/10.0
- Schools +5.0/10.0
- 1% rule +3.7/10.0
- Rent growth +2.7/5.0
- DSCR +2.5/10.0
- Livability +2.5/5.0
- Condition / age +2.5/5.0
$269,000
🖨 Deal sheet (PDF) 📄 Offer letter ✓ Due diligence
Listing remarks
Welcome to easy North Naples living in Naples Trace Condos. This 2-bedroom, 2-bath condo offers a comfortable layout, a screened lanai, and a peaceful landscaped/preserve view, creating a relaxing setting for full-time living, a seasonal residence, or an investment opportunity. Enjoy the convenience of low-maintenance condo living with access to the community pool, sundeck, and cabana area. Ideally located near Mercato, shopping, dining, everyday conveniences, and Naples’ beautiful Gulf beaches, this property offers a great opportunity to enjoy the best of Southwest Florida living. Schedule your private showing today.
Key facts
- Community pool
- Screened lanai
- Near mercato
Tags
Property features AI
Finance
- Other: Part of an 86-unit complex with 8 units in the building; Unit located in building number 1, lot/unit 102, subdivision number 514900 (Naples Trace)
- HOA & community: Mandatory HOA; Quarterly condo fee of $1,100 (total annual recurring fees $4,400); One-time fees $150; Professional management; Community amenities include community pool, BBQ/picnic area, and sidewalks; HOA maintenance covers insurance, irrigation water, lawn/land maintenance, interior and exterior pest control, reserves, sewer, street lights, street maintenance, trash removal, and water; Non-gated community
Exterior
- Parking: 1 assigned parking space
- Utilities: Water assessment paid; Sewer assessment paid; Cable available
- Home design: Residential low-rise building (1-3 stories); 2-story building; Rear exposure faces northwest
- Construction: Concrete block construction; Stucco exterior finish; Shingle roof; Single-hung windows; Built in 1990
- Exterior features: Patio; Landscaped area and preserve views; Irrigation assessment paid
Interior
- Kitchen: Dishwasher; Disposal; Microwave; Range; Refrigerator/Freezer
- Bedrooms: 2 bedrooms with a split-bedroom floor plan
- Flooring: Vinyl flooring
- Bathrooms: 2 full bathrooms; Master bath with shower only
- Heating & cooling: Central electric heat; Central electric cooling; Ceiling fans
- Interior features: Smoke detectors; Dining area open to living space; Screened lanai/porch
- Laundry & utility: Washer; Dryer
Neighborhood map
What this means for you Summary
Snapshot
- This is a 2-bed/2.0-bath condo listed at $269k.
Deal economics
- At list price, monthly cash flow is $-214 ($-3k/yr) — negative.
- To cash-flow at today's rent, offer at most $231k (14.1% below list).
- To meet the 1% rule (rent ≥ 1% of price), the offer needs to be $234k (13.0% below list).
- Recommended offer: $231k (14.1% below list) — sets the bar for cash-flow.
Location & tenants
- Location reads: area grade D — affects rentability + tenant quality, not the cash-flow math above.
- Collier (suburban): math 60% / reading 56% proficiency, ranked #16 of 73 in FL (top 22%) — acceptable for families but not a draw, mixed tenant base, ~2y average lease.
- Market conditions: Rents flat; 425 active listings in the ZIP; 40 comparable units currently listed for rent nearby; rentals at typical pace (median 25d on market — plan ~3-4 weeks tenant-placement turnaround); solid renter incomes; 3,520 units permitted in Collier County in 2024 (959 in 5+ unit buildings).
- This rent runs 30% of the median local income ($92k/yr) — at the standard rent-burdened threshold; future hikes will face affordability resistance.
Forward outlook
- In year one you build about $3k of equity ($2k loan paydown + $793 appreciation (0.3% local appreciation)).
- Collier County population projected at +30% by 2050 — long-run rental-demand tailwind backs the buy-and-hold thesis.
- By year 10, paydown + projected appreciation supports a ~$33k cash-out refi (75% LTV) — recoverable capital for the next deal without selling this one.
Negotiation context
- It's been on market 24 days — a 2% lower offer ($265k) is reasonable based on typical stale-listing flexibility.
- 3 sale attempts since 11y ago with the ask held roughly flat each time — persistent listings suggest the price (not the market) is what's stuck; bring a comps-based counter.
Risks & watch-outs
- Climate carrying-cost: major flood risk; severe wind risk, 99% chance of damaging wind over 30y; extreme-heat days projected 7→31/yr by 2055 (HVAC capex compounding) — expect insurance premiums to compound above CPI over the hold.
Questions for the listing agent
- What do current leases actually rent for vs. the listed asking? Can we see a recent rent roll and the last 12 months of T-12 income?
- What does the HOA fee cover, when was the last increase, and are there any pending special assessments or reserve-fund shortfalls?
- Any open or pending special assessments — roof, HVAC, plumbing, elevator, façade? What's the per-unit balance and payoff schedule, and is the seller paying it off at close or rolling it to the buyer?
- Is there a deadline driving the sale (1031 exchange, divorce, estate, relocation)? That informs how much negotiation room exists.
- The area grade is low — what's the realistic commute time and amenity access for the typical tenant pool here? Any planned neighborhood developments (good or bad) we should know about?
- What's the average days-on-market for RENTAL listings here right now (not sales)? A rising rental-DOM trend means longer vacancies and softer asking-rent achievability than the comps imply.
- What's the recent tenant-quality profile in this submarket — average credit score on applications, eviction rate, late-payment / NSF rate, and stable-employment percentage? A property-management company in the area should have these aggregated.
- How much new apartment / multifamily construction is in the pipeline within 1–3 miles? Heavy new supply (>2% of stock underway) typically softens rents 12–24 months out; light construction supports rent growth.
Investment metrics
- 1% rule
- 0.87% ✗
- Cap rate
- 5.34%
- Cash-on-cash
- -3.42%
- DSCR
- 0.85
- GRM
- 9.6
CMA / ARV
No comps found within radius.
Projected returns pro-forma
0.29% appreciation · 0.92% rent growth · sell at horizon
- IRR
- -6.3%
- Equity multiple
- 0.70×
- Total profit
- $-22,415
- Equity at exit
- $82,099
- IRR
- -2.0%
- Equity multiple
- 0.79×
- Total profit
- $-15,760
- Equity at exit
- $101,930
Cash invested: $75,320 (down + closing). Projections, not guarantees.
Landlord ↔ Tenant lean methodology
- Overall (STATE)
- 87 Strongly Landlord-Friendly
- State Florida
- 87 Strongly Landlord-Friendly · R+3
- County
- — inherits STATE
- City
- — inherits STATE
ZIP-level market 34109
- Home prices YoY
- 0.1%
- Rents YoY
- 0.9%
- Active inventory
- 425
- Price-to-rent
- 9.6×
Monthly cashflow live
- Estimated rent
- $2,341 high interval (Pro) →
- Mortgage (P&I)
- −$1,411
- Tax from tax record
- −$174 /mo · $2,091/yr
- Insurance
- −$112
- HOA
- −$367
- Vacancy / Maint / Mgmt
- −$492
- Net cashflow
- $-214
Break-even live
Sensitivity live
| Price | -10% $-62 | -5% $-138 | +0% $-214 | +5% $-291 | +10% $-367 |
|---|---|---|---|---|---|
| Rent | -10% $-399 | -5% $-307 | +0% $-214 | +5% $-122 | +10% $-29 |
| Rate | -1.0pp $-79 | -0.5pp $-146 | base $-214 | +0.5pp $-284 | +1.0pp $-355 |
UW: 25.0% down · 7.5% · 30yr · 1.5% tax · 5.0% vac · 8.0% maint · 8.0% mgmt
Financing live
Cash to close
- Down payment
- $67,250
- Closing costs
- $8,070
- Reserves months
- —
- Total cash needed
- —
Loan-product check · same deal, 3 products live
Conventional
25% down · 7.5% · 30yr
- Down + closing
- —
- Monthly P&I
- —
- Monthly cashflow
- —
- DSCR
- —
- Eligible?
- —
Personal DTI + credit; lowest rate.
DSCR
20% down · 8.5% · 30yr
- Down + closing
- —
- Monthly P&I
- —
- Monthly cashflow
- —
- DSCR
- —
- Eligible?
- —
No personal income docs; deal must DSCR.
Hard money
10% down · 12.0% · 12mo
- Down + closing
- —
- Monthly P&I
- —
- Monthly cashflow
- —
- DSCR
- —
- Eligible?
- —
Short-term bridge; refi at stabilization.
Rent comps 40 comps
| Address | Beds | Baths | Sqft | Rent | $/sqft | DOM | Units | Dist |
|---|---|---|---|---|---|---|---|---|
| 2385 Naples Trace Cir #2 Naples, FL | 2.0 | 2.0 | 1000 | $1,900 | $1.90 | 24d | 1 | 0.03mi |
| 2345 Carrington Ct Unit 6-102 Naples, FL | 2.0 | 2.0 | 1213 | $1,850 | $1.53 | 24d | 1 | 0.14mi |
| 2325 Carrington Ct #104 Naples, FL | 2.0 | 2.0 | 1215 | $7,500 | $6.17 | 15d | 1 | 0.14mi |
| 2325 Carrington Ct #202 Naples, FL | 2.0 | 2.0 | 1200 | $8,000 | $6.67 | 15d | 1 | 0.14mi |
| 2215 Chesterbrook Ct #203 Naples, FL | 2.0 | 2.0 | 1433 | $8,000 | $5.58 | 15d | 1 | 0.17mi |
| 2295 Carrington Ct Unit 1-104 Naples, FL | 2.0 | 2.0 | 1215 | $7,500 | $6.17 | 24d | 1 | 0.23mi |
| 2295 Carrington Ct Unit 1-101 Naples, FL | 2.0 | 2.0 | 1300 | $2,000 | $1.54 | 24d | 1 | 0.23mi |
| 2290 Carrington Ct #202 Naples, FL | 2.0 | 2.0 | 1183 | $7,500 | $6.34 | 24d | 1 | 0.25mi |
| 110 Cypress Way E Unit F5 Naples, FL | 2.0 | 2.0 | 1390 | $1,750 | $1.26 | 24d | 1 | 0.27mi |
| 124 Cypress Way E Unit E5 Naples, FL | 2.0 | 2.0 | 1390 | $2,000 | $1.44 | 24d | 1 | 0.31mi |
| 113 Wading Bird Cir #206 Naples, FL | 2.0 | 2.0 | 1210 | $1,800 | $1.49 | 15d | 1 | 0.32mi |
| 113 Wading Bird Cir Unit W-204 Naples, FL | 2.0 | 2.0 | 1084 | $3,000 | $2.77 | 15d | 1 | 0.32mi |
| 185 Grand Oaks Way Unit R204 Naples, FL | 2.0 | 2.0 | 1200 | $2,000 | $1.67 | 15d | 1 | 0.33mi |
| 185 Grand Oaks Way Unit R204 Naples, FL | 2.0 | 2.0 | 1200 | $2,000 | $1.67 | 24d | 1 | 0.33mi |
| 135 Cypress Way E Unit C Naples, FL | 2.0 | 2.0 | 1377 | $2,350 | $1.71 | 15d | 1 | 0.35mi |
| 137 Wading Bird Cir Naples, FL | 2.0 | 2.0 | 1085 | $1,650 | $1.52 | 24d | 1 | 0.36mi |
| 137 Wading Bird Cir Unit 104 Naples, FL | 2.0 | 2.0 | 1150 | $1,800 | $1.57 | 24d | 1 | 0.37mi |
| 145 Cypress Way E Unit East145A Naples, FL | 2.0 | 2.0 | 1377 | $2,300 | $1.67 | 24d | 1 | 0.38mi |
| 144 Cypress Way E Unit 701 Naples, FL | 2.0 | 2.0 | 1064 | $1,900 | $1.79 | 15d | 1 | 0.41mi |
| 151 Cypress Way E Naples, FL | 2.0 | 2.0 | 1350 | $1,200 | $0.89 | 24d | 1 | 0.43mi |
| 154 Cypress Way E Unit 1102 Naples, FL | 3.0 | 2.0 | 1150 | $2,650 | $2.30 | 15d | 1 | 0.45mi |
| 138 Pebble Shores Dr #103 Naples, FL | 2.0 | 2.0 | 1042 | $2,450 | $2.35 | 15d | 1 | 0.47mi |
| 157 Wading Bird Cir #104 Naples, FL | 2.0 | 2.0 | 1000 | $1,300 | $1.30 | 24d | 1 | 0.48mi |
| 120 Pebble Shores Dr #106 Naples, FL | 2.0 | 2.0 | 1132 | $6,000 | $5.30 | 15d | 1 | 0.52mi |
| 1020 Palm View Dr Unit C-104 Naples, FL | 2.0 | 2.0 | 1008 | $2,600 | $2.58 | 15d | 1 | 0.55mi |
| 1020 Palm View Dr Unit 103 Naples, FL | 2.0 | 2.0 | 1088 | $1,750 | $1.61 | 24d | 1 | 0.55mi |
| 186 Pebble Shores Dr #103 Naples, FL | 2.0 | 2.0 | 1042 | $2,500 | $2.40 | 24d | 1 | 0.57mi |
| 81 Wickliffe Dr Unit 1073563P Naples, FL | 3.0 | 2.0 | 1496 | $4,681 | $3.13 | 15d | 1 | 0.58mi |
| 10805 Queen Anne Ln #203 Naples, FL | 2.0 | 2.0 | 1252 | $4,800 | $3.83 | 24d | 1 | 0.59mi |
| 681 Palm View Dr Naples, FL | 2.0 | 2.0 | 1240 | $2,100 | $1.69 | 15d | 1 | 0.63mi |
| 729 Palm View Dr Unit D4 Naples, FL | 2.0 | 2.0 | 1133 | $2,250 | $1.99 | 24d | 1 | 0.64mi |
| 9640 Victoria Ln Unit C-305 Naples, FL | 2.0 | 2.0 | 1191 | $4,200 | $3.53 | 15d | 1 | 0.66mi |
| 849 Palm View Dr #28 Naples, FL | 2.0 | 2.0 | 1360 | $3,000 | $2.21 | 24d | 1 | 0.69mi |
| 9828 Luna Cir Unit H203 Naples, FL | 2.0 | 2.0 | 1216 | $2,650 | $2.18 | 15d | 1 | 0.71mi |
| 240 Palm River Blvd Unit C102 Naples, FL | 2.0 | 2.0 | 1440 | $2,995 | $2.08 | 24d | 1 | 0.75mi |
| 241 Palm River Blvd Unit C202 Naples, FL | 2.0 | 2.0 | 1430 | $3,500 | $2.45 | 24d | 1 | 0.78mi |
| 9580 Victoria Ln Unit A-202 Naples, FL | 2.0 | 2.0 | 1191 | $1,900 | $1.60 | 15d | 1 | 0.79mi |
| 4635 Saint Croix Ln #1214 Naples, FL | 2.0 | 2.0 | 913 | $1,900 | $2.08 | 15d | 1 | 0.91mi |
| 4610 Saint Croix Ln #1027 Naples, FL | 3.0 | 2.0 | 1196 | $4,000 | $3.34 | 24d | 1 | 0.93mi |
| 4620 Saint Croix Ln Naples, FL | 2.0 | 2.0 | 982 | $1,800 | $1.83 | 15d | 2 | 0.94mi |
HOA detail condo
- Monthly dues
- $367 · $4,404/yr
- Likely covers
- pool
- Assessments
- None detected in remarks — confirm with the listing agent.
Listing history 15 events
-
2026-06-21days on market $269,000 Active 24 DOM
-
2026-06-18days on market $269,000 Active 21 DOM
-
2026-06-17days on market $269,000 Active 20 DOM
-
2026-06-16days on market $269,000 Active 19 DOM
-
2026-06-15days on market $269,000 Active 18 DOM
-
2026-06-14pricedays on market $269,000 Active 16 DOM
-
2026-06-10days on market $275,000 Active 13 DOM
-
2026-06-09days on market $275,000 Active 12 DOM
-
2026-06-08days on market $275,000 Active 11 DOM
-
2026-06-07days on market $275,000 Active 10 DOM
-
2026-06-03days on market $275,000 Active 6 DOM
-
2026-06-02days on market $275,000 Active 5 DOM
-
2026-06-01days on market $275,000 Active 4 DOM
-
2026-06-01remarks 625-char remark
-
2026-06-01$275,000 Active 3 DOM
ⓘ Source: listings_history table (triggers on properties + properties_extension) + one-shot
backfill from property_details.listing_events for pre-trigger history.
Tax reassessment forecast FL · Resets to sale price
- Current annual tax
- $2,091 · $174/mo
- Projected year-2 tax
- $2,233 · $186/mo
- Expected delta
- +$141/yr (+$12/mo · 6.8%)
ⓘ Screening estimate from a state-policy table — verify with the county assessor before closing.
Climate risk First Street
- Flood 6/10 Major FEMA zone X (shaded) · 56% chance over 30 yrs
- Wildfire 1/10 Low
- Heat 10/10 Extreme 7 d/yr ≥107°F today · 31 d/yr by 30 yrs out
- Wind 10/10 Extreme 99% chance of damaging wind over 30 yrs
- Air quality 2/10 Low 1 unhealthy d/yr today · 1 by 30 yrs out
Nearby sold comps map
Loading sold comps map…
Walkable amenities ~0.75 mi
Loading nearby amenities…
Taxation est. · year 1
- Rental income
- $28,095
- − Mortgage interest
- −$15,068
- − Property taxes
- −$2,091
- − Insurance
- −$1,345
- − Repairs & maintenance
- −$2,248
- − Management
- −$2,248
- − HOA
- −$4,404
- − Depreciation
- −$7,825
- Taxable loss
- −$7,134
- Est. tax savings @ 24.0%
- +$1,712
- After-tax cash flow
- $-861/yr
For passive investors: Depreciation is non-cash, so a rental often shows a tax loss while cash-flowing — sheltering income. Rental losses are passive: they offset passive income freely, and up to $25,000/yr can offset ordinary (W-2) income if you actively participate and your MAGI is under $100k (phasing out to $0 by $150k); unused losses carry forward. On sale, claimed depreciation is recaptured at up to 25%, and gains may owe capital-gains tax (a 1031 exchange can defer both). Figures are a year-1 estimate at your 24.0% rate — not tax advice; consult a CPA.
Schools (NCES district)
- District
- Collier
- NCES district ID
- 1200330
- Math proficiency
- 60% ▼ -4.00%
- Reading proficiency
- 56% ▼ -2.00%
- Median HH income
- $58,275
- Composite
- 50.23/100
- National rank
- #1892
- State rank
- #16 of 73 in FL
Livability — Pelican Marsh
No livability data for this city. (Only ~50 U.S. cities are tracked.)
Census & demographics
- County
- Collier County · 396,295 people
- Metro
- Naples-Marco Island, FL
- Population (ZIP)
- 27,273
- Household income
- $92,259
- Rent vs Own
- Severe rent burden
- 1712.0
Population outlook (Collier County) Hauer SSP2
- Today (2025)
- 420,858 people
- By 2030
- 450,054 · +6.9%
- By 2040
- 502,232 · +19.3%
- By 2050
- 544,932 · +29.5%
- By 2075
- 627,203 · +49.0%
- By 2100
- 659,015 · +56.6%
Race, ethnicity, and origin ACS 2023
- Neighborhood character
- Predominantly White (78%)
- Race & ethnicity
- White 78% Hispanic / Latino 11% Two or more races 9% Black 4% Asian 4%
- Hispanic origin (detail)
- Mexican 1% Puerto Rican 1% Cuban 3%
- Common ancestry
- Romanian 5% Scotch-Irish 3% Lithuanian 2%
- Foreign-born
- 20% · Canada, Jamaica, Vietnam
- Languages at home
- 77% English-only · Spanish 10% Other Indo-European 5% Russian/Polish/Slavic 3%
Political lean MEDSL · Collier
- 2024 margin
- Solid R (+33.1) · D 33.1% · R 66.2%
- 2008→2024 swing
- -10.6pp toward R · 2008: -22.5pp · 2024: -33.1pp
- All cycles
- 2024: R+33.1 2020: R+24.7 2016: R+26.0 2012: R+30.1 2008: R+22.5
Not yet ingested
- Civics
- —
Market trends
- HPI YoY
- ▲ 0.29%
- Current HPI
- 279.357
- Rent YoY
- ▲ 0.92%
- Metro
- Naples-Marco Island, FL
- State GDP YoY
- ▲ 3.28%
- F500 in state
- 36
Industry mix (Fortune 500 HQ in FL)
| Industry | F500 HQs | Revenue |
|---|---|---|
| Industrial Technology | 2 | $29B |
|
||
| Insurance | 2 | $17B |
|
||
| Retail | 1 | $60B |
|
||
| Technology Distribution | 1 | $58B |
|
||
| Homebuilding | 1 | $35B |
|
||
| Technology Manufacturing | 1 | $35B |
|
||
Price history
+375.0% since first listed9 events — show timeline
- 2026-05-28 Listed $275,000 NAPLESMLS
- 2026-05-22 Listed for Rent $1,900 NAPLESMLS
- 2024-08-30 Sold (Public Records) $265,000 Public Records
- 2015-05-14 Listed $229,900 FORTMLS
- 2008-04-15 Sold (Public Records) $130,000 Public Records
- 2006-10-30 Listing Removed — FORTMLS
- 2003-06-02 Sold (Public Records) $101,500 Public Records
- 1998-12-22 Sold (Public Records) $63,400 Public Records
- 1989-09-01 Sold (Public Records) $57,900 Public Records
Property tax history
+18.6%/yrLatest (2025): $2,091 · +12.5% YoY. Source: county tax records.
Cash-flow waterfall
monthlySold comps — $/sqft
last 12 mo · ≤1 miLoading sold comps…