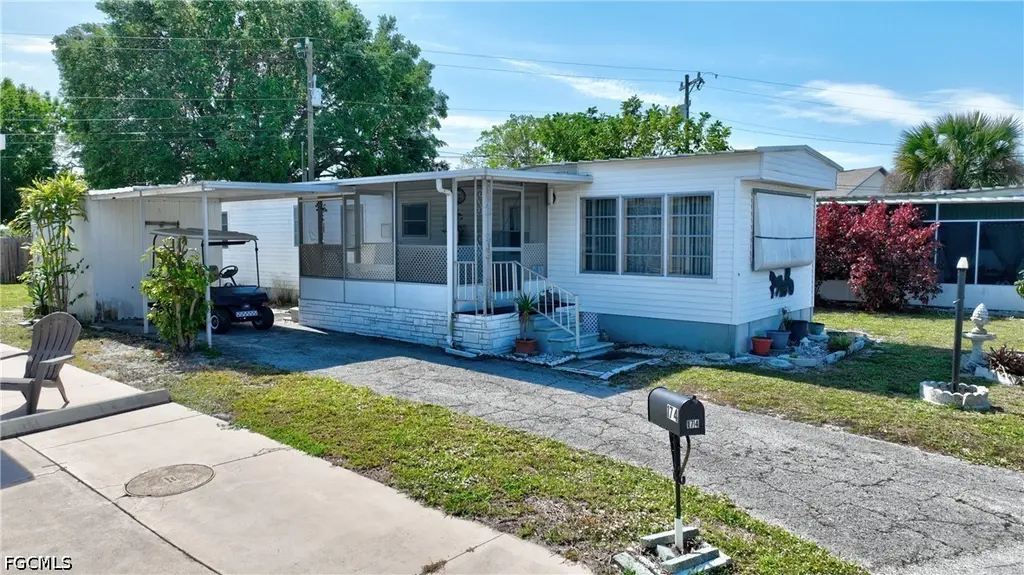
174 Santa Fe Trl · North Fort Myers, FL
Flood risk 6/10 · Moderate
- FEMA flood zone
- AE
- Chance of flooding over 30 yrs
- 0.69%
- Est. flood insurance / yr
- $1,737 – $8,500
Fire risk 2/10 · Minimal
- Est. fire insurance / yr
- $947 – $1,759
Heat risk 10/10 · Severe
- Hot days now (above 107°F)
- 7 days/yr
- Hot days in 30 yrs
- 29 days/yr
Wind risk 10/10 · Severe
- Chance of severe wind over 30 yrs
- 99.0%
Air-quality risk 2/10 · Minimal
- Unhealthy air days now
- 1 days/yr
- Unhealthy air days in 30 yrs
- 1 days/yr
Risk factors via First Street. Map © Google.
Why this score? — see what drove the B grade
The composite is a weighted blend of 9 inputs, each scored 0–100. Each bar is that input's sub-score; the figure is the points it added to the 100-point composite (weight × sub-score).
- Cash flow +30.0/30.0
- 1% rule +10.0/10.0
- DSCR +10.0/10.0
- ARV discount +7.5/15.0
- Schools +4.1/10.0
- Livability +3.7/5.0
- Rent growth +3.2/5.0
- Condition / age +2.5/5.0
- Appreciation +0.0/10.0
$55,000
🖨 Deal sheet 📄 Offer letter ✓ Due diligence
Listing remarks MLS
Own your land here folks! Attention Snowbirds and Full Timers: 2 bedroom 1 bath Manufactured home located in Carriage Village, a 55+ ACTIVE community! Have it all here, for $70 per month HOA. Come see this affordable property. Lots of potential. Well kept.
Key facts
- Own your own land
- Billiards room
- Hobby shop
Tags
Property features AI
Finance
- Other: Community pool
- Financial info: Pets allowed: conditional (call for details)
- HOA & community: Monthly association fee of $95; Association covers legal/accounting, recreation facilities, reserve fund, and trash; Community amenities include clubhouse, pool, billiard room, hobby room, library, shuffleboard court, and RV/boat storage; On-site management; Senior community
Exterior
- Parking: Attached carport (1 covered space); Has carport (1 space)
- Utilities: Public water; Public sewer; Cable available
- Home design: Manufactured home; Single-story; Entry level 1; Northeast facing; Resale property
- Construction: Metal roof; Vinyl siding; Built as manufactured housing
- Exterior features: Lanai; Porch; Screened porch; Oversized lot; Southwest exposure
Interior
- Kitchen: Electric cooktop; Range; Microwave; Refrigerator; Eat-in kitchen
- Bedrooms: Den (additional living space); Screened porch (additional living space)
- Flooring: Carpet; Tile
- Bathrooms: 1 full bathroom
- Heating & cooling: Central heating (electric); Central air conditioning (electric)
- Interior features: Furnished; Built-in features; Dual sinks; Eat-in kitchen; Shower only with separate shower; Single-hung windows
Neighborhood map
What this means for you Summary
Snapshot
- This is a 1-bed/1.0-bath manufactured listed at $55k.
Deal economics
- At list price, monthly cash flow is $21 ($249/yr) — positive.
- The deal already cash-flows at list — no discount required.
- Meets the 1% rule at list price ($1k rent vs $55k).
- Recommended offer: $52k (6.0% below list) — sets the bar for market timing.
- Cap rate 16.1% vs local median 3.6% in North Fort Myers — top-decile yield for the area; either an underpriced asset or a hidden risk that comps aren't pricing in. Stress-test before assuming the spread holds.
Location & tenants
- Location reads 74/100 on livability (#269 in FL, #4,409 nationally) — a middle-class / working-renter tenant base. Strengths: cost of living A+, housing A+, health & safety A+; Watch: employment C-, amenities F, commute F.
- Lee (suburban): math 47% / reading 50% proficiency, ranked #42 of 73 in FL (top 58%) — families likely to look elsewhere, expect single-tenant / working-renter base with shorter leases.
- Market conditions: Rents rising (+2.6%/yr); 841 active listings in the ZIP; 8 comparable units currently listed for rent nearby; rentals at typical pace (median 24d on market — plan ~3-4 weeks tenant-placement turnaround); 15,411 units permitted in Lee County in 2024 (4,686 in 5+ unit buildings).
Forward outlook
- Local home prices are declining (-3.0%/yr); year-one equity from $380 of loan paydown is wiped out by about $2k of value loss. Plan a longer hold.
- Lee County population projected at +44% by 2050 — long-run rental-demand tailwind backs the buy-and-hold thesis.
Negotiation context
- It's been on market 64 days — a 6% lower offer ($52k) is reasonable based on typical stale-listing flexibility.
- 3 sale attempts since 9y ago with the ask held roughly flat each time — persistent listings suggest the price (not the market) is what's stuck; bring a comps-based counter.
- Current owner paid $25k; list at $55k implies a 120% gain — meaningful room to come down on a strong offer.
Risks & watch-outs
- Watch-outs: flood insurance adds $427/mo.
- Climate carrying-cost: in FEMA flood zone AE (mandatory federal flood insurance); severe wind risk, 99% chance of damaging wind over 30y; extreme-heat days projected 7→29/yr by 2055 (HVAC capex compounding) — expect insurance premiums to compound above CPI over the hold.
Questions for the listing agent
- It's been on market 64 days. Have you received any prior offers? Is the seller open to a 6% concession, seller financing, or rate buy-down credit?
- Built in 1973 — when were the roof, HVAC, electrical panel, plumbing, and water heater last replaced?
- What's the actual annual flood-insurance premium (NFIP or private), and is the property in a SFHA with mandatory coverage?
- What does the HOA fee cover, when was the last increase, and are there any pending special assessments or reserve-fund shortfalls?
- Why hasn't it sold? Are there any deal-killer items the seller is aware of (foundation, flood, title, zoning, code violations)?
- Is there a deadline driving the sale (1031 exchange, divorce, estate, relocation)? That informs how much negotiation room exists.
- What's the average days-on-market for RENTAL listings here right now (not sales)? A rising rental-DOM trend means longer vacancies and softer asking-rent achievability than the comps imply.
- What's the recent tenant-quality profile in this submarket — average credit score on applications, eviction rate, late-payment / NSF rate, and stable-employment percentage? A property-management company in the area should have these aggregated.
- How much new for-sale + rental construction is in the pipeline within 1–3 miles? Heavy new supply typically softens prices + rents 12–24 months out; constrained supply supports both.
Investment metrics
- 1% rule
- 2.16% ✓
- Cap rate
- 16.05%
- Cash-on-cash
- 34.85%
- DSCR
- 2.55
- GRM
- 3.9
CMA / ARV
No comps found within radius.
Projected returns pro-forma
-3.0% appreciation · 2.63% rent growth · sell at horizon
- IRR
- -13.9%
- Equity multiple
- 0.50×
- Total profit
- $-7,685
- Equity at exit
- $8,201
- IRR
- -5.4%
- Equity multiple
- 0.65×
- Total profit
- $-5,372
- Equity at exit
- $4,755
Cash invested: $15,400 (down + closing). Projections, not guarantees.
Landlord ↔ Tenant lean methodology
- Overall (STATE)
- 87 Strongly Landlord-Friendly
- State Florida
- 87 Strongly Landlord-Friendly · R+3
- County
- — inherits STATE
- City
- — inherits STATE
ZIP-level market 33917
- Home prices YoY
- -30.2%
- Rents YoY
- 2.6%
- Active inventory
- 841
- Price-to-rent
- 3.9×
Monthly cashflow live
- Estimated rent
- $1,190 high interval (Pro) →
- Mortgage (P&I)
- −$288
- Tax from tax record
- −$86 /mo · $1,033/yr
- Insurance
- −$23
- Flood insurance flood zone
- −$427 /mo · $5,118/yr
- HOA
- −$95
- Vacancy / Maint / Mgmt
- −$250
- Net cashflow
- $21
Break-even live
UW: 25.0% down · 7.5% · 30yr · 1.5% tax · 5.0% vac · 8.0% maint · 8.0% mgmt
Financing live
Cash to close
- Down payment
- $13,750
- Closing costs
- $1,650
- Reserves months
- —
- Total cash needed
- —
Loan-product check · same deal, 3 products live
Conventional
25% down · 7.5% · 30yr
- Down + closing
- —
- Monthly P&I
- —
- Monthly cashflow
- —
- DSCR
- —
- Eligible?
- —
Personal DTI + credit; lowest rate.
DSCR
20% down · 8.5% · 30yr
- Down + closing
- —
- Monthly P&I
- —
- Monthly cashflow
- —
- DSCR
- —
- Eligible?
- —
No personal income docs; deal must DSCR.
Hard money
10% down · 12.0% · 12mo
- Down + closing
- —
- Monthly P&I
- —
- Monthly cashflow
- —
- DSCR
- —
- Eligible?
- —
Short-term bridge; refi at stabilization.
Rent comps 8 comps
| Address | Beds | Baths | Sqft | Rent | $/sqft | DOM | Units | Dist |
|---|---|---|---|---|---|---|---|---|
| 1640 Daniels Dr Unit B North Fort Myers, FL | 1.0 | 1.0 | 400 | $1,099 | $2.75 | 24d | 1 | 0.53mi |
| 7535 McDaniel Dr North Fort Myers, FL | 2.0 | 1.0 | 644 | $850 | $1.32 | 14d | 1 | 0.79mi |
| 7535 McDaniel Dr North Fort Myers, FL | 2.0 | 1.0 | 644 | $850 | $1.32 | 24d | 1 | 0.79mi |
| 137 Lantern Pl North Fort Myers, FL | 1.0 | 1.0 | 580 | $975 | $1.68 | 3d | 1 | 0.82mi |
| 121 Coachlight Ln North Fort Myers, FL | 1.0 | 1.0 | 552 | $795 | $1.44 | 24d | 1 | 0.87mi |
| 249 Fireball Ln North Fort Myers, FL | 2.0 | 1.5 | 624 | $1,350 | $2.16 | 3d | 1 | 0.95mi |
| 240 W Mariana Ave Apt B North Fort Myers, FL | 1.0 | 1.0 | 600 | $1,295 | $2.16 | 24d | 1 | 1.34mi |
| 7869 Suncoast Dr North Fort Myers, FL | 2.0 | 1.0 | 564 | $850 | $1.51 | 2d | 1 | 1.45mi |
HOA detail
- Monthly dues
- $95 · $1,140/yr
Listing history 25 events
-
2026-06-17days on market $55,000 Active 64 DOM
-
2026-06-16days on market $55,000 Active 63 DOM
-
2026-06-15days on market $55,000 Active 62 DOM
-
2026-06-13days on market $55,000 Active 60 DOM
-
2026-06-10pricedays on market $55,000 Active 57 DOM
-
2026-06-09days on market $57,000 Active 56 DOM
-
2026-06-07days on market $57,000 Active 54 DOM
-
2026-06-03days on market $57,000 Active 50 DOM
-
2026-06-02days on market $57,000 Active 49 DOM
-
2026-06-01days on market $57,000 Active 48 DOM
-
2026-05-31days on market $57,000 Active 47 DOM
-
2026-04-14$57,000 Active
-
2026-03-20historical
-
2025-09-17price $74,500
-
2025-06-30price $84,500
-
2025-05-01price $89,500
-
2025-03-20$95,000 Active
-
2018-01-19soldstatus $25,000 Sold 259-char remark
Show marketing remark (259 chars)
Own your land here folks! Attention Snowbirds and Full Timers: 2 bedroom 1 bath Manufactured home located in Carriage Village, a 55+ ACTIVE community! Have it all here, for $70 per month HOA. Come see this affordable property. Lots of potential. Well kept.
-
2017-10-31historical 259-char remark
Show marketing remark (259 chars)
Own your land here folks! Attention Snowbirds and Full Timers: 2 bedroom 1 bath Manufactured home located in Carriage Village, a 55+ ACTIVE community! Have it all here, for $70 per month HOA. Come see this affordable property. Lots of potential. Well kept.
-
2017-10-20$39,900 Active 259-char remark
Show marketing remark (259 chars)
Own your land here folks! Attention Snowbirds and Full Timers: 2 bedroom 1 bath Manufactured home located in Carriage Village, a 55+ ACTIVE community! Have it all here, for $70 per month HOA. Come see this affordable property. Lots of potential. Well kept.
-
2002-02-06soldstatus $25,000
-
2002-01-06price $30,900
-
1999-04-06soldstatus $15,000
-
1998-02-23soldstatus $21,000
-
1997-04-30soldstatus $26,000
ⓘ Source: listings_history table (triggers on properties + properties_extension) + one-shot
backfill from property_details.listing_events for pre-trigger history.
Tax reassessment forecast FL · Resets to sale price
- Current annual tax
- $1,033 · $86/mo
- Projected year-2 tax
- $1,033 · $86/mo
- Expected delta
- $0/yr ($0/mo · 0.0%)
ⓘ Screening estimate from a state-policy table — verify with the county assessor before closing.
Climate risk First Street
- Flood 6/10 Major FEMA zone AE · 69% chance over 30 yrs
- Wildfire 2/10 Low
- Heat 10/10 Extreme 7 d/yr ≥107°F today · 29 d/yr by 30 yrs out
- Wind 10/10 Extreme 99% chance of damaging wind over 30 yrs
- Air quality 2/10 Low 1 unhealthy d/yr today · 1 by 30 yrs out
Nearby sold comps map
Loading sold comps map…
Walkable amenities ~0.75 mi
Loading nearby amenities…
Taxation est. · year 1
- Rental income
- $14,274
- − Mortgage interest
- −$3,081
- − Property taxes
- −$1,033
- − Insurance
- −$5,394
- − Repairs & maintenance
- −$1,142
- − Management
- −$1,142
- − HOA
- −$1,140
- − Depreciation
- −$1,600
- Taxable loss
- −$257
- Est. tax savings @ 24.0%
- +$62
- After-tax cash flow
- $310/yr
For passive investors: Depreciation is non-cash, so a rental often shows a tax loss while cash-flowing — sheltering income. Rental losses are passive: they offset passive income freely, and up to $25,000/yr can offset ordinary (W-2) income if you actively participate and your MAGI is under $100k (phasing out to $0 by $150k); unused losses carry forward. On sale, claimed depreciation is recaptured at up to 25%, and gains may owe capital-gains tax (a 1031 exchange can defer both). Figures are a year-1 estimate at your 24.0% rate — not tax advice; consult a CPA.
Schools (NCES district)
- District
- Lee
- NCES district ID
- 1201080
- Math proficiency
- 47% ▼ -11.00%
- Reading proficiency
- 50% ▼ -4.00%
- Median HH income
- $49,518
- Composite
- 41.49/100
- National rank
- #3458
- State rank
- #42 of 73 in FL
Livability — North Fort Myers
- Score
- 74/100
- State rank
- #269
- US rank
- #4409
Category grades
Schools grade is shown separately in the Schools card above.
Census & demographics
- Census place
- North Fort Myers, FL
- County
- Lee County · 788,662 people
- City population
- 57,035
- Metro
- Cape Coral-Fort Myers, FL
- Population (ZIP)
- 33,380
- Household income
- $55,000
- Rent vs Own
- Severe rent burden
- 775.0
Population outlook (Lee County) Hauer SSP2
- Today (2025)
- 871,946 people
- By 2030
- 955,468 · +9.6%
- By 2040
- 1,113,587 · +27.7%
- By 2050
- 1,256,891 · +44.1%
- By 2075
- 1,560,270 · +78.9%
- By 2100
- 1,726,848 · +98.0%
Race, ethnicity, and origin ACS 2023
- Neighborhood character
- Predominantly White (85%)
- Race & ethnicity
- White 85% Hispanic / Latino 10% Two or more races 7% Asian 1% Black 1%
- Hispanic origin (detail)
- Mexican 2% Puerto Rican 1% Cuban 3%
- Common ancestry
- Lithuanian 3% Romanian 3% Slovak 2%
- Foreign-born
- 10% · Canada
- Languages at home
- 88% English-only · Spanish 9% Other Indo-European 1% Russian/Polish/Slavic 1%
Political lean MEDSL · Lee
- 2024 margin
- Strong R (+28.4) · D 35.5% · R 63.9%
- 2008→2024 swing
- -18.0pp toward R · 2008: -10.4pp · 2024: -28.4pp
- All cycles
- 2024: R+28.4 2020: R+19.2 2016: R+20.4 2012: R+16.6 2008: R+10.4
Not yet ingested
- Civics
- —
Market trends
- HPI YoY
- ▼ -122.28%
- Current HPI
- 282.2895
- Rent YoY
- ▲ 2.63%
- Metro
- Cape Coral-Fort Myers, FL
- State GDP YoY
- ▲ 3.28%
- F500 in state
- 36
Industry mix (Fortune 500 HQ in FL)
| Industry | F500 HQs | Revenue |
|---|---|---|
| Industrial Technology | 2 | $29B |
|
||
| Insurance | 2 | $17B |
|
||
| Retail | 1 | $60B |
|
||
| Technology Distribution | 1 | $58B |
|
||
| Homebuilding | 1 | $35B |
|
||
| Technology Manufacturing | 1 | $35B |
|
||
Price history
+119.2% since first listed14 events — show timeline
- 2026-04-14 Listed $57,000 FORTMLS
- 2026-03-20 Listing Removed — FORTMLS
- 2025-09-17 Price Changed $74,500 FORTMLS
- 2025-06-30 Price Changed $84,500 FORTMLS
- 2025-05-01 Price Changed $89,500 FORTMLS
- 2025-03-20 Listed $95,000 FORTMLS
- 2018-01-19 Sold (MLS) $25,000 FORTMLS
- 2017-10-31 Listing Removed — FORTMLS
- 2017-10-20 Listed $39,900 FORTMLS
- 2002-02-06 Sold (MLS) $25,000 FORTMLS
- 2002-01-06 Price Changed $30,900 FORTMLS
- 1999-04-06 Sold (Public Records) $15,000 Public Records
- 1998-02-23 Sold (Public Records) $21,000 Public Records
- 1997-04-30 Sold (Public Records) $26,000 Public Records
Property tax history
+8.6%/yrLatest (2025): $1,033 · -3.0% YoY. Source: county tax records.
Cash-flow waterfall
monthlySold comps — $/sqft
last 12 mo · ≤1 miLoading sold comps…