1181 County Road 330 · Dumas, MS
Flood risk 9/10 · Severe
- FEMA flood zone
- X (unshaded)
- Chance of flooding over 30 yrs
- 0.99%
- Est. flood insurance / yr
- $507 – $1,088
Fire risk 6/10 · Moderate
- Est. fire insurance / yr
- $1,241 – $2,305
Heat risk 5/10 · Moderate
- Hot days now (above 108°F)
- 7 days/yr
- Hot days in 30 yrs
- 20 days/yr
Wind risk 4/10 · Minor
- Chance of severe wind over 30 yrs
- 21.0%
Air-quality risk 1/10 · Minimal
- Unhealthy air days now
- 0 days/yr
- Unhealthy air days in 30 yrs
- 0 days/yr
Risk factors via First Street. Map © Google.
Why this score? — see what drove the D grade
The composite is a weighted blend of 9 inputs, each scored 0–100. Each bar is that input's sub-score; the figure is the points it added to the 100-point composite (weight × sub-score).
- Cash flow +8.8/30.0
- ARV discount +7.5/15.0
- Appreciation +6.9/10.0
- Schools +4.2/10.0
- Livability +3.0/5.0
- 1% rule +2.7/10.0
- Rent growth +2.5/5.0
- Condition / age +2.5/5.0
- DSCR +2.4/10.0
$139,900
🖨 Deal sheet (PDF) 📄 Offer letter ✓ Due diligence
Listing remarks
Immaculate 3 bedroom 2 bath home sitting on approx. 1.6 acres +- in the East Union school district. Owner financing available with approved credit. All info believed to be accurate, subject to verification.
Key facts
- 1 acre lot
- Built 2023
- Listed 10 days
Property features AI
Finance
- Financial info: Annual taxes approximately $936
Exterior
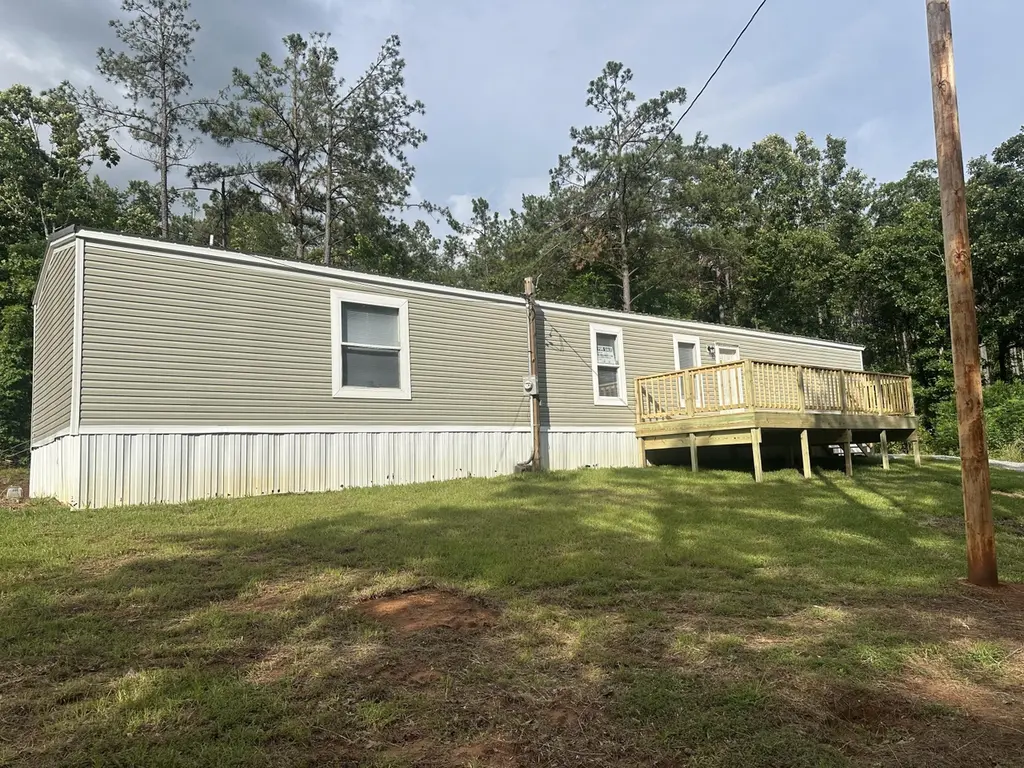
- Home design: Singlewide mobile home; Single-story
- Exterior features: Approximately 1.6 acre lot
Interior
- Bathrooms: 2 full bathrooms
- Heating & cooling: Central heating (electric); Central air conditioning
- Interior features: Electric water heater; 5 total rooms
Neighborhood map
What this means for you Summary
Snapshot
- This is a 3-bed/2.0-bath manufactured listed at $140k.
Deal economics
- At list price, monthly cash flow is $-181 ($-2k/yr) — negative.
- To cash-flow at today's rent, offer at most $114k (18.8% below list).
- To meet the 1% rule (rent ≥ 1% of price), the offer needs to be $108k (22.9% below list).
- Recommended offer: $108k (22.9% below list) — sets the bar for 1% rule.
Location & tenants
- Location reads 60/100 on livability (#217 in MS) — a middle-class / working-renter tenant base. Strengths: cost of living A+, housing A+, crime B; Watch: employment D, schools F, amenities F.
- Union County School District (rural): math 54% / reading 48% proficiency, ranked #13 of 130 in MS (top 10%) — acceptable for families but not a draw, mixed tenant base, ~2y average lease.
- Market conditions: 59 active listings in the ZIP; 17 units permitted in Union County in 2024 (0 in 5+ unit buildings).
Forward outlook
- In year one you build about $6k of equity ($967 loan paydown + $5k appreciation (3.8% local appreciation)).
- Union County population projected at +19% by 2050 — long-run rental-demand tailwind backs the buy-and-hold thesis.
- By year 6, paydown + projected appreciation supports a ~$33k cash-out refi (75% LTV) — recoverable capital for the next deal without selling this one.
Negotiation context
- Only 11 days on market — expect competitive offers; lowballing is unlikely to land.
Risks & watch-outs
- Watch-outs: flood insurance adds $66/mo.
- Climate carrying-cost: severe flood risk; major wildfire risk; extreme-heat days projected 7→20/yr by 2055 (HVAC capex compounding) — expect insurance premiums to compound above CPI over the hold.
Questions for the listing agent
- What do current leases actually rent for vs. the listed asking? Can we see a recent rent roll and the last 12 months of T-12 income?
- What's the actual annual flood-insurance premium (NFIP or private), and is the property in a SFHA with mandatory coverage?
- Is there a deadline driving the sale (1031 exchange, divorce, estate, relocation)? That informs how much negotiation room exists.
- Schools are F-rated, which usually means shorter tenancies and higher turnover. Who's the typical renter profile here, and what's been the actual vacancy rate?
- The area grade is low — what's the realistic commute time and amenity access for the typical tenant pool here? Any planned neighborhood developments (good or bad) we should know about?
- What's the average days-on-market for RENTAL listings here right now (not sales)? A rising rental-DOM trend means longer vacancies and softer asking-rent achievability than the comps imply.
- What's the recent tenant-quality profile in this submarket — average credit score on applications, eviction rate, late-payment / NSF rate, and stable-employment percentage? A property-management company in the area should have these aggregated.
- How much new for-sale + rental construction is in the pipeline within 1–3 miles? Heavy new supply typically softens prices + rents 12–24 months out; constrained supply supports both.
Investment metrics
- 1% rule
- 0.77% ✗
- Cap rate
- 5.31%
- Cash-on-cash
- -3.52%
- DSCR
- 0.84
- GRM
- 10.8
CMA / ARV
No comps found within radius.
Projected returns pro-forma
3.75% appreciation · 3.0% rent growth · sell at horizon
- IRR
- 4.7%
- Equity multiple
- 1.28×
- Total profit
- $10,964
- Equity at exit
- $68,867
- IRR
- 7.5%
- Equity multiple
- 2.24×
- Total profit
- $48,601
- Equity at exit
- $111,022
Cash invested: $39,172 (down + closing). Projections, not guarantees.
Landlord ↔ Tenant lean methodology
- Overall (STATE)
- 90 Strongly Landlord-Friendly
- State Mississippi
- 90 Strongly Landlord-Friendly · R+11
- County
- — inherits STATE
- City
- — inherits STATE
ZIP-level market 38824
- Home prices YoY
- 2.4%
- Active inventory
- 59
- Price-to-rent
- 10.8×
Monthly cashflow live
- Estimated rent
- $1,078 medium interval (Pro) →
- Mortgage (P&I)
- −$734
- Tax est. 1.5%
- −$175 /mo · $2,098/yr
- Insurance
- −$58
- Flood insurance flood zone
- −$66 /mo · $798/yr
- HOA
- −$0
- Vacancy / Maint / Mgmt
- −$226
- Net cashflow
- $-181
Break-even live
Sensitivity live
| Price | -10% $-85 | -5% $-133 | +0% $-181 | +5% $-230 | +10% $-278 |
|---|---|---|---|---|---|
| Rent | -10% $-267 | -5% $-224 | +0% $-181 | +5% $-139 | +10% $-96 |
| Rate | -1.0pp $-111 | -0.5pp $-146 | base $-181 | +0.5pp $-218 | +1.0pp $-254 |
UW: 25.0% down · 7.5% · 30yr · 1.5% tax · 5.0% vac · 8.0% maint · 8.0% mgmt
Financing live
Cash to close
- Down payment
- $34,975
- Closing costs
- $4,197
- Reserves months
- —
- Total cash needed
- —
Loan-product check · same deal, 3 products live
Conventional
25% down · 7.5% · 30yr
- Down + closing
- —
- Monthly P&I
- —
- Monthly cashflow
- —
- DSCR
- —
- Eligible?
- —
Personal DTI + credit; lowest rate.
DSCR
20% down · 8.5% · 30yr
- Down + closing
- —
- Monthly P&I
- —
- Monthly cashflow
- —
- DSCR
- —
- Eligible?
- —
No personal income docs; deal must DSCR.
Hard money
10% down · 12.0% · 12mo
- Down + closing
- —
- Monthly P&I
- —
- Monthly cashflow
- —
- DSCR
- —
- Eligible?
- —
Short-term bridge; refi at stabilization.
Listing history 7 events
-
2026-06-19days on market $139,900 Active 11 DOM
-
2026-06-18days on market $139,900 Active 10 DOM
-
2026-06-17days on market $139,900 Active 9 DOM
-
2026-06-16days on market $139,900 Active 8 DOM
-
2026-06-16status $139,900 Active 7 DOM
-
2026-06-01statusdays on market $139,900 Pending 7 DOM
-
2026-05-22$139,900 Active
ⓘ Source: listings_history table (triggers on properties + properties_extension) + one-shot
backfill from property_details.listing_events for pre-trigger history.
Climate risk First Street
- Flood 9/10 Extreme FEMA zone X (unshaded) · 99% chance over 30 yrs
- Wildfire 6/10 Major
- Heat 5/10 Major 7 d/yr ≥108°F today · 20 d/yr by 30 yrs out
- Wind 4/10 Moderate 21% chance of damaging wind over 30 yrs
- Air quality 1/10 Low 0 unhealthy d/yr today · 0 by 30 yrs out
Nearby sold comps map
Loading sold comps map…
Walkable amenities ~0.75 mi
Loading nearby amenities…
Taxation est. · year 1
- Rental income
- $12,941
- − Mortgage interest
- −$7,837
- − Property taxes
- −$2,098
- − Insurance
- −$1,497
- − Repairs & maintenance
- −$1,035
- − Management
- −$1,035
- − Depreciation
- −$4,070
- Taxable loss
- −$4,632
- Est. tax savings @ 24.0%
- +$1,112
- After-tax cash flow
- $-1,065/yr
For passive investors: Depreciation is non-cash, so a rental often shows a tax loss while cash-flowing — sheltering income. Rental losses are passive: they offset passive income freely, and up to $25,000/yr can offset ordinary (W-2) income if you actively participate and your MAGI is under $100k (phasing out to $0 by $150k); unused losses carry forward. On sale, claimed depreciation is recaptured at up to 25%, and gains may owe capital-gains tax (a 1031 exchange can defer both). Figures are a year-1 estimate at your 24.0% rate — not tax advice; consult a CPA.
Schools (NCES district)
- District
- Union County School District
- NCES district ID
- 2804350
- Math proficiency
- 54% ▼ -15.00%
- Reading proficiency
- 48% ▼ -11.00%
- Median HH income
- $37,935
- Composite
- 42.49/100
- National rank
- #3209
- State rank
- #13 of 130 in MS
Livability — Dumas
- Score
- 60/100
- State rank
- #217
- US rank
- #18856
Category grades
Schools grade is shown separately in the Schools card above.
Census & demographics
- City population
- 1,875
- Population (ZIP)
- 7,900
Population outlook (Union County) Hauer SSP2
- Today (2025)
- 30,992 people
- By 2030
- 32,294 · +4.2%
- By 2040
- 34,789 · +12.3%
- By 2050
- 36,987 · +19.3%
- By 2075
- 40,835 · +31.8%
- By 2100
- 40,538 · +30.8%
Race, ethnicity, and origin ACS 2023
- Neighborhood character
- Predominantly White (70%)
- Race & ethnicity
- White 70% Black 20% Two or more races 6% Hispanic / Latino 2% Asian 1%
- Common ancestry
- Iranian 1% Slovak 1%
- Foreign-born
- 2% · China
- Languages at home
- 94% English-only · Chinese 3% Other Indo-European 1% German/W. Germanic 1%
Political lean MEDSL · Union
- 2024 margin
- Solid R (+70.1) · D 14.5% · R 84.6%
- 2008→2024 swing
- -20.2pp toward R · 2008: -49.9pp · 2024: -70.1pp
- All cycles
- 2024: R+70.1 2020: R+64.8 2016: R+63.2 2012: R+51.0 2008: R+49.9
Not yet ingested
- Civics
- —
Market trends
- HPI YoY
- ▲ 3.75%
- Current HPI
- 159.5191
- Rent YoY
- —
- Metro
- —
- State GDP YoY
- —
- F500 in state
- 0
Price history
1 event — show timeline
- 2026-05-22 Listed $139,900 NEMSBD
Cash-flow waterfall
monthlySold comps — $/sqft
last 12 mo · ≤1 miLoading sold comps…