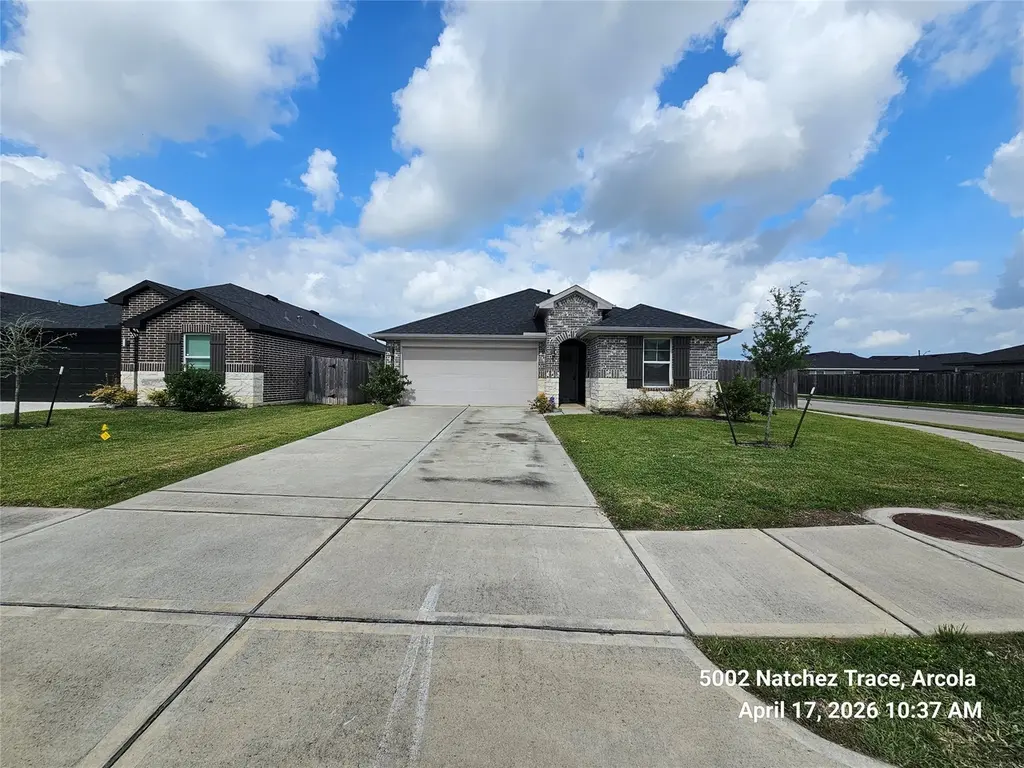
5002 Natchez Trce · Arcola, TX
Flood risk 6/10 · Moderate
- FEMA flood zone
- X (unshaded)
- Chance of flooding over 30 yrs
- 0.72%
- Est. flood insurance / yr
- $507 – $1,088
Fire risk 5/10 · Moderate
- Est. fire insurance / yr
- $1,222 – $2,270
Heat risk 9/10 · Severe
- Hot days now (above 111°F)
- 7 days/yr
- Hot days in 30 yrs
- 23 days/yr
Wind risk 9/10 · Severe
- Chance of severe wind over 30 yrs
- 99.0%
Air-quality risk 2/10 · Minimal
- Unhealthy air days now
- 2 days/yr
- Unhealthy air days in 30 yrs
- 2 days/yr
Risk factors via First Street. Map © Google.
Why this score? — see what drove the B grade
The composite is a weighted blend of 9 inputs, each scored 0–100. Each bar is that input's sub-score; the figure is the points it added to the 100-point composite (weight × sub-score).
- Cash flow +25.3/30.0
- ARV discount +15.0/15.0
- DSCR +8.3/10.0
- 1% rule +7.0/10.0
- Schools +4.5/10.0
- Appreciation +4.0/10.0
- Condition / age +3.8/5.0
- Livability +2.7/5.0
- Rent growth +2.3/5.0
$205,000
🖨 Deal sheet (PDF) 📄 Offer letter ✓ Due diligence
Listing remarks
Welcome to 5002 Natchez Trace — a home nestled in the established community of Fresno. This spacious property offers a functional floor plan with generous living areas, abundant natural light, and comfortable spaces for both everyday living and entertaining. The kitchen provides ample cabinetry and workspace. Enjoy a large backyard with room for outdoor gatherings, pets, or future customization. Conveniently located with easy access to major highways, shopping, dining, schools, and nearby employment centers, this home combines suburban comfort with everyday convenience. A fantastic opportunity to own a home in a growing area of Fort Bend County.
Key facts
- Ample cabinetry
- Large backyard
- 7,148 sq ft lot
Tags
Property features AI
Finance
- HOA & community: Community pool; Post Oak Property Management oversees the association; Annual association fee of $715
Exterior
- Parking: Attached 2-car garage
- Security: Smoke detectors
- Utilities: Public water; Public sewer
- Home design: Residential property; Built in 2022; Slab foundation; Composition roof
- Construction: Brick, stone, and wood siding exterior
- Exterior features: Covered patio; Patio; Deck; Private yard; Fenced backyard; Corner lot; Side yard; Subdivision setting
Interior
- Kitchen: Dishwasher; Microwave
- Bedrooms: 3 bedrooms (possible)
- Flooring: Tile
- Bathrooms: 2 full bathrooms
- Heating & cooling: Central gas heating; Central electric air conditioning
- Interior features: Granite counters; Kitchen island; Pantry; Tub with shower
- Laundry & utility: Washer hookup; Electric dryer hookup
Neighborhood map
What this means for you Summary
Snapshot
- This is a 3-bed/2.0-bath single-family listed at $205k. Condition is rated good.
Deal economics
- At list price, monthly cash flow is $463 ($6k/yr) — positive.
- The deal already cash-flows at list — no discount required.
- Meets the 1% rule at list price ($2k rent vs $205k).
- Cap rate 9.0% vs local median 5.0% in Arcola — top-decile yield for the area; either an underpriced asset or a hidden risk that comps aren't pricing in. Stress-test before assuming the spread holds.
Location & tenants
- Location reads 53/100 on livability (#1,425 in TX) — a working-class tenant base; expect higher turnover. Strengths: cost of living A+, housing A; Watch: employment C-, crime F, amenities F.
- Fort Bend ISD (suburban): math 44% / reading 53% proficiency, ranked #140 of 826 in TX (top 17%) — families likely to look elsewhere, expect single-tenant / working-renter base with shorter leases.
- Zoned schools: Heritage Rose El (math 29% / reading 28%, grade F, #2,706 of 4,322 statewide, top 63%, 1,209 students, 83% FRL); Billy Baines Middle (math 47% / reading 53%, grade C, #347 of 1,662 statewide, top 21%, 1,296 students, 37% FRL) — zoned schools average 60% FRL vs 35% district-wide (25 pts higher); higher-poverty schools than district average — tighter screening recommended.
- Market conditions: Rents soft (-0.9%/yr); 175 active listings in the ZIP; 9 comparable units currently listed for rent nearby; rentals lingering (median 44d on market — plan ~5-8 weeks vacancy on turnover, expect pricing pressure); 67% of comp listings sitting > 30 days — soft ceiling on asking rent; solid renter incomes; 12,093 units permitted in Fort Bend County in 2024 (815 in 5+ unit buildings).
- This rent runs 31% of the median local income ($94k/yr) — at the standard rent-burdened threshold; future hikes will face affordability resistance.
Forward outlook
- Local home prices are declining (-2.0%/yr); year-one equity from $1k of loan paydown is wiped out by about $4k of value loss. Plan a longer hold.
- Fort Bend County population projected at +75% by 2050 — long-run rental-demand tailwind backs the buy-and-hold thesis.
Negotiation context
- Only 7 days on market — expect competitive offers; lowballing is unlikely to land.
Risks & watch-outs
- Climate carrying-cost: major flood risk; severe wind risk, 99% chance of damaging wind over 30y; moderate wildfire risk; extreme-heat days projected 7→23/yr by 2055 (HVAC capex compounding) — expect insurance premiums to compound above CPI over the hold.
Questions for the listing agent
- What does the HOA fee cover, when was the last increase, and are there any pending special assessments or reserve-fund shortfalls?
- Is there a deadline driving the sale (1031 exchange, divorce, estate, relocation)? That informs how much negotiation room exists.
- Schools are F-rated, which usually means shorter tenancies and higher turnover. Who's the typical renter profile here, and what's been the actual vacancy rate?
- Crime grade is F in this area — have there been break-ins, vandalism, or insurance claims at this property in the last 3 years? What carrier currently insures it and at what premium?
- What's the average days-on-market for RENTAL listings here right now (not sales)? A rising rental-DOM trend means longer vacancies and softer asking-rent achievability than the comps imply.
- What's the recent tenant-quality profile in this submarket — average credit score on applications, eviction rate, late-payment / NSF rate, and stable-employment percentage? A property-management company in the area should have these aggregated.
- How much new for-sale + rental construction is in the pipeline within 1–3 miles? Heavy new supply typically softens prices + rents 12–24 months out; constrained supply supports both.
Investment metrics
- 1% rule
- 1.20% ✓
- Cap rate
- 9.00%
- Cash-on-cash
- 9.68%
- DSCR
- 1.43
- GRM
- 7.0
CMA / ARV
- ARV (on-the-fly)
- $287,007
- Comps found
- 12
Show comp detail 12 sales within ~0.75 mi
| Address | Dist | Beds/Ba | Sqft | Sold | Price | $/sf | Match |
|---|---|---|---|---|---|---|---|
| 5010 Pine Haven Ln | 0.06mi | 4/2.0 (+1) | 1,732 (+4%) | 6mo | $299,900 | $173 | 80 |
| 4927 Oakwood Dr | 0.16mi | 3/2.0 | 1,595 (-4%) | 8mo | $324,990 | $204 | 80 |
| 4922 Oakwood Dr | 0.18mi | 4/2.0 (+1) | 1,680 (+1%) | 7mo | $329,990 | $196 | 79 |
| 4946 Pine Haven Ln | 0.09mi | 4/2.0 (+1) | 1,847 (+11%) | 0mo | $319,000 | $173 | 72 |
| 4918 Natchez Trce | 0.12mi | 3/2.0 | 1,440 (-13%) | 4mo | $245,000 | $170 | 69 |
| 5014 Balcolm Dr | 0.17mi | 4/2.0 (+1) | 1,778 (+7%) | 9mo | $332,990 | $187 | 68 |
| 4919 Oakwood Dr | 0.17mi | 4/2.5 (+1) | 1,831 (+10%) | 8mo | $339,990 | $186 | 61 |
| 4426 Eaglewood Trail Dr | 0.67mi | 3/2.0 | 1,696 (+2%) | 6mo | $240,000 | $142 | 60 |
| 4527 Green Fawn Ln | 0.55mi | 3/2.0 | 1,540 (-7%) | 3mo | $225,000 | $146 | 60 |
| 4615 Pleasant Trl | 0.52mi | 3/2.0 | 1,540 (-7%) | 9mo | $234,760 | $152 | 56 |
| 4730 Hardwood Glen Dr | 0.51mi | 4/2.0 (+1) | 1,867 (+12%) | 2mo | $260,000 | $139 | 49 |
| 1603 Bonnie Lea Ln | 0.64mi | 3/2.0 | 1,878 (+13%) | 2mo | $225,000 | $120 | 47 |
Match score weights: distance 35% · size 25% · config 20% · recency 20%. Top-matched comps best support the ARV.
Projected returns pro-forma
-1.98% appreciation · 0.0% rent growth · sell at horizon
- IRR
- -0.9%
- Equity multiple
- 0.97×
- Total profit
- $-1,993
- Equity at exit
- $39,997
- IRR
- 3.9%
- Equity multiple
- 1.29×
- Total profit
- $16,636
- Equity at exit
- $34,355
Cash invested: $57,400 (down + closing). Projections, not guarantees.
Landlord ↔ Tenant lean methodology
- Overall (STATE)
- 87 Strongly Landlord-Friendly
- State Texas
- 87 Strongly Landlord-Friendly · R+5
- County
- — inherits STATE
- City
- — inherits STATE
ZIP-level market 77545
- Home prices YoY
- -0.8%
- Rents YoY
- -0.9%
- Active inventory
- 175
- Price-to-rent
- 7.0×
Monthly cashflow live
- Estimated rent
- $2,455 high interval (Pro) →
- Mortgage (P&I)
- −$1,075
- Tax est. 1.5%
- −$256 /mo · $3,075/yr
- Insurance
- −$85
- HOA
- −$60
- Vacancy / Maint / Mgmt
- −$516
- Net cashflow
- $463
Break-even live
Sensitivity live
| Price | -10% $605 | -5% $534 | +0% $463 | +5% $392 | +10% $321 |
|---|---|---|---|---|---|
| Rent | -10% $269 | -5% $366 | +0% $463 | +5% $560 | +10% $657 |
| Rate | -1.0pp $566 | -0.5pp $515 | base $463 | +0.5pp $410 | +1.0pp $356 |
UW: 25.0% down · 7.5% · 30yr · 1.5% tax · 5.0% vac · 8.0% maint · 8.0% mgmt
Financing live
Cash to close
- Down payment
- $51,250
- Closing costs
- $6,150
- Reserves months
- —
- Total cash needed
- —
Loan-product check · same deal, 3 products live
Conventional
25% down · 7.5% · 30yr
- Down + closing
- —
- Monthly P&I
- —
- Monthly cashflow
- —
- DSCR
- —
- Eligible?
- —
Personal DTI + credit; lowest rate.
DSCR
20% down · 8.5% · 30yr
- Down + closing
- —
- Monthly P&I
- —
- Monthly cashflow
- —
- DSCR
- —
- Eligible?
- —
No personal income docs; deal must DSCR.
Hard money
10% down · 12.0% · 12mo
- Down + closing
- —
- Monthly P&I
- —
- Monthly cashflow
- —
- DSCR
- —
- Eligible?
- —
Short-term bridge; refi at stabilization.
Rent comps 9 comps
| Address | Beds | Baths | Sqft | Rent | $/sqft | DOM | Units | Dist |
|---|---|---|---|---|---|---|---|---|
| 4931 Natchez Trce Fresno, TX | 4.0 | 2.0 | 1835 | $2,350 | $1.28 | 44d | 1 | 0.10mi |
| 1402 Windom Court Way Fresno, TX | 4.0 | 2.5 | 1831 | $2,300 | $1.26 | 44d | 1 | 0.21mi |
| 11727 Highway 6 Fresno, TX | 1.0–3.0 | 1.0–2.0 | 962 | $2,929 | $3.04 | 5d | 15 | 0.81mi |
| 919 Yorkshire Holw Fresno, TX | 3.0 | 2.0 | 1506 | $2,100 | $1.39 | 44d | 1 | 0.96mi |
| 4619 Monarch Blue Ln Fresno, TX | 3.0 | 2.5 | 1933 | $1,846 | $0.95 | 44d | 1 | 1.05mi |
| 3932 Teal Run Place Ct Fresno, TX | 4.0 | 2.0 | 1914 | $2,150 | $1.12 | 44d | 1 | 1.15mi |
| 2703 Facet Creek Dr Fresno, TX | 4.0 | 2.0 | 2099 | $2,306 | $1.10 | 5d | 1 | 1.24mi |
| 2403 Orchard Run Fresno, TX | 3.0 | 2.0 | 1459 | $2,800 | $1.92 | 4d | 1 | 1.48mi |
| 3623 Elmwood Dale Dr Fresno, TX | 3.0 | 2.0 | 1545 | $1,765 | $1.14 | 44d | 1 | 1.50mi |
HOA detail
- Monthly dues
- $60 · $720/yr
Listing history 6 events
-
2026-06-08statusdays on market $205,000 Pending 7 DOM
-
2026-06-07days on market $205,000 Active 6 DOM
-
2026-06-04days on market $205,000 Active 3 DOM
-
2026-06-03days on market $205,000 Active 2 DOM
-
2026-06-02remarks 653-char remark
-
2026-06-02$205,000 Active 1 DOM
ⓘ Source: listings_history table (triggers on properties + properties_extension) + one-shot
backfill from property_details.listing_events for pre-trigger history.
Climate risk First Street
- Flood 6/10 Major FEMA zone X (unshaded) · 72% chance over 30 yrs
- Wildfire 5/10 Major
- Heat 9/10 Extreme 7 d/yr ≥111°F today · 23 d/yr by 30 yrs out
- Wind 9/10 Extreme 99% chance of damaging wind over 30 yrs
- Air quality 2/10 Low 2 unhealthy d/yr today · 2 by 30 yrs out
Nearby sold comps map
Loading sold comps map…
Walkable amenities ~0.75 mi
Loading nearby amenities…
Taxation est. · year 1
- Rental income
- $29,463
- − Mortgage interest
- −$11,483
- − Property taxes
- −$3,075
- − Insurance
- −$1,025
- − Repairs & maintenance
- −$2,357
- − Management
- −$2,357
- − HOA
- −$720
- − Depreciation
- −$5,964
- Taxable income
- $2,482
- Est. tax owed @ 24.0%
- −$596
- After-tax cash flow
- $4,959/yr
For passive investors: Depreciation is non-cash, so a rental often shows a tax loss while cash-flowing — sheltering income. Rental losses are passive: they offset passive income freely, and up to $25,000/yr can offset ordinary (W-2) income if you actively participate and your MAGI is under $100k (phasing out to $0 by $150k); unused losses carry forward. On sale, claimed depreciation is recaptured at up to 25%, and gains may owe capital-gains tax (a 1031 exchange can defer both). Figures are a year-1 estimate at your 24.0% rate — not tax advice; consult a CPA.
Condition & rehab AI · 1 photo
This single-family home in Arcola, TX, is in good condition with minor repairs needed in the kitchen and bathrooms. It offers a good investment opportunity with updates that can significantly increase its value.
Repairs flagged
- Minor Kitchen cabinets — Worn appearance
- Minor Bathroom fixtures — Signs of wear
Value-add opportunities
- Both Paint interior walls — Fresh paint enhances curb appeal and interior aesthetics
- Resale Replace worn kitchen cabinets — New cabinets improve functionality and appearance
- Resale Upgrade bathroom fixtures — Modern fixtures enhance the home's appeal and functionality
Renovation cost estimate screening
| Repair item | Severity | Est. cost |
|---|---|---|
| Kitchen cabinets · Worn appearance | Minor | $500–3,000 |
| Bathroom fixtures · Signs of wear | Minor | $500–3,000 |
| Total estimated repair cost · 2 items | $1,000–6,000 |
Value-add ROI direction
- Both Paint interior walls — Fresh paint enhances curb appeal and interior aesthetics ↑
- Resale Replace worn kitchen cabinets — New cabinets improve functionality and appearance ↑
- Resale Upgrade bathroom fixtures — Modern fixtures enhance the home's appeal and functionality ↑
ⓘ Cost ranges are severity-bucket heuristics (US national rule-of-thumb). Get contractor quotes + a written scope before underwriting a rehab budget.
Schools (NCES district)
- District
- Fort Bend ISD
- NCES district ID
- 4819650
- Math proficiency
- 44% ▼ -15.00%
- Reading proficiency
- 53% ▼ -4.00%
- Median HH income
- $82,360
- Composite
- 44.61/100
- National rank
- #2779
- State rank
- #140 of 826 in TX
Livability — Arcola
- Score
- 53/100
- State rank
- #1425
- US rank
- #24358
Category grades
Schools grade is shown separately in the Schools card above.
Census & demographics
- Census place
- Arcola, TX
- County
- Fort Bend County · 836,777 people
- Metro
- Houston-The Woodlands-Sugar Land, TX
- Population (ZIP)
- 26,236
- Household income
- $94,474
- Rent vs Own
- Severe rent burden
- 360.0
Population outlook (Fort Bend County) Hauer SSP2
- Today (2025)
- 1,004,526 people
- By 2030
- 1,153,104 · +14.8%
- By 2040
- 1,453,718 · +44.7%
- By 2050
- 1,753,781 · +74.6%
- By 2075
- 2,455,772 · +144.5%
- By 2100
- 2,930,528 · +191.7%
Race, ethnicity, and origin ACS 2023
- Neighborhood character
- Diverse neighborhood (Simpson 0.61)
- Race & ethnicity
- Black 51% Hispanic / Latino 34% Two or more races 12% White 8% Asian 2%
- Hispanic origin (detail)
- Mexican 29%
- Common ancestry
- Portuguese 1%
- Foreign-born
- 18% · Canada
- Languages at home
- 67% English-only · Spanish 29% Other Asian/Pacific 1% Other Indo-European 1%
Political lean MEDSL · Fort Bend
- 2024 margin
- Toss-up / Even · D 49.5% · R 47.9% · Other 2.6%
- 2008→2024 swing
- +4.0pp toward D · 2008: -2.4pp · 2024: 1.6pp
- All cycles
- 2024: D+1.6 2020: D+10.6 2016: D+6.6 2012: R+6.8 2008: R+2.4
Not yet ingested
- Civics
- —
Market trends
- HPI YoY
- ▼ -1.98%
- Current HPI
- 231.3921
- Rent YoY
- ▼ -0.95%
- Metro
- Houston-The Woodlands-Sugar Land, TX
- State GDP YoY
- ▲ 3.95%
- F500 in state
- 110
Industry mix (Fortune 500 HQ in TX)
| Industry | F500 HQs | Revenue |
|---|---|---|
| Energy | 16 | $1,198B |
|
||
| Technology | 5 | $198B |
|
||
| Engineering / Construction | 4 | $72B |
|
||
| Energy Services | 3 | $60B |
|
||
| Utilities | 3 | $41B |
|
||
| Healthcare | 2 | $330B |
|
||
Price history
1 event — show timeline
- 2026-06-01 Listed $205,000 HARMLS
Property tax history
+31.3%/yrLatest (2025): $10,907 · +16.1% YoY. Source: county tax records.
Cash-flow waterfall
monthlySold comps — $/sqft
last 12 mo · ≤1 miLoading sold comps…