1035 W Turner St · Allentown, PA
Flood risk No data
- FEMA flood zone
- —
- Chance of flooding over 30 yrs
- —
- Est. flood insurance / yr
- —
Fire risk No data
- Est. fire insurance / yr
- —
Heat risk No data
- Hot days now (above threshold)
- —
- Hot days in 30 yrs
- —
Wind risk No data
- Chance of severe wind over 30 yrs
- —
Air-quality risk No data
- Unhealthy air days now
- —
- Unhealthy air days in 30 yrs
- —
Risk factors via First Street. Map © Google.
Why this score? — see what drove the C+ grade
The composite is a weighted blend of 9 inputs, each scored 0–100. Each bar is that input's sub-score; the figure is the points it added to the 100-point composite (weight × sub-score).
- Cash flow +21.3/30.0
- ARV discount +15.0/15.0
- DSCR +6.8/10.0
- 1% rule +5.6/10.0
- Livability +4.0/5.0
- Rent growth +3.9/5.0
- Condition / age +2.5/5.0
- Schools +1.2/10.0
- Appreciation +0.0/10.0
$199,000
🖨 Deal sheet 📄 Offer letter ✓ Due diligence
Listing remarks
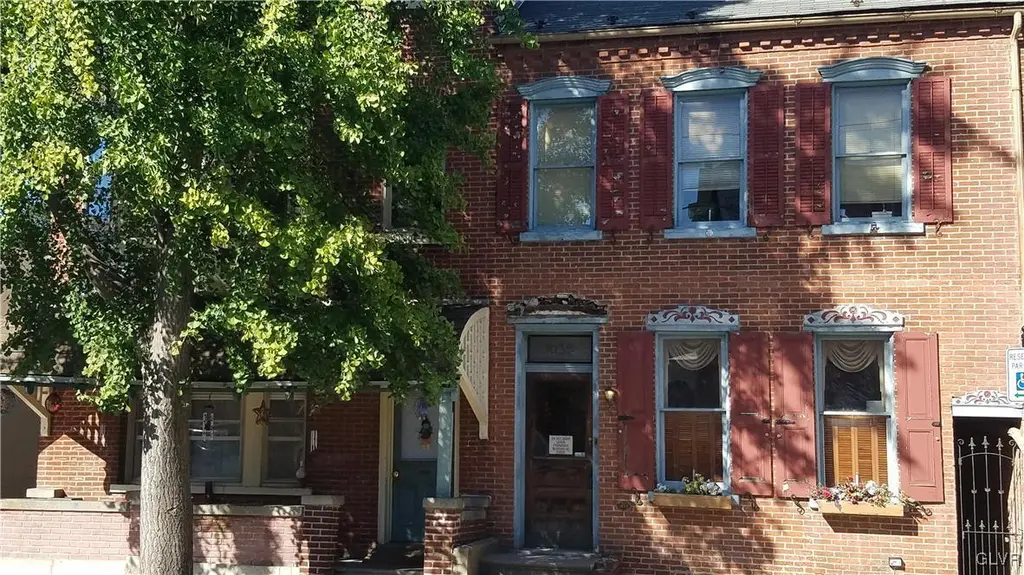
Brimming with classic appeal, this historic Allentown property offers the perfect blend of charm and modern updates with the opportunity for its new owner to add their own finishing touches. Featuring 3 bedrooms and 1.5 baths, the property also boasts a massive attic just waiting to be transformed into a 4th bedroom, home office, or media room. Enjoy a recently refreshed kitchen, a brand-new high-efficiency Bosch heating system, and replacement windows already purchased and waiting for installation. Step outside to a private backyard and a rare city luxury—a 3-car parking pad. Whether you're an investor looking for a high-reward project or a handy buyer ready to customize your dream s
Key facts
- Historic home
- Classic wood floors
- 2 parking spots
Tags
Property features AI
Finance
- Financial info: Listed for $199,000
Exterior
- Home design: Single family residential; Built in 1890
- Exterior features: Lot approximately 2,187 square feet
Interior
- Bedrooms: Three bedrooms
- Bathrooms: One full bathroom and one half bathroom
- Interior features: Comfortable living space totaling 1,822 square feet
Neighborhood map
What this means for you Summary
Snapshot
- This is a 4-bed/1.0-bath single-family listed at $199k.
Deal economics
- At list price, monthly cash flow is $291 ($3k/yr) — positive.
- The deal already cash-flows at list — no discount required.
- Meets the 1% rule at list price ($2k rent vs $199k).
- Cap rate 8.0% vs local median 5.3% in Allentown — top-decile yield for the area; either an underpriced asset or a hidden risk that comps aren't pricing in. Stress-test before assuming the spread holds.
Location & tenants
- Location reads 81/100 on livability (#171 in PA, #1,440 nationally) — a professional / high-income tenant draw. Strengths: commute A+, cost of living A+, housing A+; Watch: schools D+, employment D.
- Allentown City SD (urban): math 10% / reading 20% proficiency, ranked #513 of 539 in PA (top 95%) — low school quality limits family demand, transient renter base, plan for 1-2y turnover; 73% free/reduced lunch — lower-income household profile, screen leases tightly.
- Market conditions: Rents rising fast (+5.5%/yr); 167 active listings in the ZIP; 40 comparable units currently listed for rent nearby; rentals at typical pace (median 21d on market — plan ~3-4 weeks tenant-placement turnaround); lower-income renter base — watch delinquency; 765 units permitted in Lehigh County in 2024 (286 in 5+ unit buildings).
- At $2,109/mo this rent would consume 59% of the median local household income ($43k/yr) (locally 4313% of renters already pay >50% of income on rent) — very limited rent-growth headroom before tenants either downsize or default.
Forward outlook
- Local home prices are declining (-3.0%/yr); year-one equity from $1k of loan paydown is wiped out by about $6k of value loss. Plan a longer hold.
- Lehigh County population projected at +21% by 2050 — long-run rental-demand tailwind backs the buy-and-hold thesis.
Negotiation context
- Only 7 days on market — expect competitive offers; lowballing is unlikely to land.
Risks & watch-outs
- Watch-outs: built in 1890 — expect roof / HVAC / electrical / plumbing capex.
Questions for the listing agent
- Built in 1890 — when were the roof, HVAC, electrical panel, plumbing, and water heater last replaced?
- Is there a deadline driving the sale (1031 exchange, divorce, estate, relocation)? That informs how much negotiation room exists.
- Schools are D-rated, which usually means shorter tenancies and higher turnover. Who's the typical renter profile here, and what's been the actual vacancy rate?
- What's the average days-on-market for RENTAL listings here right now (not sales)? A rising rental-DOM trend means longer vacancies and softer asking-rent achievability than the comps imply.
- What's the recent tenant-quality profile in this submarket — average credit score on applications, eviction rate, late-payment / NSF rate, and stable-employment percentage? A property-management company in the area should have these aggregated.
- How much new for-sale + rental construction is in the pipeline within 1–3 miles? Heavy new supply typically softens prices + rents 12–24 months out; constrained supply supports both.
Investment metrics
- 1% rule
- 1.06% ✓
- Cap rate
- 8.05%
- Cash-on-cash
- 6.27%
- DSCR
- 1.28
- GRM
- 7.9
CMA / ARV
- ARV (on-the-fly)
- $302,452
- Comps found
- 5
Show comp detail 5 sales within ~0.75 mi
| Address | Dist | Beds/Ba | Sqft | Sold | Price | $/sf | Match |
|---|---|---|---|---|---|---|---|
| 940 Hamilton St #942 | 0.26mi | 3/2.0 (-1) | 1,686 (-8%) | 13mo | $280,000 | $166 | 56 |
| 422 N 11th St | 0.24mi | 4/2.5 | 1,563 (-14%) | 18mo | $270,000 | $173 | 44 |
| 27 N West St | 0.68mi | 5/2.0 (+1) | 2,004 (+10%) | 3mo | $355,000 | $177 | 41 |
| 220 Millbridge | 0.49mi | 3/1.0 (-1) | 1,971 (+8%) | 24mo | $63,000 | $32 | 39 |
| 1337 W Hickory St | 0.49mi | 4/1.0 | 1,552 (-15%) | 23mo | $185,900 | $120 | 33 |
Match score weights: distance 35% · size 25% · config 20% · recency 20%. Top-matched comps best support the ARV.
Projected returns pro-forma
-3.0% appreciation · 5.48% rent growth · sell at horizon
- IRR
- -3.9%
- Equity multiple
- 0.85×
- Total profit
- $-8,282
- Equity at exit
- $29,672
- IRR
- 8.5%
- Equity multiple
- 1.72×
- Total profit
- $40,075
- Equity at exit
- $17,206
Cash invested: $55,720 (down + closing). Projections, not guarantees.
Landlord ↔ Tenant lean methodology
- Overall (STATE)
- 62 Landlord-Friendly
- State Pennsylvania
- 62 Landlord-Friendly · EVEN
- County
- — inherits STATE
- City
- — inherits STATE
ZIP-level market 18102
- Rents YoY
- 5.5%
- Active inventory
- 167
- Price-to-rent
- 7.9×
Monthly cashflow live
- Estimated rent
- $2,109 high interval (Pro) →
- Mortgage (P&I)
- −$1,044
- Tax est. 1.5%
- −$249 /mo · $2,985/yr
- Insurance
- −$83
- HOA
- −$0
- Vacancy / Maint / Mgmt
- −$443
- Net cashflow
- $291
Break-even live
UW: 25.0% down · 7.5% · 30yr · 1.5% tax · 5.0% vac · 8.0% maint · 8.0% mgmt
Financing live
Cash to close
- Down payment
- $49,750
- Closing costs
- $5,970
- Reserves months
- —
- Total cash needed
- —
Loan-product check · same deal, 3 products live
Conventional
25% down · 7.5% · 30yr
- Down + closing
- —
- Monthly P&I
- —
- Monthly cashflow
- —
- DSCR
- —
- Eligible?
- —
Personal DTI + credit; lowest rate.
DSCR
20% down · 8.5% · 30yr
- Down + closing
- —
- Monthly P&I
- —
- Monthly cashflow
- —
- DSCR
- —
- Eligible?
- —
No personal income docs; deal must DSCR.
Hard money
10% down · 12.0% · 12mo
- Down + closing
- —
- Monthly P&I
- —
- Monthly cashflow
- —
- DSCR
- —
- Eligible?
- —
Short-term bridge; refi at stabilization.
Rent comps 40 comps
| Address | Beds | Baths | Sqft | Rent | $/sqft | DOM | Units | Dist |
|---|---|---|---|---|---|---|---|---|
| 948 W Maple St Allentown, PA | 4.0 | 1.0 | 1932 | $2,300 | $1.19 | 44d | 1 | 0.30mi |
| 828 W Gordon St Allentown, PA | 4.0 | 2.5 | 1628 | $2,250 | $1.38 | 2d | 1 | 0.33mi |
| 1341 Chew St Allentown, PA | 5.0 | 1.5 | 2139 | $2,500 | $1.17 | 21d | 1 | 0.34mi |
| 36 S Jefferson St Allentown, PA | 5.0 | 1.5 | 2128 | $2,500 | $1.17 | 14d | 1 | 0.35mi |
| 209 N Eighth St Apt 2 Allentown, PA | 3.0 | 1.0 | 1430 | $1,550 | $1.08 | 44d | 1 | 0.35mi |
| 1332 W Gordon St Allentown, PA | 3.0 | 2.0 | 1236 | $1,050 | $0.85 | 44d | 1 | 0.36mi |
| 144 S 12th St Allentown, PA | 4.0 | 2.0 | 1242 | $2,000 | $1.61 | 2d | 1 | 0.42mi |
| 1338 W Liberty St Allentown, PA | 4.0 | 1.0 | 1526 | $2,000 | $1.31 | 14d | 1 | 0.43mi |
| 1348 W Liberty St Allentown, PA | 5.0 | 1.0 | 1561 | $1,900 | $1.22 | 23d | 1 | 0.44mi |
| 626 N 11th St Allentown, PA | 4.0 | 1.5 | 1642 | $2,200 | $1.34 | 2d | 1 | 0.45mi |
| 41 S Franklin St Allentown, PA | 5.0 | 2.0 | 1897 | $2,500 | $1.32 | 14d | 1 | 0.50mi |
| 626 Oak St Allentown, PA | 3.0 | 1.0 | 1396 | $1,900 | $1.36 | 44d | 1 | 0.50mi |
| 138 S 14th St Allentown, PA | 5.0 | 1.0 | 2300 | $2,300 | $1.00 | 14d | 1 | 0.54mi |
| 915 Tilghman St Apt 4 Allentown, PA | 3.0 | 1.0 | 1250 | $1,750 | $1.40 | 23d | 1 | 0.54mi |
| 1538 Chew St Allentown, PA | 5.0 | 1.0 | 1874 | $2,800 | $1.49 | 19d | 1 | 0.56mi |
| 216 S 14th St Allentown, PA | 4.0 | 1.5 | 1640 | $2,300 | $1.40 | 2d | 1 | 0.57mi |
| 631 W Allen St Allentown, PA | 5.0 | 1.5 | 1695 | $2,100 | $1.24 | 44d | 1 | 0.62mi |
| 528 N 6th St Allentown, PA | 3.0 | 1.0 | 1934 | $1,800 | $0.93 | 44d | 1 | 0.64mi |
| 432 N Law St Allentown, PA | 4.0 | 1.0 | 1328 | $1,500 | $1.13 | 14d | 1 | 0.65mi |
| 622 Park St Allentown, PA | 5.0 | 1.5 | 1638 | $2,300 | $1.40 | 2d | 1 | 0.65mi |
| 823 W Washington St Allentown, PA | 4.0 | 1.0 | 1400 | $1,950 | $1.39 | 14d | 1 | 0.68mi |
| 1455 W Tilghman St Allentown, PA | 4.0 | 1.5 | 1520 | $1,850 | $1.22 | 44d | 1 | 0.68mi |
| 738 W Cedar St Allentown, PA | 5.0 | 1.5 | 1900 | $2,500 | $1.32 | 44d | 1 | 0.76mi |
| 535 Tilghman St Unit 2ND Allentown, PA | 4.0 | 2.0 | 1500 | $1,750 | $1.17 | 2d | 1 | 0.77mi |
| 856 N 8th St Allentown, PA | 5.0 | 1.5 | 1499 | $1,975 | $1.32 | 19d | 1 | 0.78mi |
| 407 N 4th St Allentown, PA | 3.0 | 1.5 | 1321 | $1,550 | $1.17 | 23d | 1 | 0.83mi |
| 389 W Turner St Allentown, PA | 4.0 | 1.5 | 2144 | $2,400 | $1.12 | 2d | 1 | 0.85mi |
| 517 Elliger St Allentown, PA | 3.0 | 1.5 | 1235 | $1,700 | $1.38 | 23d | 1 | 0.89mi |
| 395 W Allen St Allentown, PA | 3.0 | 1.0 | 1344 | $1,800 | $1.34 | 23d | 1 | 0.90mi |
| 913 N 6th St Allentown, PA | 4.0 | 1.0 | 1476 | $1,698 | $1.15 | 14d | 1 | 0.94mi |
| 644 Lehigh St Allentown, PA | 3.0 | 1.0 | 1714 | $2,250 | $1.31 | 44d | 1 | 0.96mi |
| 551 Sumner Ct Allentown, PA | 3.0 | 1.0 | 1270 | $1,700 | $1.34 | 2d | 1 | 0.99mi |
| 854 N Penn St Allentown, PA | 3.0 | 1.5 | 1502 | $1,850 | $1.23 | 14d | 1 | 0.99mi |
| 213 Chew St Allentown, PA | 5.0 | 1.0 | 1725 | $2,100 | $1.22 | 44d | 1 | 1.08mi |
| 314 Barber St Lot 35 Allentown, PA | 3.0 | 2.5 | 1525 | $2,450 | $1.61 | 19d | 1 | 1.10mi |
| 406 N 2nd St Allentown, PA | 3.0 | 2.0 | 2400 | $1,700 | $0.71 | 44d | 1 | 1.12mi |
| 1304 N 4th St Allentown, PA | 5.0 | 2.0 | 1891 | $2,900 | $1.53 | 44d | 1 | 1.19mi |
| 208 Ridge Ave Allentown, PA | 4.0 | 1.0 | 1396 | $1,600 | $1.15 | 2d | 1 | 1.20mi |
| 208 Ridge Ave Allentown, PA | 4.0 | 1.0 | 1396 | $1,700 | $1.22 | 23d | 1 | 1.20mi |
| 111 Ridge Ave Allentown, PA | 4.0 | 1.0 | 1658 | $1,650 | $1.00 | 44d | 1 | 1.23mi |
Listing history 11 events
-
2026-06-17days on market $199,000 Active 7 DOM
-
2026-06-16days on market $199,000 Active 6 DOM
-
2026-06-15days on market $199,000 Active 5 DOM
-
2026-06-14statusdays on market $199,000 Active 3 DOM
-
2026-06-10days on market $199,000 Coming Soon 1 DOM
-
2026-06-09days on market $199,000 Coming Soon 8 DOM
-
2026-06-08days on market $199,000 Coming Soon 7 DOM
-
2026-06-07days on market $199,000 Coming Soon 6 DOM
-
2026-06-03days on market $199,000 Coming Soon 2 DOM
-
2026-06-02remarks 693-char remark
-
2026-06-02$199,000 Coming Soon 1 DOM
ⓘ Source: listings_history table (triggers on properties + properties_extension) + one-shot
backfill from property_details.listing_events for pre-trigger history.
Nearby sold comps map
Loading sold comps map…
Walkable amenities ~0.75 mi
Loading nearby amenities…
Taxation est. · year 1
- Rental income
- $25,311
- − Mortgage interest
- −$11,147
- − Property taxes
- −$2,985
- − Insurance
- −$995
- − Repairs & maintenance
- −$2,025
- − Management
- −$2,025
- − Depreciation
- −$5,789
- Taxable income
- $345
- Est. tax owed @ 24.0%
- −$83
- After-tax cash flow
- $3,410/yr
For passive investors: Depreciation is non-cash, so a rental often shows a tax loss while cash-flowing — sheltering income. Rental losses are passive: they offset passive income freely, and up to $25,000/yr can offset ordinary (W-2) income if you actively participate and your MAGI is under $100k (phasing out to $0 by $150k); unused losses carry forward. On sale, claimed depreciation is recaptured at up to 25%, and gains may owe capital-gains tax (a 1031 exchange can defer both). Figures are a year-1 estimate at your 24.0% rate — not tax advice; consult a CPA.
Schools (NCES district)
- District
- Allentown City SD
- NCES district ID
- 4202280
- Math proficiency
- 10% ▼ -10.00%
- Reading proficiency
- 20% ▼ -15.00%
- Median HH income
- $36,337
- Composite
- 12.43/100
- National rank
- #9630
- State rank
- #513 of 539 in PA
Livability — Allentown
- Score
- 81/100
- State rank
- #171
- US rank
- #1440
Category grades
Schools grade is shown separately in the Schools card above.
Census & demographics
- Census place
- Allentown, PA
- County
- Lehigh County · 333,019 people
- City population
- 172,996
- Metro
- Allentown-Bethlehem-Easton, PA-NJ
- Population (ZIP)
- 51,001
- Household income
- $43,085
- Rent vs Own
- Severe rent burden
- 4313.0
Population outlook (Lehigh County) Hauer SSP2
- Today (2025)
- 392,957 people
- By 2030
- 408,319 · +3.9%
- By 2040
- 440,007 · +12.0%
- By 2050
- 475,940 · +21.1%
- By 2075
- 590,448 · +50.3%
- By 2100
- 690,314 · +75.7%
Race, ethnicity, and origin ACS 2023
- Neighborhood character
- Predominantly Hispanic (69%)
- Race & ethnicity
- Hispanic / Latino 69% Two or more races 28% White 18% Black 10%
- Hispanic origin (detail)
- Mexican 3% Puerto Rican 38% Dominican 22%
- Common ancestry
- Polish 1% Romanian 1% Hispanic 1%
- Foreign-born
- 22% · Canada, Jamaica
- Languages at home
- 45% English-only · Spanish 52% Arabic 2%
Political lean MEDSL · Lehigh
- 2024 margin
- Toss-up / Even · D 50.7% · R 48.0% · Other 1.2%
- 2008→2024 swing
- -12.9pp toward R · 2008: 15.6pp · 2024: 2.7pp
- All cycles
- 2024: D+2.7 2020: D+7.6 2016: D+4.4 2012: D+7.5 2008: D+15.6
Not yet ingested
- Civics
- —
Market trends
- HPI YoY
- ▼ -227.01%
- Current HPI
- 404.834
- Rent YoY
- ▲ 5.48%
- Metro
- Allentown-Bethlehem-Easton, PA-NJ
- State GDP YoY
- ▲ 1.68%
- F500 in state
- 34
Industry mix (Fortune 500 HQ in PA)
| Industry | F500 HQs | Revenue |
|---|---|---|
| Healthcare | 2 | $309B |
|
||
| Insurance | 2 | $27B |
|
||
| Telecommunications / Media | 1 | $124B |
|
||
| Industrial Distribution | 1 | $22B |
|
||
| Financial Services | 1 | $20B |
|
||
| Chemicals / Materials | 1 | $18B |
|
||
Cash-flow waterfall
monthlySold comps — $/sqft
last 12 mo · ≤1 miLoading sold comps…