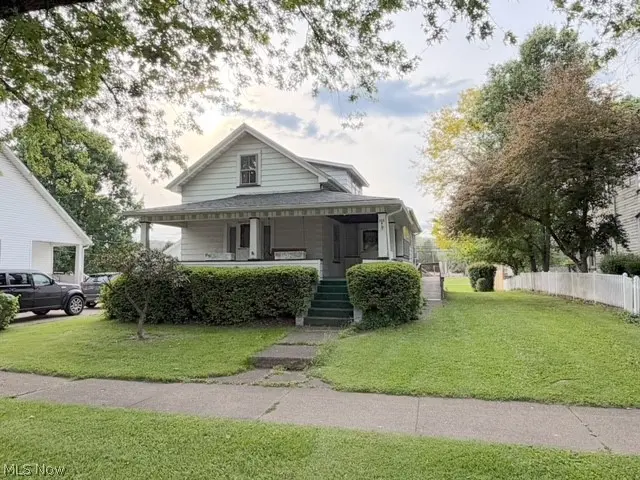
208 W Main St · Port Washington, OH
Flood risk 1/10 · Minimal
- FEMA flood zone
- X (shaded)
- Chance of flooding over 30 yrs
- 0.0%
- Est. flood insurance / yr
- $473 – $860
Fire risk 1/10 · Minimal
- Est. fire insurance / yr
- $713 – $1,323
Heat risk 4/10 · Minor
- Hot days now (above 99°F)
- 7 days/yr
- Hot days in 30 yrs
- 19 days/yr
Wind risk 1/10 · Minimal
- Chance of severe wind over 30 yrs
- 0.0%
Air-quality risk 2/10 · Minimal
- Unhealthy air days now
- 1 days/yr
- Unhealthy air days in 30 yrs
- 2 days/yr
Risk factors via First Street. Map © Google.
Why this score? — see what drove the C+ grade
The composite is a weighted blend of 9 inputs, each scored 0–100. Each bar is that input's sub-score; the figure is the points it added to the 100-point composite (weight × sub-score).
- Cash flow +15.6/30.0
- ARV discount +15.0/15.0
- Appreciation +8.8/10.0
- Schools +5.5/10.0
- DSCR +4.8/10.0
- 1% rule +4.3/10.0
- Livability +3.1/5.0
- Rent growth +2.5/5.0
- Condition / age +1.0/5.0
$119,900
🖨 Deal sheet 📄 Offer letter ✓ Due diligence
Listing remarks
Welcome to small town living with timeless charm and endless potential! This 2–3 bedroom home is full of character and warmth. Inside there is beautiful natural woodwork, spacious living areas, and a flexible floor plan to fit your needs. There is a front living room that has a gorgeous front door, and a dining room with an open staircase. Off the dining room is a sunroom that is currently being used as a first-floor bedroom. There is a spacious kitchen that includes the appliances. The convenience of a first-floor bathroom and laundry room makes everyday living easy. Upstairs are 2-3 bedrooms with plenty of storage. Outside is covered front porch and a large back deck with a ramp. Th
Key facts
- 8,999 sq ft lot
- 2 garage spots
- Built 1879
Property features AI
Exterior
- Parking: Detached garage; Two garage spaces
- Utilities: Public sewer; Well water
- Home design: Two-story home; Asphalt roof; Aluminum siding; Above-grade finished area approximately 1,455
- Construction: Aluminum siding construction; Asphalt roof; Estimated year built
- Exterior features: Front porch; Enclosed porch; Deck; Patio; Porch; City lot (approximately 50 x 180)
Interior
- Kitchen: Range; Refrigerator
- Bathrooms: One full bathroom on the main level
- Heating & cooling: Forced air gas heating; Window air conditioning units
- Interior features: Ceiling fans; Natural woodwork; Full unfinished basement
- Laundry & utility: Washer and dryer on the main level; Water softener
Neighborhood map
What this means for you Summary
Snapshot
- This is a 2-bed/1.0-bath single-family listed at $120k. Condition is rated poor.
Deal economics
- At list price, monthly cash flow is $51 ($610/yr) — positive.
- The deal already cash-flows at list — no discount required.
- To meet the 1% rule (rent ≥ 1% of price), the offer needs to be $111k (7.2% below list).
- Recommended offer: $111k (7.2% below list) — sets the bar for 1% rule.
Location & tenants
- Location reads 61/100 on livability (#939 in OH) — a middle-class / working-renter tenant base. Strengths: cost of living A+, housing A, schools B+; Watch: crime D+, amenities F, commute F.
- Indian Valley Local (rural): math 63% / reading 68% proficiency, ranked #214 of 656 in OH (top 33%) — acceptable for families but not a draw, mixed tenant base, ~2y average lease.
- Market conditions: 9 active listings in the ZIP; 244 units permitted in Tuscarawas County in 2024 (0 in 5+ unit buildings).
Forward outlook
- In year one you build about $10k of equity ($829 loan paydown + $9k appreciation (7.7% local appreciation)).
- Tuscarawas County population projected to shrink 10% by 2050 — rents likely to lag national; underwrite the cash flow, not the appreciation.
- At projected returns (7.7% appreciation + 3.0% rent growth), your $34k cash investment doubles in ~3 years — after that, you're playing with house money.
- By year 4, paydown + projected appreciation supports a ~$35k cash-out refi (75% LTV) — recoverable capital for the next deal without selling this one.
Negotiation context
- It's been on market 31 days — a 3% lower offer ($116k) is reasonable based on typical stale-listing flexibility.
Risks & watch-outs
- Watch-outs: built in 1879 — expect roof / HVAC / electrical / plumbing capex.
Questions for the listing agent
- It's been on market 31 days. Have you received any prior offers? Is the seller open to a 7% concession, seller financing, or rate buy-down credit?
- Have any recent inspections been done? Can we get a copy of the seller's disclosures and any deferred-maintenance estimates?
- Built in 1879 — when were the roof, HVAC, electrical panel, plumbing, and water heater last replaced?
- Is there a deadline driving the sale (1031 exchange, divorce, estate, relocation)? That informs how much negotiation room exists.
- Schools are B-rated — typically a magnet for longer-tenancy family renters. What's the average tenant stay here, and is there a school-zone premium baked into asking?
- Crime grade is D in this area — have there been break-ins, vandalism, or insurance claims at this property in the last 3 years? What carrier currently insures it and at what premium?
- What's the average days-on-market for RENTAL listings here right now (not sales)? A rising rental-DOM trend means longer vacancies and softer asking-rent achievability than the comps imply.
- What's the recent tenant-quality profile in this submarket — average credit score on applications, eviction rate, late-payment / NSF rate, and stable-employment percentage? A property-management company in the area should have these aggregated.
- How much new for-sale + rental construction is in the pipeline within 1–3 miles? Heavy new supply typically softens prices + rents 12–24 months out; constrained supply supports both.
Investment metrics
- 1% rule
- 0.93% ✗
- Cap rate
- 6.80%
- Cash-on-cash
- 1.82%
- DSCR
- 1.08
- GRM
- 9.0
CMA / ARV
- ARV (on-the-fly)
- $168,780
- Comps found
- 1
Show comp detail 1 sale within ~0.75 mi
| Address | Dist | Beds/Ba | Sqft | Sold | Price | $/sf | Match |
|---|---|---|---|---|---|---|---|
| 205 W Arch St | 0.06mi | 3/2.0 (+1) | 1,460 (+0%) | 18mo | $170,000 | $116 | 72 |
Match score weights: distance 35% · size 25% · config 20% · recency 20%. Top-matched comps best support the ARV.
Projected returns pro-forma
7.68% appreciation · 3.0% rent growth · sell at horizon
- IRR
- 20.7%
- Equity multiple
- 2.49×
- Total profit
- $50,180
- Equity at exit
- $88,469
- IRR
- 19.2%
- Equity multiple
- 5.26×
- Total profit
- $143,182
- Equity at exit
- $173,166
Cash invested: $33,572 (down + closing). Projections, not guarantees.
Landlord ↔ Tenant lean methodology
- Overall (STATE)
- 73 Landlord-Friendly
- State Ohio
- 73 Landlord-Friendly · R+6
- County
- — inherits STATE
- City
- — inherits STATE
ZIP-level market 43837
- Home prices YoY
- 2.6%
- Active inventory
- 9
- Price-to-rent
- 9.0×
Monthly cashflow live
- Estimated rent
- $1,113 medium interval (Pro) →
- Mortgage (P&I)
- −$629
- Tax est. 1.5%
- −$150 /mo · $1,798/yr
- Insurance
- −$50
- HOA
- −$0
- Vacancy / Maint / Mgmt
- −$234
- Net cashflow
- $51
Break-even live
UW: 25.0% down · 7.5% · 30yr · 1.5% tax · 5.0% vac · 8.0% maint · 8.0% mgmt
Financing live
Cash to close
- Down payment
- $29,975
- Closing costs
- $3,597
- Reserves months
- —
- Total cash needed
- —
Loan-product check · same deal, 3 products live
Conventional
25% down · 7.5% · 30yr
- Down + closing
- —
- Monthly P&I
- —
- Monthly cashflow
- —
- DSCR
- —
- Eligible?
- —
Personal DTI + credit; lowest rate.
DSCR
20% down · 8.5% · 30yr
- Down + closing
- —
- Monthly P&I
- —
- Monthly cashflow
- —
- DSCR
- —
- Eligible?
- —
No personal income docs; deal must DSCR.
Hard money
10% down · 12.0% · 12mo
- Down + closing
- —
- Monthly P&I
- —
- Monthly cashflow
- —
- DSCR
- —
- Eligible?
- —
Short-term bridge; refi at stabilization.
Listing history 7 events
-
2026-06-07statusdays on market $119,900 Pending 31 DOM
-
2026-06-04days on market $119,900 Contingent 30 DOM
-
2026-06-02days on market $119,900 Contingent 29 DOM
-
2026-06-01days on market $119,900 Contingent 28 DOM
-
2026-05-31days on market $119,900 Contingent 27 DOM
-
2026-05-14historical Contingent
-
2026-05-04$119,900 Active
ⓘ Source: listings_history table (triggers on properties + properties_extension) + one-shot
backfill from property_details.listing_events for pre-trigger history.
Climate risk First Street
- Flood 1/10 Low FEMA zone X (shaded) · 0% chance over 30 yrs
- Wildfire 1/10 Low
- Heat 4/10 Moderate 7 d/yr ≥99°F today · 19 d/yr by 30 yrs out
- Wind 1/10 Low 0% chance of damaging wind over 30 yrs
- Air quality 2/10 Low 1 unhealthy d/yr today · 2 by 30 yrs out
Nearby sold comps map
Loading sold comps map…
Walkable amenities ~0.75 mi
Loading nearby amenities…
Taxation est. · year 1
- Rental income
- $13,358
- − Mortgage interest
- −$6,716
- − Property taxes
- −$1,798
- − Insurance
- −$600
- − Repairs & maintenance
- −$1,069
- − Management
- −$1,069
- − Depreciation
- −$3,488
- Taxable loss
- −$1,381
- Est. tax savings @ 24.0%
- +$332
- After-tax cash flow
- $941/yr
For passive investors: Depreciation is non-cash, so a rental often shows a tax loss while cash-flowing — sheltering income. Rental losses are passive: they offset passive income freely, and up to $25,000/yr can offset ordinary (W-2) income if you actively participate and your MAGI is under $100k (phasing out to $0 by $150k); unused losses carry forward. On sale, claimed depreciation is recaptured at up to 25%, and gains may owe capital-gains tax (a 1031 exchange can defer both). Figures are a year-1 estimate at your 24.0% rate — not tax advice; consult a CPA.
Condition & rehab AI · 1 photo
This property requires extensive repairs and updates to its roof, exterior, interior walls, windows, HVAC, and landscaping. Significant investment is needed to bring it up to a livable condition.
Repairs flagged
- Major roof — No photos of the roof.
- Major exterior siding — No photos of the exterior siding.
- Major interior walls/paint — No photos of the interior walls/paint.
- Major windows — No photos of the windows.
- Major HVAC/mechanicals — No photos of the HVAC/mechanicals.
- Major landscaping/curb appeal — No photos of the landscaping/curb appeal.
Value-add opportunities
- Both New roof and siding — Both resale and rental value would be significantly increased.
- Both Paint interior walls and trim — Enhances the home's appearance and appeal.
- Both Replace windows with energy-efficient ones — Improves energy efficiency and reduces utility costs.
- Both Upgrade HVAC system — Enhances comfort and energy efficiency.
- Both Landscaping and curb appeal improvements — Enhances the home's curb appeal and overall aesthetic appeal.
Renovation cost estimate screening
| Repair item | Severity | Est. cost |
|---|---|---|
| roof · No photos of the roof. | Major | $15,000–50,000 |
| exterior siding · No photos of the exterior siding. | Major | $15,000–50,000 |
| interior walls/paint · No photos of the interior walls/paint. | Major | $15,000–50,000 |
| windows · No photos of the windows. | Major | $15,000–50,000 |
| HVAC/mechanicals · No photos of the HVAC/mechanicals. | Major | $15,000–50,000 |
| landscaping/curb appeal · No photos of the landscaping/curb appeal. | Major | $15,000–50,000 |
| Total estimated repair cost · 6 items | $90,000–300,000 |
Value-add ROI direction
- Both New roof and siding — Both resale and rental value would be significantly increased. ↑
- Both Paint interior walls and trim — Enhances the home's appearance and appeal. ↑
- Both Replace windows with energy-efficient ones — Improves energy efficiency and reduces utility costs. ↑
- Both Upgrade HVAC system — Enhances comfort and energy efficiency. ↑
- Both Landscaping and curb appeal improvements — Enhances the home's curb appeal and overall aesthetic appeal. ↑
ⓘ Cost ranges are severity-bucket heuristics (US national rule-of-thumb). Get contractor quotes + a written scope before underwriting a rehab budget.
Schools (NCES district)
- District
- Indian Valley Local
- NCES district ID
- 3905028
- Math proficiency
- 63% ▼ -8.00%
- Reading proficiency
- 68% ▼ -4.00%
- Median HH income
- $44,733
- Composite
- 55.12/100
- National rank
- #1284
- State rank
- #214 of 656 in OH
Livability — Port Washington
- Score
- 61/100
- State rank
- #939
- US rank
- #18099
Category grades
Schools grade is shown separately in the Schools card above.
Census & demographics
- Census place
- Port Washington, OH
- County
- Tuscarawas · 99,287 people
- Population (ZIP)
- 1,819
- Household income
- $54,911
- Rent vs Own
- Severe rent burden
- 38.3
Population outlook (Tuscarawas County) Hauer SSP2
- Today (2025)
- 92,253 people
- By 2030
- 91,060 · -1.3%
- By 2040
- 87,479 · -5.2%
- By 2050
- 83,174 · -9.8%
- By 2075
- 72,000 · -22.0%
- By 2100
- 58,574 · -36.5%
Race, ethnicity, and origin ACS 2023
- Neighborhood character
- Predominantly White (89%)
- Race & ethnicity
- White 89% Two or more races 8% Hispanic / Latino 1% Black 1%
- Common ancestry
- Iranian 2% Lithuanian 1% Portuguese 1%
- Languages at home
- 98% English-only · German/W. Germanic 1%
Political lean MEDSL · Tuscarawas
- 2024 margin
- Solid R (+43.3) · D 28.0% · R 71.2%
- 2008→2024 swing
- -45.7pp toward R · 2008: 2.4pp · 2024: -43.3pp
- All cycles
- 2024: R+43.3 2020: R+39.9 2016: R+35.5 2012: R+9.8 2008: D+2.4
Not yet ingested
- Civics
- —
Market trends
- HPI YoY
- ▲ 7.68%
- Current HPI
- 301.0524
- Rent YoY
- —
- Metro
- —
- State GDP YoY
- ▲ 1.98%
- F500 in state
- 48
Industry mix (Fortune 500 HQ in OH)
| Industry | F500 HQs | Revenue |
|---|---|---|
| Insurance | 3 | $145B |
|
||
| Industrial Machinery | 3 | $49B |
|
||
| Financial Services | 3 | $24B |
|
||
| Consumer Goods | 2 | $93B |
|
||
| Aerospace / Defense | 2 | $47B |
|
||
| Utilities | 2 | $33B |
|
||
Price history
2 events — show timeline
- 2026-05-14 Contingent — MLSNOW
- 2026-05-04 Listed $119,900 MLSNOW
Cash-flow waterfall
monthlySold comps — $/sqft
last 12 mo · ≤1 miLoading sold comps…