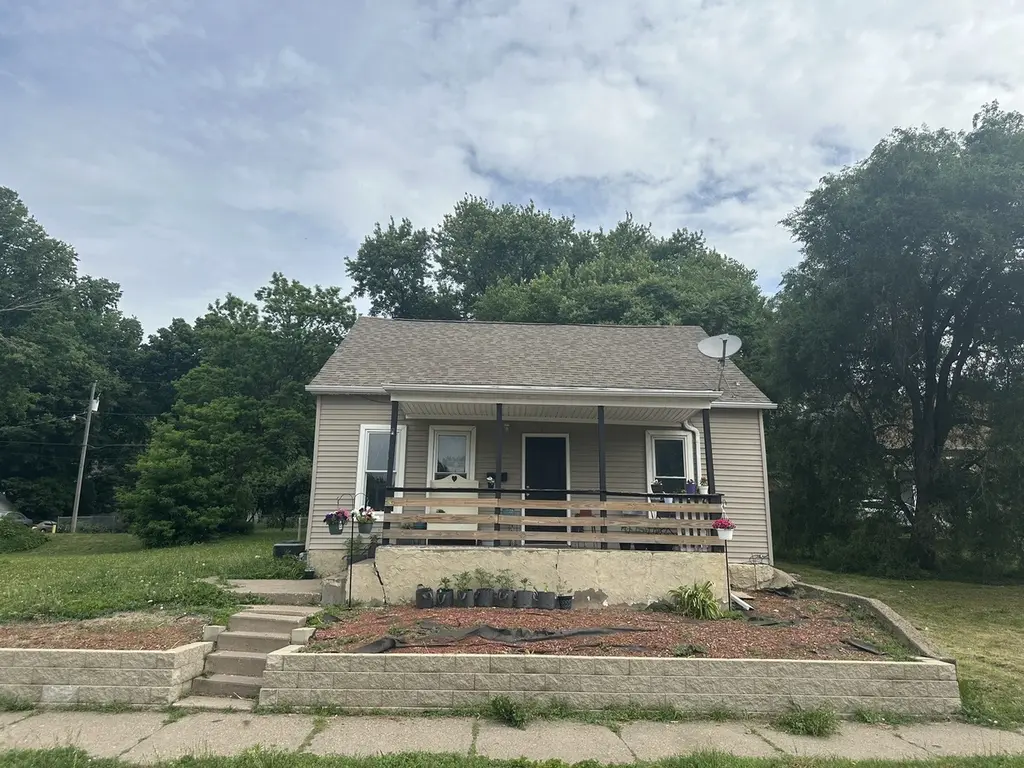
710 5th St W · Davenport, IA
Flood risk 1/10 · Minimal
- FEMA flood zone
- X (unshaded)
- Chance of flooding over 30 yrs
- 0.0%
- Est. flood insurance / yr
- $473 – $860
Fire risk 1/10 · Minimal
- Est. fire insurance / yr
- $902 – $1,676
Heat risk 3/10 · Minor
- Hot days now (above 103°F)
- 7 days/yr
- Hot days in 30 yrs
- 16 days/yr
Wind risk 2/10 · Minimal
- Chance of severe wind over 30 yrs
- —
Air-quality risk 3/10 · Minor
- Unhealthy air days now
- 2 days/yr
- Unhealthy air days in 30 yrs
- 3 days/yr
Risk factors via First Street. Map © Google.
Why this score? — see what drove the C+ grade
The composite is a weighted blend of 9 inputs, each scored 0–100. Each bar is that input's sub-score; the figure is the points it added to the 100-point composite (weight × sub-score).
- Cash flow +30.0/30.0
- DSCR +10.0/10.0
- 1% rule +9.1/10.0
- Livability +4.0/5.0
- Schools +3.9/10.0
- Rent growth +2.5/5.0
- Condition / age +2.5/5.0
- ARV discount +0.0/15.0
- Appreciation +0.0/10.0
$110,000
🖨 Deal sheet (PDF) 📄 Offer letter ✓ Due diligence
Listing remarks
Must see inside! This 4 bedroom home is solid!! Newly remodeled bathroom (2024) will tile floor and shower, new tub, fixtures and vanity. Laundry is also on main floor in bathroom for your convenience. Large kitchen with plenty of cabinets and room to add an island or table. The formal dining and living room are very spacious and open. Two main floor bedrooms and 2 additional bedrooms on second floor. New A/C 2021, Kitchen floor tile 2024, entry doors 2023, interior doors 2024. Just a very short walk to all of downtown Davenports restaurants, parks, and events! Home comes with additional lot at 716 W 5th St. Plenty of parking. Shed will stay if you want it to.
Key facts
- Plenty of parking
- Main floor laundry
- Large kitchen
Tags
Property features AI
Finance
- Other: Property currently being leased; Lot dimensions approximately 40 x 150 (less than 0.25 acre)
- HOA & community: No master association fee required
Exterior
- Parking: Three parking spaces; Gravel parking off alley (owned)
- Utilities: Public water; Public sewer; 100 amp electric service
- Home design: Detached single-family home; 1.5-story design; Fee simple ownership; Located in a historical district; commuter bus access
- Construction: Over 100 years old; Vinyl siding; Asphalt roof; Brick/mortar and other foundation
- Exterior features: Patio; Porch; Mature trees; Level lot
Interior
- Kitchen: Kitchen on main level (13 x 12) with tile flooring; Range; Refrigerator
- Bedrooms: Master bedroom on main level (12 x 17) with carpet; Second bedroom on main level (11 x 13) with carpet; Two bedrooms on second level (10 x 12 and 11 x 11) with carpet
- Flooring: Carpet in bedrooms; Laminate in living and dining areas; Tile in kitchen and laundry
- Bathrooms: One full bathroom
- Heating & cooling: Natural gas heating; Central air conditioning
- Interior features: First-floor full bathroom; Separate dining room; Dormer attic; Unfinished partial basement with block and concrete construction
- Laundry & utility: Main level laundry (12 x 10) with tile flooring; Gas dryer hookup; Laundry located in/near bathroom
Neighborhood map
What this means for you Summary
Snapshot
- This is a 4-bed/1.0-bath single-family listed at $110k.
Deal economics
- At list price, monthly cash flow is $494 ($6k/yr) — positive.
- The deal already cash-flows at list — no discount required.
- Meets the 1% rule at list price ($2k rent vs $110k).
- Recommended offer: $108k (1.5% below list) — sets the bar for market timing.
- Cap rate 11.7% vs local median 4.4% in Davenport — top-decile yield for the area; either an underpriced asset or a hidden risk that comps aren't pricing in. Stress-test before assuming the spread holds.
Location & tenants
- Location reads 79/100 on livability (#126 in IA, #2,312 nationally) — a middle-class / working-renter tenant base. Strengths: cost of living A+, housing A+, health & safety A+; Watch: employment C-, crime F.
- Davenport Community School District (urban): math 43% / reading 50% proficiency, ranked #288 of 289 in IA (top 100%) — families likely to look elsewhere, expect single-tenant / working-renter base with shorter leases.
- Zoned schools: Jefferson Elementary School (math 21% / reading 24%, grade F, #615 of 616 statewide, top 100%, 460 students, 71% FRL); Central High School (math 45% / reading 64%, grade C-, #290 of 336 statewide, top 87%, 1,505 students, 47% FRL) — zoned schools at 59% FRL track the district average.
- Market conditions: 67 active listings in the ZIP; 20 comparable units currently listed for rent nearby; rentals lingering (median 46d on market — plan ~5-8 weeks vacancy on turnover, expect pricing pressure); 50% of comp listings sitting > 30 days — soft ceiling on asking rent; 805 units permitted in Scott County in 2024 (479 in 5+ unit buildings).
- This rent runs 34% of the median local income ($54k/yr) — at the standard rent-burdened threshold; future hikes will face affordability resistance.
Forward outlook
- Local home prices are declining (-3.0%/yr); year-one equity from $761 of loan paydown is wiped out by about $3k of value loss. Plan a longer hold.
- Scott County population projected at +19% by 2050 — long-run rental-demand tailwind backs the buy-and-hold thesis.
- At projected returns (-3.0% appreciation + 3.0% rent growth), your $31k cash investment doubles in ~7 years — after that, you're playing with house money.
Negotiation context
- It's been on market 22 days — a 2% lower offer ($108k) is reasonable based on typical stale-listing flexibility.
- 5 sale attempts since 21y ago; this cycle's ask is 83% above the opening price — seller raised mid-cycle; expect resistance to lowballs.
- Current owner paid $42k; list at $110k implies a 162% gain — meaningful room to come down on a strong offer.
Risks & watch-outs
- Watch-outs: built in 1900 — expect roof / HVAC / electrical / plumbing capex.
Questions for the listing agent
- Built in 1900 — when were the roof, HVAC, electrical panel, plumbing, and water heater last replaced?
- Is there a deadline driving the sale (1031 exchange, divorce, estate, relocation)? That informs how much negotiation room exists.
- Crime grade is F in this area — have there been break-ins, vandalism, or insurance claims at this property in the last 3 years? What carrier currently insures it and at what premium?
- What's the average days-on-market for RENTAL listings here right now (not sales)? A rising rental-DOM trend means longer vacancies and softer asking-rent achievability than the comps imply.
- What's the recent tenant-quality profile in this submarket — average credit score on applications, eviction rate, late-payment / NSF rate, and stable-employment percentage? A property-management company in the area should have these aggregated.
- How much new for-sale + rental construction is in the pipeline within 1–3 miles? Heavy new supply typically softens prices + rents 12–24 months out; constrained supply supports both.
Investment metrics
- 1% rule
- 1.41% ✓
- Cap rate
- 11.69%
- Cash-on-cash
- 19.26%
- DSCR
- 1.86
- GRM
- 5.9
CMA / ARV
- ARV (on-the-fly)
- $84,056
- Comps found
- 7
Show comp detail 7 sales within ~0.75 mi
| Address | Dist | Beds/Ba | Sqft | Sold | Price | $/sf | Match |
|---|---|---|---|---|---|---|---|
| 617 Warren St | 0.15mi | 3/1.0 (-1) | 1,565 (+4%) | 1mo | $85,000 | $54 | 80 |
| 727 W 11th St | 0.41mi | 3/1.0 (-1) | 1,428 (-5%) | 1mo | $65,000 | $46 | 67 |
| 1034 W 14th St | 0.70mi | 4/1.5 | 1,544 (+3%) | 6mo | $140,000 | $91 | 56 |
| 1127 N Ripley St St | 0.55mi | 4/1.0 | 1,660 (+11%) | 3mo | $93,000 | $56 | 54 |
| 1324 Marquette St | 0.73mi | 3/2.0 (-1) | 1,302 (-13%) | 1mo | $115,000 | $88 | 34 |
| 715 Iowa St | 0.75mi | 3/2.0 (-1) | 1,710 (+14%) | 1mo | $94,000 | $55 | 32 |
| 314 Washington St | 0.71mi | 3/2.0 (-1) | 1,275 (-15%) | 1mo | $109,900 | $86 | 32 |
Match score weights: distance 35% · size 25% · config 20% · recency 20%. Top-matched comps best support the ARV.
Projected returns pro-forma
-3.0% appreciation · 3.0% rent growth · sell at horizon
- IRR
- 11.2%
- Equity multiple
- 1.44×
- Total profit
- $13,665
- Equity at exit
- $16,401
- IRR
- 20.2%
- Equity multiple
- 2.70×
- Total profit
- $52,458
- Equity at exit
- $9,511
Cash invested: $30,800 (down + closing). Projections, not guarantees.
Landlord ↔ Tenant lean methodology
- Overall (STATE)
- 83 Strongly Landlord-Friendly
- State Iowa
- 83 Strongly Landlord-Friendly · R+6
- County
- — inherits STATE
- City
- — inherits STATE
ZIP-level market 52802
- Home prices YoY
- -28.3%
- Active inventory
- 67
- Price-to-rent
- 5.9×
Monthly cashflow live
- Estimated rent
- $1,548 high interval (Pro) →
- Mortgage (P&I)
- −$577
- Tax from tax record
- −$106 /mo · $1,268/yr
- Insurance
- −$46
- HOA
- −$0
- Vacancy / Maint / Mgmt
- −$325
- Net cashflow
- $494
Break-even live
Sensitivity live
| Price | -10% $557 | -5% $525 | +0% $494 | +5% $463 | +10% $432 |
|---|---|---|---|---|---|
| Rent | -10% $372 | -5% $433 | +0% $494 | +5% $555 | +10% $617 |
| Rate | -1.0pp $550 | -0.5pp $522 | base $494 | +0.5pp $466 | +1.0pp $437 |
UW: 25.0% down · 7.5% · 30yr · 1.5% tax · 5.0% vac · 8.0% maint · 8.0% mgmt
Financing live
Cash to close
- Down payment
- $27,500
- Closing costs
- $3,300
- Reserves months
- —
- Total cash needed
- —
Loan-product check · same deal, 3 products live
Conventional
25% down · 7.5% · 30yr
- Down + closing
- —
- Monthly P&I
- —
- Monthly cashflow
- —
- DSCR
- —
- Eligible?
- —
Personal DTI + credit; lowest rate.
DSCR
20% down · 8.5% · 30yr
- Down + closing
- —
- Monthly P&I
- —
- Monthly cashflow
- —
- DSCR
- —
- Eligible?
- —
No personal income docs; deal must DSCR.
Hard money
10% down · 12.0% · 12mo
- Down + closing
- —
- Monthly P&I
- —
- Monthly cashflow
- —
- DSCR
- —
- Eligible?
- —
Short-term bridge; refi at stabilization.
Rent comps 20 comps
| Address | Beds | Baths | Sqft | Rent | $/sqft | DOM | Units | Dist |
|---|---|---|---|---|---|---|---|---|
| 401 Brady St Davenport, IA | 1.0–3.0 | 1.0–2.0 | 870 | $2,100 | $2.41 | 15d | 2 | 0.48mi |
| 427 N Brady St Unit 1 Davenport, IA | 3.0 | 1.5 | 1126 | $1,359 | $1.21 | 45d | 1 | 0.49mi |
| 212 N Brady St Davenport, IA | 2.0–3.0 | 2.0–3.0 | 1428 | $2,600 | $1.82 | 15d | 4 | 0.50mi |
| 1315 Brown St Unit 2 Davenport, IA | 3.0 | 1.0 | 1300 | $1,250 | $0.96 | 23d | 1 | 0.59mi |
| 1323 N Gaines St Davenport, IA | 4.0 | 2.0 | 1733 | $1,350 | $0.78 | 23d | 1 | 0.60mi |
| 511 Pershing Ave Unit 106E Davenport, IA | 3.0 | 2.0 | 1349 | $1,996 | $1.48 | 45d | 1 | 0.63mi |
| 511 Pershing Ave Unit 301E Davenport, IA | 3.0 | 2.0 | 1429 | $2,126 | $1.49 | 45d | 1 | 0.63mi |
| 915 W 14th St Davenport, IA | 3.0 | 1.0 | 1390 | $900 | $0.65 | 45d | 1 | 0.64mi |
| 427 Pershing Ave Davenport, IA | 3.0 | 2.0 | 1438 | $2,288 | $1.59 | 15d | 3 | 0.64mi |
| 621 W 15th St Davenport, IA | 4.0 | 2.0 | 1833 | $1,500 | $0.82 | 15d | 1 | 0.68mi |
| 119 E 13th St Davenport, IA | 3.0 | 1.0 | 1728 | $1,495 | $0.87 | 45d | 1 | 0.75mi |
| 537 W 16th St Davenport, IA | 3.0 | 1.0 | 1311 | $1,400 | $1.07 | 45d | 1 | 0.76mi |
| 1511 N Ripley St Davenport, IA | 4.0 | 2.0 | 1872 | $1,450 | $0.77 | 23d | 1 | 0.77mi |
| 1421 N Main St #2 Davenport, IA | 3.0 | 1.0 | 1350 | $1,095 | $0.81 | 45d | 1 | 0.77mi |
| 616 E 6th St Davenport, IA | 4.0 | 1.0 | 1578 | $1,712 | $1.08 | 45d | 1 | 0.89mi |
| 1716 W 7th St Davenport, IA | 4.0 | 1.0 | 1278 | $1,712 | $1.34 | 15d | 1 | 0.92mi |
| 736 Federal St Davenport, IA | 1.0–3.0 | 1.0–2.0 | 1186 | $1,868 | $1.57 | 23d | 1 | 1.02mi |
| 1912 Dixwell St Davenport, IA | 4.0 | 2.0 | 1116 | $1,300 | $1.16 | 45d | 1 | 1.24mi |
| 1723 W Locust St Davenport, IA | 3.0 | 1.0 | 1690 | $1,395 | $0.83 | 45d | 1 | 1.34mi |
| 2209 Farnam St Unit 2211 Davenport, IA | 3.0 | 1.0 | 1138 | $1,050 | $0.92 | 23d | 1 | 1.46mi |
Listing history 14 events
-
2026-06-21days on market $110,000 Active 22 DOM
-
2026-06-18days on market $110,000 Active 19 DOM
-
2026-06-17days on market $110,000 Active 18 DOM
-
2026-06-16days on market $110,000 Active 17 DOM
-
2026-06-15days on market $110,000 Active 16 DOM
-
2026-06-14days on market $110,000 Active 14 DOM
-
2026-06-13days on market $110,000 Active 13 DOM
-
2026-06-10days on market $110,000 Active 11 DOM
-
2026-06-09days on market $110,000 Active 10 DOM
-
2026-06-08days on market $110,000 Active 9 DOM
-
2026-06-07days on market $110,000 Active 8 DOM
-
2026-06-03days on market $110,000 Active 4 DOM
-
2026-06-02remarks 668-char remark
-
2026-06-02$110,000 Active 3 DOM
ⓘ Source: listings_history table (triggers on properties + properties_extension) + one-shot
backfill from property_details.listing_events for pre-trigger history.
Tax reassessment forecast IA · Partial reset (capped growth)
- Current annual tax
- $1,268 · $106/mo
- Projected year-2 tax
- $1,498 · $125/mo
- Expected delta
- +$230/yr (+$19/mo · 18.1%)
ⓘ Screening estimate from a state-policy table — verify with the county assessor before closing.
Climate risk First Street
- Flood 1/10 Low FEMA zone X (unshaded) · 0% chance over 30 yrs
- Wildfire 1/10 Low
- Heat 3/10 Moderate 7 d/yr ≥103°F today · 16 d/yr by 30 yrs out
- Wind 2/10 Low
- Air quality 3/10 Moderate 2 unhealthy d/yr today · 3 by 30 yrs out
Nearby sold comps map
Loading sold comps map…
Walkable amenities ~0.75 mi
Loading nearby amenities…
Taxation est. · year 1
- Rental income
- $18,573
- − Mortgage interest
- −$6,162
- − Property taxes
- −$1,268
- − Insurance
- −$550
- − Repairs & maintenance
- −$1,486
- − Management
- −$1,486
- − Depreciation
- −$3,200
- Taxable income
- $4,422
- Est. tax owed @ 24.0%
- −$1,061
- After-tax cash flow
- $4,871/yr
For passive investors: Depreciation is non-cash, so a rental often shows a tax loss while cash-flowing — sheltering income. Rental losses are passive: they offset passive income freely, and up to $25,000/yr can offset ordinary (W-2) income if you actively participate and your MAGI is under $100k (phasing out to $0 by $150k); unused losses carry forward. On sale, claimed depreciation is recaptured at up to 25%, and gains may owe capital-gains tax (a 1031 exchange can defer both). Figures are a year-1 estimate at your 24.0% rate — not tax advice; consult a CPA.
Schools (NCES district)
- District
- Davenport Community School District
- NCES district ID
- 1908580
- Math proficiency
- 43% ▼ -11.00%
- Reading proficiency
- 50% ▼ -3.00%
- Median HH income
- $46,157
- Composite
- 39.49/100
- National rank
- #3951
- State rank
- #288 of 289 in IA
Livability — Davenport
- Score
- 79/100
- State rank
- #126
- US rank
- #2312
Category grades
Schools grade is shown separately in the Schools card above.
Census & demographics
- Census place
- Davenport, IA
- County
- Scott County · 144,583 people
- City population
- 103,319
- Metro
- Davenport-Moline-Rock Island, IA-IL
- Population (ZIP)
- 9,466
- Household income
- $54,380
- Rent vs Own
- Severe rent burden
- 244.0
Population outlook (Scott County) Hauer SSP2
- Today (2025)
- 188,878 people
- By 2030
- 196,648 · +4.1%
- By 2040
- 210,860 · +11.6%
- By 2050
- 224,359 · +18.8%
- By 2075
- 258,884 · +37.1%
- By 2100
- 286,447 · +51.7%
Race, ethnicity, and origin ACS 2023
- Neighborhood character
- Predominantly White (71%)
- Race & ethnicity
- White 71% Hispanic / Latino 14% Two or more races 10% Black 5% Asian 1%
- Hispanic origin (detail)
- Mexican 13%
- Common ancestry
- Romanian 2% Lithuanian 1% Italian 1%
- Foreign-born
- 4% · Canada, Vietnam
- Languages at home
- 92% English-only · Spanish 7%
Political lean MEDSL · Scott
- 2024 margin
- Toss-up / Even · D 47.3% · R 51.2% · Other 1.4%
- 2008→2024 swing
- -18.4pp toward R · 2008: 14.6pp · 2024: -3.9pp
- All cycles
- 2024: R+3.9 2020: D+3.5 2016: D+1.4 2012: D+13.8 2008: D+14.6
Not yet ingested
- Civics
- —
Market trends
- HPI YoY
- ▼ -59.59%
- Current HPI
- 151.2076
- Rent YoY
- —
- Metro
- Davenport-Moline-Rock Island, IA-IL
- State GDP YoY
- ▲ 2.48%
- F500 in state
- 4
Industry mix (Fortune 500 HQ in IA)
| Industry | F500 HQs | Revenue |
|---|---|---|
| Financial Services | 1 | $16B |
|
||
| Retail / Convenience | 1 | $15B |
|
||
Price history
+324.2% since first listed17 events — show timeline
- 2021-08-06 Listing Removed — RMLSA as Distributed by MLS Grid
- 2021-08-06 Listing Removed — RMLSA as Distributed by MLS Grid
- 2021-08-06 Listing Removed — RMLSA as Distributed by MLS Grid
- 2021-08-06 Listing Removed — RMLSA as Distributed by MLS Grid
- 2019-08-30 Sold (Public Records) $42,000 Public Records
- 2018-11-19 Sold (Public Records) $42,600 Public Records
- 2018-11-16 Listed $60,000 MRED as Distributed by MLS Grid
- 2018-11-16 Listed $60,000 RMLSA as Distributed by MLS Grid
- 2018-11-16 Sold (MLS) $42,600 MRED as Distributed by MLS Grid
- 2018-11-16 Sold (MLS) $42,600 RMLSA as Distributed by MLS Grid
- 2008-11-19 Sold (Public Records) $45,000 Public Records
- 2008-11-14 Sold (MLS) $45,000 MRED as Distributed by MLS Grid
- 2008-11-14 Sold (MLS) $45,000 RMLSA as Distributed by MLS Grid
- 2008-07-11 Listed $49,900 MRED as Distributed by MLS Grid
- 2008-07-11 Listed $49,900 RMLSA as Distributed by MLS Grid
- 2006-01-30 Sold (MLS) $4,500 RMLSA as Distributed by MLS Grid
- 2005-04-28 Listed $9,900 RMLSA as Distributed by MLS Grid
Property tax history
+2.0%/yrLatest (2025): $1,268 · -23.6% YoY. Source: county tax records.
Cash-flow waterfall
monthlySold comps — $/sqft
last 12 mo · ≤1 miLoading sold comps…