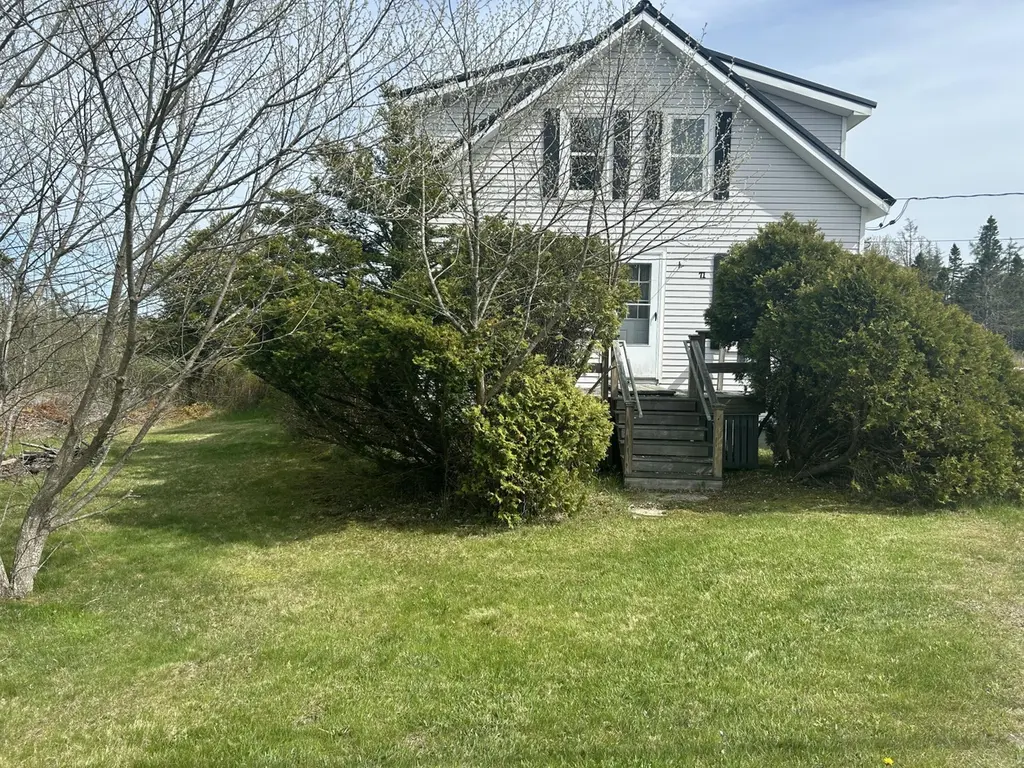
71 Mason Bay Rd · Jonesport, ME
Flood risk 1/10 · Minimal
- FEMA flood zone
- X (unshaded)
- Chance of flooding over 30 yrs
- 0.0%
- Est. flood insurance / yr
- $473 – $860
Fire risk 3/10 · Minor
- Est. fire insurance / yr
- $669 – $1,243
Heat risk 4/10 · Minor
- Hot days now (above 80°F)
- 7 days/yr
- Hot days in 30 yrs
- 17 days/yr
Wind risk 8/10 · Major
- Chance of severe wind over 30 yrs
- 80.0%
Air-quality risk 1/10 · Minimal
- Unhealthy air days now
- 0 days/yr
- Unhealthy air days in 30 yrs
- 0 days/yr
Risk factors via First Street. Map © Google.
Why this score? — see what drove the D grade
The composite is a weighted blend of 9 inputs, each scored 0–100. Each bar is that input's sub-score; the figure is the points it added to the 100-point composite (weight × sub-score).
- Cash flow +15.7/30.0
- ARV discount +7.5/15.0
- DSCR +4.8/10.0
- Appreciation +3.7/10.0
- 1% rule +3.6/10.0
- Rent growth +2.5/5.0
- Livability +2.5/5.0
- Condition / age +2.5/5.0
- Schools +2.0/10.0
$189,000
🖨 Deal sheet (PDF) 📄 Offer letter ✓ Due diligence
Listing remarks
Welcome to coastal Downeast Maine living at 71 Mason Bay Road in Jonesport. This classic New Englander offers 4 bedrooms, 1 full bath, and 1,597± square feet of living space on a level 0.55-acre lot just minutes from the working waterfront and town marina. Recent improvements including a metal roof, updated windows and doors, and a heat pump add comfort and efficiency while preserving the home's historic character. Inside, you'll find flexible living spaces with a first-floor bedroom, spacious family room, mudroom, and plenty of room for guests, hobbies, or a home office. Outside, enjoy a deck and easy access to the natural beauty that makes Jonesport so special. Sandy River Beach, G
Key facts
- Metal roof
- Heat pump
- 0.55 acre lot
Tags
Property features AI
Finance
- HOA & community: No pet restrictions
Exterior
- Parking: Gravel parking on site with 1–4 spaces
- Utilities: Electric on site with circuit breakers; Private well water; Water heater: off heating system
- Home design: Single family residence; Built in 1920
- Construction: Wood frame with aluminum and vinyl siding; Block foundation; Metal roof
- Exterior features: Deck; Shed(s); Near town; Level lot; Paved road
Interior
- Kitchen: Gas range; Refrigerator
- Bedrooms: Bedroom 1 on the first floor; Bedroom 2 on the second floor; Bedroom 3 on the second floor; Bedroom 4 on the second floor; Den on the second floor
- Flooring: Carpet; Laminate
- Bathrooms: 1 full bathroom
- Heating & cooling: Baseboard heating; Hot water heating; Heat pump for heating and cooling
- Interior features: First-floor bedroom; Storage; 8 total rooms
- Laundry & utility: Washer (main level)
Neighborhood map
What this means for you Summary
Snapshot
- This is a 4-bed/1.0-bath single-family listed at $189k.
Deal economics
- At list price, monthly cash flow is $81 ($977/yr) — positive.
- The deal already cash-flows at list — no discount required.
- To meet the 1% rule (rent ≥ 1% of price), the offer needs to be $163k (13.7% below list).
- Recommended offer: $163k (13.7% below list) — sets the bar for 1% rule.
Location & tenants
- Location reads: area grade D — affects rentability + tenant quality, not the cash-flow math above.
- Moosabec CSD (rural): math 0% / reading 40% proficiency, ranked #185 of 185 in ME (top 100%) — low school quality limits family demand, transient renter base, plan for 1-2y turnover.
- Zoned schools: Jonesport Elementary School (math 84% / reading 74%, grade A, #182 of 294 statewide, top 69%, 98 students, 44% FRL); Jonesport-Beals High School (68 students, 50% FRL).
- Zoned-school proficiency averages 80% at this address vs 20% district-wide (+60 pts) — the actual schools serving this property are materially stronger than the Moosabec CSD average implies; a family-tenant draw the district grade alone would hide.
- Market conditions: 45 active listings in the ZIP; 67 units permitted in Washington County in 2024 (0 in 5+ unit buildings).
Forward outlook
- Local home prices are declining (-2.6%/yr); year-one equity from $1k of loan paydown is wiped out by about $5k of value loss. Plan a longer hold.
- Washington County population projected at -27% by 2050 — secular population decline; favor cash flow + early exit over multi-decade hold.
Negotiation context
- It's been on market 27 days — a 2% lower offer ($186k) is reasonable based on typical stale-listing flexibility.
Risks & watch-outs
- Watch-outs: built in 1920 — expect roof / HVAC / electrical / plumbing capex.
- Climate carrying-cost: severe wind risk, 80% chance of damaging wind over 30y — expect insurance premiums to compound above CPI over the hold.
Questions for the listing agent
- Built in 1920 — when were the roof, HVAC, electrical panel, plumbing, and water heater last replaced?
- Is there a deadline driving the sale (1031 exchange, divorce, estate, relocation)? That informs how much negotiation room exists.
- The area grade is low — what's the realistic commute time and amenity access for the typical tenant pool here? Any planned neighborhood developments (good or bad) we should know about?
- What's the average days-on-market for RENTAL listings here right now (not sales)? A rising rental-DOM trend means longer vacancies and softer asking-rent achievability than the comps imply.
- What's the recent tenant-quality profile in this submarket — average credit score on applications, eviction rate, late-payment / NSF rate, and stable-employment percentage? A property-management company in the area should have these aggregated.
- How much new for-sale + rental construction is in the pipeline within 1–3 miles? Heavy new supply typically softens prices + rents 12–24 months out; constrained supply supports both.
Investment metrics
- 1% rule
- 0.86% ✗
- Cap rate
- 6.81%
- Cash-on-cash
- 1.85%
- DSCR
- 1.08
- GRM
- 9.7
CMA / ARV
- ARV (on-the-fly)
- $94,068
- Comps found
- 1
Show comp detail 1 sale within ~0.75 mi
| Address | Dist | Beds/Ba | Sqft | Sold | Price | $/sf | Match |
|---|---|---|---|---|---|---|---|
| 4 Foucher Ln | 0.51mi | 4/1.0 | 1,491 (+6%) | 12mo | $100,000 | $67 | 56 |
Match score weights: distance 35% · size 25% · config 20% · recency 20%. Top-matched comps best support the ARV.
Projected returns pro-forma
-2.63% appreciation · 3.0% rent growth · sell at horizon
- IRR
- -11.4%
- Equity multiple
- 0.57×
- Total profit
- $-22,563
- Equity at exit
- $31,278
- IRR
- -2.8%
- Equity multiple
- 0.80×
- Total profit
- $-10,601
- Equity at exit
- $21,713
Cash invested: $52,920 (down + closing). Projections, not guarantees.
Landlord ↔ Tenant lean methodology
- Overall (STATE)
- 41 Moderately Tenant-Leaning
- State Maine
- 41 Moderately Tenant-Leaning · D+2
- County
- — inherits STATE
- City
- — inherits STATE
ZIP-level market 04649
- Home prices YoY
- -1.6%
- Active inventory
- 45
- Price-to-rent
- 9.7×
Monthly cashflow live
- Estimated rent
- $1,632 medium interval (Pro) →
- Mortgage (P&I)
- −$991
- Tax from tax record
- −$138 /mo · $1,653/yr
- Insurance
- −$79
- HOA
- −$0
- Vacancy / Maint / Mgmt
- −$343
- Net cashflow
- $81
Break-even live
Sensitivity live
| Price | -10% $188 | -5% $135 | +0% $81 | +5% $28 | +10% $-26 |
|---|---|---|---|---|---|
| Rent | -10% $-47 | -5% $17 | +0% $81 | +5% $146 | +10% $210 |
| Rate | -1.0pp $177 | -0.5pp $130 | base $81 | +0.5pp $32 | +1.0pp $-17 |
UW: 25.0% down · 7.5% · 30yr · 1.5% tax · 5.0% vac · 8.0% maint · 8.0% mgmt
Financing live
Cash to close
- Down payment
- $47,250
- Closing costs
- $5,670
- Reserves months
- —
- Total cash needed
- —
Loan-product check · same deal, 3 products live
Conventional
25% down · 7.5% · 30yr
- Down + closing
- —
- Monthly P&I
- —
- Monthly cashflow
- —
- DSCR
- —
- Eligible?
- —
Personal DTI + credit; lowest rate.
DSCR
20% down · 8.5% · 30yr
- Down + closing
- —
- Monthly P&I
- —
- Monthly cashflow
- —
- DSCR
- —
- Eligible?
- —
No personal income docs; deal must DSCR.
Hard money
10% down · 12.0% · 12mo
- Down + closing
- —
- Monthly P&I
- —
- Monthly cashflow
- —
- DSCR
- —
- Eligible?
- —
Short-term bridge; refi at stabilization.
Listing history 19 events
-
2026-06-22days on market $189,000 Active 27 DOM
-
2026-06-21days on market $189,000 Active 26 DOM
-
2026-06-21days on market $189,000 Active 25 DOM
-
2026-06-18days on market $189,000 Active 23 DOM
-
2026-06-17days on market $189,000 Active 22 DOM
-
2026-06-16days on market $189,000 Active 21 DOM
-
2026-06-15days on market $189,000 Active 20 DOM
-
2026-06-13days on market $189,000 Active 18 DOM
-
2026-06-12days on market $189,000 Active 17 DOM
-
2026-06-09days on market $189,000 Active 14 DOM
-
2026-06-08days on market $189,000 Active 13 DOM
-
2026-06-07days on market $189,000 Active 12 DOM
-
2026-06-05days on market $189,000 Active 10 DOM
-
2026-06-04days on market $189,000 Active 8 DOM
-
2026-06-02days on market $189,000 Active 7 DOM
-
2026-06-01days on market $189,000 Active 6 DOM
-
2026-05-31days on market $189,000 Active 5 DOM
-
2026-05-31days on market $189,000 Active 4 DOM
-
2026-05-26$189,000 Active
ⓘ Source: listings_history table (triggers on properties + properties_extension) + one-shot
backfill from property_details.listing_events for pre-trigger history.
Tax reassessment forecast ME · Partial reset (capped growth)
- Current annual tax
- $1,653 · $138/mo
- Projected year-2 tax
- $2,112 · $176/mo
- Expected delta
- +$459/yr (+$38/mo · 27.7%)
ⓘ Screening estimate from a state-policy table — verify with the county assessor before closing.
Climate risk First Street
- Flood 1/10 Low FEMA zone X (unshaded) · 0% chance over 30 yrs
- Wildfire 3/10 Moderate
- Heat 4/10 Moderate 7 d/yr ≥80°F today · 17 d/yr by 30 yrs out
- Wind 8/10 Severe 80% chance of damaging wind over 30 yrs
- Air quality 1/10 Low 0 unhealthy d/yr today · 0 by 30 yrs out
Nearby sold comps map
Loading sold comps map…
Walkable amenities ~0.75 mi
Loading nearby amenities…
Taxation est. · year 1
- Rental income
- $19,581
- − Mortgage interest
- −$10,587
- − Property taxes
- −$1,653
- − Insurance
- −$945
- − Repairs & maintenance
- −$1,566
- − Management
- −$1,566
- − Depreciation
- −$5,498
- Taxable loss
- −$2,235
- Est. tax savings @ 24.0%
- +$536
- After-tax cash flow
- $1,514/yr
For passive investors: Depreciation is non-cash, so a rental often shows a tax loss while cash-flowing — sheltering income. Rental losses are passive: they offset passive income freely, and up to $25,000/yr can offset ordinary (W-2) income if you actively participate and your MAGI is under $100k (phasing out to $0 by $150k); unused losses carry forward. On sale, claimed depreciation is recaptured at up to 25%, and gains may owe capital-gains tax (a 1031 exchange can defer both). Figures are a year-1 estimate at your 24.0% rate — not tax advice; consult a CPA.
Schools (NCES district)
- District
- Moosabec CSD
- NCES district ID
- 2308400
- Math proficiency
- 0% ▬ 0.00%
- Reading proficiency
- 40% ▲ 40.00%
- Median HH income
- $36,806
- Composite
- 19.82/100
- National rank
- #13895
- State rank
- #185 of 185 in ME
Livability — Jonesport
No livability data for this city. (Only ~50 U.S. cities are tracked.)
Census & demographics
- Population (ZIP)
- 1,276
Population outlook (Washington County) Hauer SSP2
- Today (2025)
- 28,818 people
- By 2030
- 27,147 · -5.8%
- By 2040
- 23,809 · -17.4%
- By 2050
- 21,035 · -27.0%
- By 2075
- 16,793 · -41.7%
- By 2100
- 14,395 · -50.0%
Race, ethnicity, and origin ACS 2023
- Neighborhood character
- Predominantly White (96%)
- Race & ethnicity
- White 96% Two or more races 2%
- Common ancestry
- Slovak 3% Serbian 2% Lithuanian 2%
- Foreign-born
- 2%
- Languages at home
- 97% English-only · Spanish 1% German/W. Germanic 1%
Political lean MEDSL · Washington
- 2024 margin
- Strong R (+23.5) · D 37.5% · R 61.0% · Other 1.6%
- 2008→2024 swing
- -24.5pp toward R · 2008: 1.0pp · 2024: -23.5pp
- All cycles
- 2024: R+23.5 2020: R+19.8 2016: R+16.2 2012: D+1.6 2008: D+1.0
Not yet ingested
- Civics
- —
Market trends
- HPI YoY
- ▼ -2.63%
- Current HPI
- 165.0338
- Rent YoY
- —
- Metro
- —
- State GDP YoY
- —
- F500 in state
- 0
Price history
1 event — show timeline
- 2026-05-26 Listed $189,000 MREIS
Property tax history
-0.2%/yrLatest (2025): $1,653 · +7.3% YoY. Source: county tax records.
Cash-flow waterfall
monthlySold comps — $/sqft
last 12 mo · ≤1 miLoading sold comps…