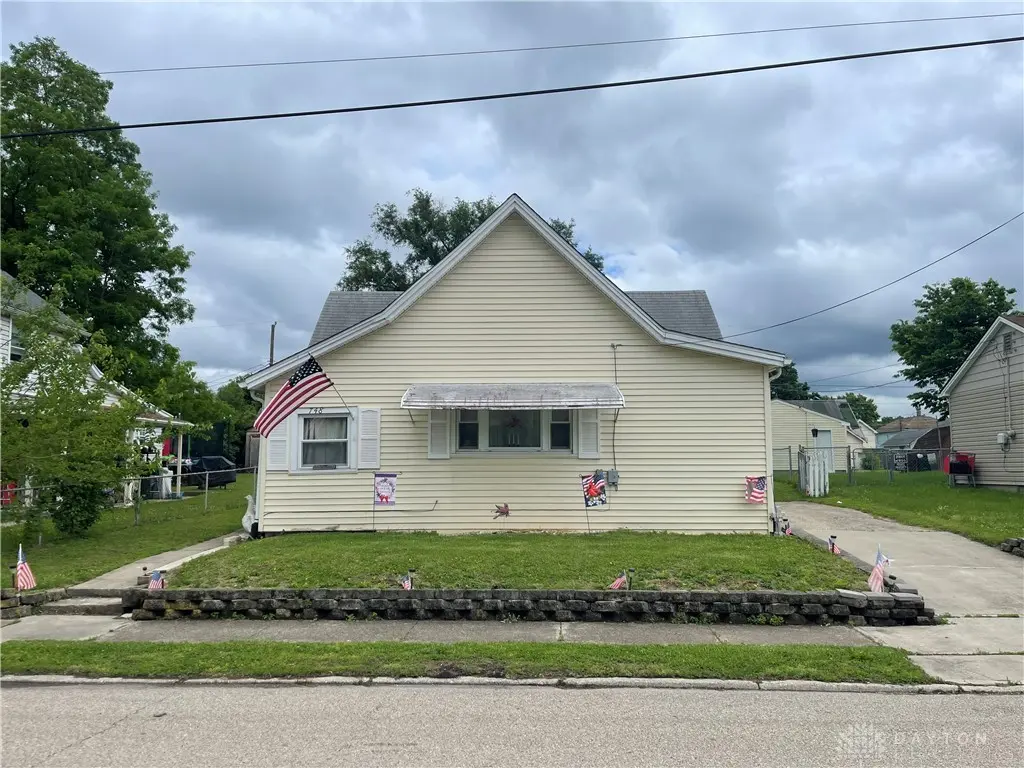
748 Tibbals St · Franklin, OH
Flood risk 3/10 · Minor
- FEMA flood zone
- X (unshaded)
- Chance of flooding over 30 yrs
- 0.1%
- Est. flood insurance / yr
- $473 – $860
Fire risk 1/10 · Minimal
- Est. fire insurance / yr
- $713 – $1,323
Heat risk 4/10 · Minor
- Hot days now (above 101°F)
- 7 days/yr
- Hot days in 30 yrs
- 19 days/yr
Wind risk 2/10 · Minimal
- Chance of severe wind over 30 yrs
- 1.0%
Air-quality risk 3/10 · Minor
- Unhealthy air days now
- 2 days/yr
- Unhealthy air days in 30 yrs
- 4 days/yr
Risk factors via First Street. Map © Google.
Why this score? — see what drove the D+ grade
The composite is a weighted blend of 9 inputs, each scored 0–100. Each bar is that input's sub-score; the figure is the points it added to the 100-point composite (weight × sub-score).
- ARV discount +15.0/15.0
- Cash flow +12.6/30.0
- Schools +4.9/10.0
- DSCR +3.7/10.0
- Rent growth +3.6/5.0
- Livability +3.6/5.0
- 1% rule +2.8/10.0
- Condition / age +2.5/5.0
- Appreciation +0.0/10.0
$149,900
🖨 Deal sheet (PDF) 📄 Offer letter ✓ Due diligence
Listing remarks
Discover the charm of this inviting one-story residence, a delightful blend of comfort and convenience, perfect for creating lasting memories. This cozy and impeccably clean home offers a welcoming atmosphere from the moment you arrive. The exterior boasts durable vinyl siding and central air ensures year-round comfort. Inside, an expansive eat-in kitchen provides ample space for casual dining, complemented by a formal dining room, ideal for hosting gatherings and entertaining guests. While currently configured with one dedicated bedroom, the versatile family room was originally a second bedroom and can easily be converted back to suit your needs. A total of 1.5 bathrooms cater to everyday
Key facts
- Formal dining room
- Family room
- Vinyl siding
Tags
Property features AI
Finance
- Other: Lot dimensions approximately 47 x 146; Lot size approximately 0.1575 acres
- Financial info: Offered for sale
Exterior
- Parking: Attached 2-car garage; Detached garage; Garage door opener; Additional storage
- Utilities: Natural gas available; Sewer available (storm sewer); Public water
- Home design: Single-story; Vinyl siding; Residential zoning
- Construction: Vinyl siding construction; Partial, unfinished basement
- Exterior features: Partial fencing; Patio; Storage; Shed(s)
Interior
- Kitchen: Built-in oven; Dishwasher; Disposal; Microwave; Range; Refrigerator
- Bathrooms: 1 full bathroom; 1 half bathroom; 2 bathrooms on main level
- Heating & cooling: Central air conditioning; Forced air heating; Natural gas heating
- Interior features: Ceiling fan(s); Galley kitchen; Jetted tub; Kitchen/family room combo
- Laundry & utility: Washer; Water softener (owned and rented listed); Gas water heater
Neighborhood map
What this means for you Summary
Snapshot
- This is a 2-bed/1.5-bath single-family listed at $150k.
Deal economics
- At list price, monthly cash flow is $-20 ($-241/yr) — negative.
- To cash-flow at today's rent, offer at most $146k (2.4% below list).
- To meet the 1% rule (rent ≥ 1% of price), the offer needs to be $117k (22.2% below list).
- Recommended offer: $117k (22.2% below list) — sets the bar for 1% rule.
- Cap rate 6.1% vs local median 3.6% in Franklin — top-decile yield for the area; either an underpriced asset or a hidden risk that comps aren't pricing in. Stress-test before assuming the spread holds.
Location & tenants
- Location reads 71/100 on livability (#396 in OH) — a middle-class / working-renter tenant base. Strengths: cost of living A+, housing A+; Watch: health & safety C-, employment D+, amenities D-.
- Franklin City (suburban): math 55% / reading 60% proficiency, ranked #332 of 656 in OH (top 51%) — acceptable for families but not a draw, mixed tenant base, ~2y average lease.
- Market conditions: Rents rising fast (+4.2%/yr); 139 active listings in the ZIP; 4 comparable units currently listed for rent nearby; rentals at typical pace (median 25d on market — plan ~3-4 weeks tenant-placement turnaround); solid renter incomes; 1,224 units permitted in Warren County in 2024 (474 in 5+ unit buildings).
Forward outlook
- Local home prices are declining (-3.0%/yr); year-one equity from $1k of loan paydown is wiped out by about $4k of value loss. Plan a longer hold.
- Warren County population projected at +16% by 2050 — long-run rental-demand tailwind backs the buy-and-hold thesis.
Negotiation context
- Only 5 days on market — expect competitive offers; lowballing is unlikely to land.
- Current owner paid $40k; list at $150k implies a 275% gain — meaningful room to come down on a strong offer.
Risks & watch-outs
- Watch-outs: built in 1913 — expect roof / HVAC / electrical / plumbing capex.
Questions for the listing agent
- What do current leases actually rent for vs. the listed asking? Can we see a recent rent roll and the last 12 months of T-12 income?
- Built in 1913 — when were the roof, HVAC, electrical panel, plumbing, and water heater last replaced?
- Is there a deadline driving the sale (1031 exchange, divorce, estate, relocation)? That informs how much negotiation room exists.
- Schools are B-rated — typically a magnet for longer-tenancy family renters. What's the average tenant stay here, and is there a school-zone premium baked into asking?
- The area grade is low — what's the realistic commute time and amenity access for the typical tenant pool here? Any planned neighborhood developments (good or bad) we should know about?
- What's the average days-on-market for RENTAL listings here right now (not sales)? A rising rental-DOM trend means longer vacancies and softer asking-rent achievability than the comps imply.
- What's the recent tenant-quality profile in this submarket — average credit score on applications, eviction rate, late-payment / NSF rate, and stable-employment percentage? A property-management company in the area should have these aggregated.
- How much new for-sale + rental construction is in the pipeline within 1–3 miles? Heavy new supply typically softens prices + rents 12–24 months out; constrained supply supports both.
Investment metrics
- 1% rule
- 0.78% ✗
- Cap rate
- 6.13%
- Cash-on-cash
- -0.57%
- DSCR
- 0.97
- GRM
- 10.7
CMA / ARV
- ARV (on-the-fly)
- $189,504
- Comps found
- 12
Show comp detail 12 sales within ~0.75 mi
| Address | Dist | Beds/Ba | Sqft | Sold | Price | $/sf | Match |
|---|---|---|---|---|---|---|---|
| 743 S Main St | 0.11mi | 3/1.5 (+1) | 1,372 (+4%) | 12mo | $140,000 | $102 | 72 |
| 218 Roberts Ave | 0.48mi | 3/1.0 (+1) | 1,216 (-8%) | 2mo | $88,000 | $72 | 56 |
| 608 Park Ave | 0.65mi | 2/2.5 | 1,330 (+1%) | 12mo | $200,000 | $150 | 54 |
| 24 S Main St | 0.68mi | 2/1.0 | 1,272 (-3%) | 10mo | $140,000 | $110 | 53 |
| 821 Union Rd | 0.37mi | 2/1.0 | 1,144 (-13%) | 13mo | $170,000 | $149 | 48 |
| 213 Locust St | 0.61mi | 3/2.0 (+1) | 1,408 (+7%) | 8mo | $229,900 | $163 | 47 |
| 210 N Riley Blvd | 0.67mi | 2/1.5 | 1,472 (+12%) | 4mo | $40,000 | $27 | 46 |
| 112 Chestnut St | 0.67mi | 2/1.5 | 1,208 (-8%) | 14mo | $105,000 | $87 | 43 |
| 7189 Shaker Rd | 0.61mi | 3/1.0 (+1) | 1,142 (-13%) | 2mo | $165,000 | $144 | 41 |
| 11 W Third St | 0.46mi | 2/1.0 | 1,512 (+15%) | 16mo | $185,000 | $122 | 38 |
| 320 Sycamore St | 0.75mi | 3/1.0 (+1) | 1,230 (-6%) | 15mo | $185,000 | $150 | 35 |
| 7293 Ellenridge Dr | 0.59mi | 3/2.0 (+1) | 1,120 (-15%) | 10mo | $184,000 | $164 | 32 |
Match score weights: distance 35% · size 25% · config 20% · recency 20%. Top-matched comps best support the ARV.
Projected returns pro-forma
-3.0% appreciation · 4.2% rent growth · sell at horizon
- IRR
- -16.1%
- Equity multiple
- 0.42×
- Total profit
- $-24,186
- Equity at exit
- $22,351
- IRR
- -5.9%
- Equity multiple
- 0.60×
- Total profit
- $-16,879
- Equity at exit
- $12,961
Cash invested: $41,972 (down + closing). Projections, not guarantees.
Landlord ↔ Tenant lean methodology
- Overall (STATE)
- 73 Landlord-Friendly
- State Ohio
- 73 Landlord-Friendly · R+6
- County
- — inherits STATE
- City
- — inherits STATE
ZIP-level market 45005
- Rents YoY
- 4.2%
- Active inventory
- 139
- Price-to-rent
- 10.7×
Monthly cashflow live
- Estimated rent
- $1,167 medium interval (Pro) →
- Mortgage (P&I)
- −$786
- Tax from tax record
- −$93 /mo · $1,119/yr
- Insurance
- −$62
- HOA
- −$0
- Vacancy / Maint / Mgmt
- −$245
- Net cashflow
- $-20
Break-even live
Sensitivity live
| Price | -10% $65 | -5% $22 | +0% $-20 | +5% $-63 | +10% $-105 |
|---|---|---|---|---|---|
| Rent | -10% $-112 | -5% $-66 | +0% $-20 | +5% $26 | +10% $72 |
| Rate | -1.0pp $55 | -0.5pp $18 | base $-20 | +0.5pp $-59 | +1.0pp $-98 |
UW: 25.0% down · 7.5% · 30yr · 1.5% tax · 5.0% vac · 8.0% maint · 8.0% mgmt
Financing live
Cash to close
- Down payment
- $37,475
- Closing costs
- $4,497
- Reserves months
- —
- Total cash needed
- —
Loan-product check · same deal, 3 products live
Conventional
25% down · 7.5% · 30yr
- Down + closing
- —
- Monthly P&I
- —
- Monthly cashflow
- —
- DSCR
- —
- Eligible?
- —
Personal DTI + credit; lowest rate.
DSCR
20% down · 8.5% · 30yr
- Down + closing
- —
- Monthly P&I
- —
- Monthly cashflow
- —
- DSCR
- —
- Eligible?
- —
No personal income docs; deal must DSCR.
Hard money
10% down · 12.0% · 12mo
- Down + closing
- —
- Monthly P&I
- —
- Monthly cashflow
- —
- DSCR
- —
- Eligible?
- —
Short-term bridge; refi at stabilization.
Rent comps 4 comps
| Address | Beds | Baths | Sqft | Rent | $/sqft | DOM | Units | Dist |
|---|---|---|---|---|---|---|---|---|
| 425 S Main St Franklin, OH | 1.0 | 1.0 | 900 | $900 | $1.00 | 2d | 1 | 0.31mi |
| 281 Millard Dr Franklin, OH | 3.0 | 2.0 | 950 | $1,500 | $1.58 | 44d | 1 | 1.32mi |
| 50 Beam Cir Franklin, OH | 1.0–2.0 | 1.0 | 825 | $1,175 | $1.42 | 2d | 8 | 1.39mi |
| 381 Sherman Dr Franklin, OH | 3.0 | 3.5 | 1344 | $1,995 | $1.48 | 24d | 1 | 1.39mi |
Listing history 5 events
-
2026-06-02status $149,900 Pending 5 DOM
-
2026-06-01days on market $149,900 Active 5 DOM
-
2026-05-31days on market $149,900 Active 4 DOM
-
2026-05-26$149,900 Active
-
2019-11-05soldstatus $40,000
ⓘ Source: listings_history table (triggers on properties + properties_extension) + one-shot
backfill from property_details.listing_events for pre-trigger history.
Tax reassessment forecast OH · Partial reset (capped growth)
- Current annual tax
- $1,119 · $93/mo
- Projected year-2 tax
- $1,729 · $144/mo
- Expected delta
- +$610/yr (+$51/mo · 54.5%)
ⓘ Screening estimate from a state-policy table — verify with the county assessor before closing.
Climate risk First Street
- Flood 3/10 Moderate FEMA zone X (unshaded) · 10% chance over 30 yrs
- Wildfire 1/10 Low
- Heat 4/10 Moderate 7 d/yr ≥101°F today · 19 d/yr by 30 yrs out
- Wind 2/10 Low 100% chance of damaging wind over 30 yrs
- Air quality 3/10 Moderate 2 unhealthy d/yr today · 4 by 30 yrs out
Nearby sold comps map
Loading sold comps map…
Walkable amenities ~0.75 mi
Loading nearby amenities…
Taxation est. · year 1
- Rental income
- $14,001
- − Mortgage interest
- −$8,397
- − Property taxes
- −$1,119
- − Insurance
- −$750
- − Repairs & maintenance
- −$1,120
- − Management
- −$1,120
- − Depreciation
- −$4,361
- Taxable loss
- −$2,866
- Est. tax savings @ 24.0%
- +$688
- After-tax cash flow
- $446/yr
For passive investors: Depreciation is non-cash, so a rental often shows a tax loss while cash-flowing — sheltering income. Rental losses are passive: they offset passive income freely, and up to $25,000/yr can offset ordinary (W-2) income if you actively participate and your MAGI is under $100k (phasing out to $0 by $150k); unused losses carry forward. On sale, claimed depreciation is recaptured at up to 25%, and gains may owe capital-gains tax (a 1031 exchange can defer both). Figures are a year-1 estimate at your 24.0% rate — not tax advice; consult a CPA.
Schools (NCES district)
- District
- Franklin City
- NCES district ID
- 3904400
- Math proficiency
- 55% ▼ -8.00%
- Reading proficiency
- 60% ▼ -5.00%
- Median HH income
- $48,983
- Composite
- 48.89/100
- National rank
- #2081
- State rank
- #332 of 656 in OH
Livability — Franklin
- Score
- 71/100
- State rank
- #396
- US rank
- #6546
Category grades
Schools grade is shown separately in the Schools card above.
Census & demographics
- Census place
- Franklin, OH
- County
- Warren County · 196,906 people
- City population
- 32,251
- Metro
- Cincinnati, OH-KY-IN
- Population (ZIP)
- 32,251
- Household income
- $75,399
- Rent vs Own
- Severe rent burden
- 811.0
Population outlook (Warren County) Hauer SSP2
- Today (2025)
- 248,603 people
- By 2030
- 259,345 · +4.3%
- By 2040
- 277,666 · +11.7%
- By 2050
- 289,599 · +16.5%
- By 2075
- 311,681 · +25.4%
- By 2100
- 302,738 · +21.8%
Race, ethnicity, and origin ACS 2023
- Neighborhood character
- Predominantly White (90%)
- Race & ethnicity
- White 90% Two or more races 4% Hispanic / Latino 3% Asian 3%
- Common ancestry
- Slovak 3% Italian 2% Romanian 2%
- Foreign-born
- 3% · China, Canada
- Languages at home
- 95% English-only · Spanish 2% Other Indo-European 1% Chinese 1%
Political lean MEDSL · Warren
- 2024 margin
- Solid R (+31.5) · D 33.8% · R 65.3%
- 2008→2024 swing
- +4.5pp toward D · 2008: -36.1pp · 2024: -31.5pp
- All cycles
- 2024: R+31.5 2020: R+30.8 2016: R+37.6 2012: R+39.5 2008: R+36.1
Not yet ingested
- Civics
- —
Market trends
- HPI YoY
- ▼ -192.03%
- Current HPI
- 235.1612
- Rent YoY
- ▲ 4.20%
- Metro
- Cincinnati, OH-KY-IN
- State GDP YoY
- ▲ 1.98%
- F500 in state
- 48
Industry mix (Fortune 500 HQ in OH)
| Industry | F500 HQs | Revenue |
|---|---|---|
| Insurance | 3 | $145B |
|
||
| Industrial Machinery | 3 | $49B |
|
||
| Financial Services | 3 | $24B |
|
||
| Consumer Goods | 2 | $93B |
|
||
| Aerospace / Defense | 2 | $47B |
|
||
| Utilities | 2 | $33B |
|
||
Price history
+274.8% since first listed2 events — show timeline
- 2026-05-26 Listed $149,900 Dayton MLS
- 2019-11-05 Sold (Public Records) $40,000 Public Records
Property tax history
+2.1%/yrLatest (2025): $1,119 · +6.1% YoY. Source: county tax records.
Cash-flow waterfall
monthlySold comps — $/sqft
last 12 mo · ≤1 miLoading sold comps…