 🏷️ Likely Rental
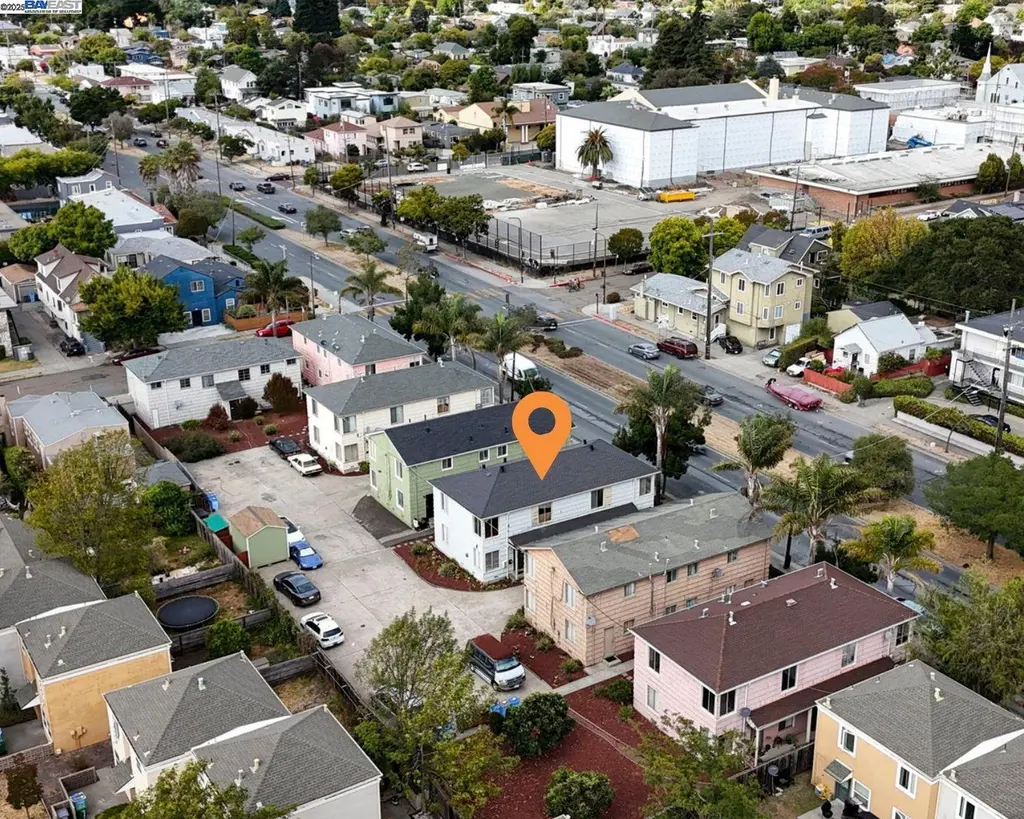
2774 Sacramento St · Berkeley, CA
Flood risk 1/10 · Minimal
- FEMA flood zone
- X (unshaded)
- Chance of flooding over 30 yrs
- 0.0%
- Est. flood insurance / yr
- $507 – $1,088
Fire risk 1/10 · Minimal
- Est. fire insurance / yr
- $659 – $1,223
Heat risk 3/10 · Minor
- Hot days now (above 82°F)
- 7 days/yr
- Hot days in 30 yrs
- 15 days/yr
Wind risk 1/10 · Minimal
- Chance of severe wind over 30 yrs
- —
Air-quality risk 9/10 · Severe
- Unhealthy air days now
- 16 days/yr
- Unhealthy air days in 30 yrs
- 16 days/yr
Risk factors via First Street. Map © Google.
Why this score? — see what drove the B grade
The composite is a weighted blend of 9 inputs, each scored 0–100. Each bar is that input's sub-score; the figure is the points it added to the 100-point composite (weight × sub-score).
- Cash flow +30.0/30.0
- 1% rule +10.0/10.0
- DSCR +10.0/10.0
- ARV discount +7.5/15.0
- Schools +5.7/10.0
- Livability +3.9/5.0
- Rent growth +3.4/5.0
- Condition / age +2.5/5.0
- Appreciation +0.0/10.0
$635,000
🖨 Deal sheet 📄 Offer letter ✓ Due diligence
Multi-family units
County records classify this as Multi-Family (2-4 Unit). Listing-text estimate: 4 units. confirmed
Listing remarks MLS
This striking quadruplex boasts 2,486 sq ft of living area on a generous 4,346 sq ft lot, offering a rare combination of income potential, flexibility, and outdoor space. Each unit is designed to capture natural light, highlight architectural character, and accommodate modern finishes. The expansive lot allows for private patios, shared garden courtyards, or tranquil green zones—ideal for tenant enjoyment or creative outdoor enhancements. Nearby, you’ll find terrific transit connections, neighborhood cafés, eclectic shops, and cultural amenities associated with Berkeley’s vibrant character. Whether for an investor or an owner-user, this quadplex offers standout scale, location, and potential in one of the East Bay’s most dynamic enclaves.
Key facts
- Tranquil green zones
- Neighborhood cafés
- Private patios
Tags
Neighborhood map
What this means for you Summary
Snapshot
- This is a 4 × 5-bed/4.0-bath units multifamily listed at $635k.
Deal economics
- At list price, monthly cash flow is $11k ($131k/yr) — positive. Per door: $3k/mo.
- The deal already cash-flows at list — no discount required.
- Meets the 1% rule at list price ($19k rent vs $635k).
- Recommended offer: $559k (12.0% below list) — sets the bar for market timing.
- Cap rate 26.9% vs local median 2.0% in Berkeley — top-decile yield for the area; either an underpriced asset or a hidden risk that comps aren't pricing in. Stress-test before assuming the spread holds.
Location & tenants
- Location reads 77/100 on livability (#74 in CA, #2,860 nationally) — a middle-class / working-renter tenant base. Strengths: schools A+, amenities A+, commute A+; Watch: crime F, cost of living F.
- Berkeley Unified (urban): math 61% / reading 67% proficiency, ranked #175 of 1,400 in CA (top 12%) — acceptable for families but not a draw, mixed tenant base, ~2y average lease.
- Market conditions: Rents rising (+3.6%/yr); 42 active listings in the ZIP; 11 comparable units currently listed for rent nearby; rentals leasing fast (median 5d on market — plan ~1-2 weeks tenant-placement turnaround); solid renter incomes; 1,742 units permitted in Alameda County in 2024 (856 in 5+ unit buildings).
- At $19,215/mo this rent would consume 231% of the median local household income ($100k/yr) (locally 1183% of renters already pay >50% of income on rent) — very limited rent-growth headroom before tenants either downsize or default.
Forward outlook
- Local home prices are declining (-3.0%/yr); year-one equity from $4k of loan paydown is wiped out by about $19k of value loss. Plan a longer hold.
- Alameda County population projected at +34% by 2050 — long-run rental-demand tailwind backs the buy-and-hold thesis.
- At projected returns (-3.0% appreciation + 3.6% rent growth), your $178k cash investment doubles in ~2 years — after that, you're playing with house money.
Negotiation context
- It's been on market 259 days — a 12% lower offer ($559k) is reasonable based on typical stale-listing flexibility.
Risks & watch-outs
- Watch-outs: built in 1943 — expect roof / HVAC / electrical / plumbing capex.
Questions for the listing agent
- It's been on market 259 days. Have you received any prior offers? Is the seller open to a 12% concession, seller financing, or rate buy-down credit?
- Can we see the unit-by-unit rent roll, current vacancy, and any below-market leases? What's the average tenancy length?
- What capital expenditures (roof, boiler, parking lot, exteriors) have been made in the last 5 years, and what's planned in the next 2?
- Built in 1943 — when were the roof, HVAC, electrical panel, plumbing, and water heater last replaced?
- Why hasn't it sold? Are there any deal-killer items the seller is aware of (foundation, flood, title, zoning, code violations)?
- Is there a deadline driving the sale (1031 exchange, divorce, estate, relocation)? That informs how much negotiation room exists.
- Schools are A-rated — typically a magnet for longer-tenancy family renters. What's the average tenant stay here, and is there a school-zone premium baked into asking?
- Crime grade is F in this area — have there been break-ins, vandalism, or insurance claims at this property in the last 3 years? What carrier currently insures it and at what premium?
- What's the average days-on-market for RENTAL listings here right now (not sales)? A rising rental-DOM trend means longer vacancies and softer asking-rent achievability than the comps imply.
- What's the recent tenant-quality profile in this submarket — average credit score on applications, eviction rate, late-payment / NSF rate, and stable-employment percentage? A property-management company in the area should have these aggregated.
- How much new apartment / multifamily construction is in the pipeline within 1–3 miles? Heavy new supply (>2% of stock underway) typically softens rents 12–24 months out; light construction supports rent growth.
Investment metrics
- 1% rule
- 3.03% ✓
- Cap rate
- 26.89%
- Cash-on-cash
- 73.57%
- DSCR
- 4.27
- GRM
- 2.8
CMA / ARV
- ARV (median comp)
- $1,279,298
- List price
- $635,000
- Delta
- -50.36%
- Verdict
- UNDERPRICED
- Comps
- 20 within 1.0 mi
Show comp detail 8 sales within ~0.75 mi
| Address | Dist | Beds/Ba | Sqft | Sold | Price | $/sf | Match |
|---|---|---|---|---|---|---|---|
| 2914 Stanton St | 0.20mi | 5/3.0 (+1) | 2,355 (-5%) | 9mo | $1,250,000 | $531 | 66 |
| 3110 California St | 0.46mi | 5/4.0 (+1) | 2,244 (-10%) | 1mo | $1,200,000 | $535 | 57 |
| 1916 Woolsey St | 0.72mi | 5/3.0 (+1) | 2,571 (+3%) | 9mo | $1,705,000 | $663 | 45 |
| 2514-2516 Mathews St | 0.47mi | 5/3.0 (+1) | 2,177 (-12%) | 9mo | $2,100,000 | $965 | 41 |
| 2304 Roosevelt Ave | 0.66mi | 4/4.0 | 2,292 (-8%) | 18mo | $1,050,000 | $458 | 41 |
| 1313 Haskell St | 0.42mi | 5/5.0 (+1) | 2,203 (-11%) | 21mo | $1,530,000 | $695 | 35 |
| 2006 Parker St | 0.67mi | 5/3.0 (+1) | 2,204 (-11%) | 9mo | $1,350,000 | $613 | 33 |
| 1817 Woolsey St | 0.59mi | 5/3.0 (+1) | 2,265 (-9%) | 21mo | $1,040,000 | $459 | 31 |
Match score weights: distance 35% · size 25% · config 20% · recency 20%. Top-matched comps best support the ARV.
Projected returns pro-forma
-3.0% appreciation · 3.65% rent growth · sell at horizon
- IRR
- 74.1%
- Equity multiple
- 4.40×
- Total profit
- $604,242
- Equity at exit
- $94,681
- IRR
- 78.0%
- Equity multiple
- 9.29×
- Total profit
- $1,473,640
- Equity at exit
- $54,903
Cash invested: $177,800 (down + closing). Projections, not guarantees.
Landlord ↔ Tenant lean methodology
- Overall (CITY)
- 0 Strongly Tenant-Friendly
- State California
- 18 Strongly Tenant-Friendly · D+13
- County
- — inherits STATE
- City Berkeley
- 0 Strongly Tenant-Friendly · D+78
ZIP-level market 94702
- Rents YoY
- 3.6%
- Active inventory
- 42
- Price-to-rent
- 11.0×
Monthly cashflow live
- Estimated rent
- $19,215 high interval (Pro) →
- Mortgage (P&I)
- −$3,330
- Tax from tax record
- −$685 /mo · $8,215/yr
- Insurance
- −$265
- HOA
- −$0
- Vacancy / Maint / Mgmt
- −$4,035
- Net cashflow
- $10,901
Break-even live
4-unit breakdown (identical units grouped — click to expand)
| Units | Beds | Baths | Est. rent |
|---|---|---|---|
| 4× units | 5 | 4 | $19,216 |
| #1 | 5 | 4 | $4,804 |
| #2 | 5 | 4 | $4,804 |
| #3 | 5 | 4 | $4,804 |
| #4 | 5 | 4 | $4,804 |
| Total (4 units) | $19,215 | ||
UW: 25.0% down · 7.5% · 30yr · 1.5% tax · 5.0% vac · 8.0% maint · 8.0% mgmt
Financing live
Cash to close
- Down payment
- $158,750
- Closing costs
- $19,050
- Reserves months
- —
- Total cash needed
- —
Loan-product check · same deal, 3 products live
Conventional
25% down · 7.5% · 30yr
- Down + closing
- —
- Monthly P&I
- —
- Monthly cashflow
- —
- DSCR
- —
- Eligible?
- —
Personal DTI + credit; lowest rate.
DSCR
20% down · 8.5% · 30yr
- Down + closing
- —
- Monthly P&I
- —
- Monthly cashflow
- —
- DSCR
- —
- Eligible?
- —
No personal income docs; deal must DSCR.
Hard money
10% down · 12.0% · 12mo
- Down + closing
- —
- Monthly P&I
- —
- Monthly cashflow
- —
- DSCR
- —
- Eligible?
- —
Short-term bridge; refi at stabilization.
Rent comps 11 comps
| Address | Beds | Baths | Sqft | Rent | $/sqft | DOM | Units | Dist |
|---|---|---|---|---|---|---|---|---|
| 1316 Russell St Berkeley, CA | 4.0 | 2.5 | 2200 | $8,500 | $3.86 | 1d | 1 | 0.27mi |
| 2726 Wallace St Berkeley, CA | 3.0 | 3.0 | 1856 | $6,300 | $3.39 | 2d | 1 | 0.39mi |
| 2038 Parker St Berkeley, CA | 3.0 | 1.0–2.5 | 1118 | $6,921 | $6.19 | 1d | 17 | 0.76mi |
| 2113 Ashby Ave Berkeley, CA | 5.0 | 1.5 | 1605 | $5,300 | $3.30 | 21d | 1 | 0.77mi |
| 2154 Ashby Ave Berkeley, CA | 4.0 | 2.5 | 1628 | $6,000 | $3.69 | 43d | 1 | 0.87mi |
| 1122 University Ave Berkeley, CA | 5.0 | 1.0–4.0 | 1129 | $5,617 | $4.97 | 1d | 20 | 1.02mi |
| 6301 Shellmound St Emeryville, CA | 3.0 | 1.0–3.0 | 1233 | $4,850 | $3.93 | 2d | 1 | 1.21mi |
| 1730 Francisco St Berkeley, CA | 5.0 | 3.5 | 2250 | $8,000 | $3.56 | 24d | 1 | 1.22mi |
| 976 55th St Oakland, CA | 4.0 | 3.0 | 2200 | $5,495 | $2.50 | 43d | 1 | 1.23mi |
| 6022 Telegraph Ave Oakland, CA | 5.0 | 3.0 | 1900 | $5,199 | $2.74 | 5d | 1 | 1.27mi |
| 396 62nd St Oakland, CA | 3.0 | 2.0 | 2126 | $8,950 | $4.21 | 43d | 1 | 1.40mi |
Listing history 17 events
-
2026-06-18days on market $635,000 Active 259 DOM
-
2026-06-17days on market $635,000 Active 258 DOM
-
2026-06-16days on market $635,000 Active 257 DOM
-
2026-06-15days on market $635,000 Active 256 DOM
-
2026-06-13days on market $635,000 Active 254 DOM
-
2026-06-13days on market $635,000 Active 253 DOM
-
2026-06-09days on market $635,000 Active 250 DOM
-
2026-06-08days on market $635,000 Active 249 DOM
-
2026-06-07days on market $635,000 Active 248 DOM
-
2026-06-04days on market $635,000 Active 245 DOM
-
2026-06-03days on market $635,000 Active 244 DOM
-
2026-06-02days on market $635,000 Active 243 DOM
-
2026-06-01days on market $635,000 Active 242 DOM
-
2026-05-31days on market $635,000 Active 241 DOM
-
2026-05-13price $635,000 779-char remark
Show marketing remark (779 chars)
This striking quadruplex boasts 2,486 sq ft of living area on a generous 4,346 sq ft lot, offering a rare combination of income potential, flexibility, and outdoor space. Each unit is designed to capture natural light, highlight architectural character, and accommodate modern finishes. The expansive lot allows for private patios, shared garden courtyards, or tranquil green zones—ideal for tenant enjoyment or creative outdoor enhancements. Nearby, you’ll find terrific transit connections, neighborhood cafés, eclectic shops, and cultural amenities associated with Berkeley’s vibrant character. Whether for an investor or an owner-user, this quadplex offers standout scale, location, and potential in one of the East Bay’s most dynamic enclaves.
-
2025-12-10price $875,000 779-char remark
Show marketing remark (779 chars)
This striking quadruplex boasts 2,486 sq ft of living area on a generous 4,346 sq ft lot, offering a rare combination of income potential, flexibility, and outdoor space. Each unit is designed to capture natural light, highlight architectural character, and accommodate modern finishes. The expansive lot allows for private patios, shared garden courtyards, or tranquil green zones—ideal for tenant enjoyment or creative outdoor enhancements. Nearby, you’ll find terrific transit connections, neighborhood cafés, eclectic shops, and cultural amenities associated with Berkeley’s vibrant character. Whether for an investor or an owner-user, this quadplex offers standout scale, location, and potential in one of the East Bay’s most dynamic enclaves.
-
2025-10-02$1,110,000 Active 779-char remark
Show marketing remark (779 chars)
This striking quadruplex boasts 2,486 sq ft of living area on a generous 4,346 sq ft lot, offering a rare combination of income potential, flexibility, and outdoor space. Each unit is designed to capture natural light, highlight architectural character, and accommodate modern finishes. The expansive lot allows for private patios, shared garden courtyards, or tranquil green zones—ideal for tenant enjoyment or creative outdoor enhancements. Nearby, you’ll find terrific transit connections, neighborhood cafés, eclectic shops, and cultural amenities associated with Berkeley’s vibrant character. Whether for an investor or an owner-user, this quadplex offers standout scale, location, and potential in one of the East Bay’s most dynamic enclaves.
ⓘ Source: listings_history table (triggers on properties + properties_extension) + one-shot
backfill from property_details.listing_events for pre-trigger history.
Tax reassessment forecast CA · Resets to sale price
- Current annual tax
- $8,215 · $685/mo
- Projected year-2 tax
- $8,215 · $685/mo
- Expected delta
- $0/yr ($0/mo · 0.0%)
ⓘ Screening estimate from a state-policy table — verify with the county assessor before closing.
Climate risk First Street
- Flood 1/10 Low FEMA zone X (unshaded) · 0% chance over 30 yrs
- Wildfire 1/10 Low
- Heat 3/10 Moderate 7 d/yr ≥82°F today · 15 d/yr by 30 yrs out
- Wind 1/10 Low
- Air quality 9/10 Extreme 16 unhealthy d/yr today · 16 by 30 yrs out
Nearby sold comps map
Loading sold comps map…
Walkable amenities ~0.75 mi
Loading nearby amenities…
Taxation est. · year 1
- Rental income
- $230,580
- − Mortgage interest
- −$35,570
- − Property taxes
- −$8,215
- − Insurance
- −$3,175
- − Repairs & maintenance
- −$18,446
- − Management
- −$18,446
- − Depreciation
- −$18,473
- Taxable income
- $128,254
- Est. tax owed @ 24.0%
- −$30,781
- After-tax cash flow
- $100,027/yr
For passive investors: Depreciation is non-cash, so a rental often shows a tax loss while cash-flowing — sheltering income. Rental losses are passive: they offset passive income freely, and up to $25,000/yr can offset ordinary (W-2) income if you actively participate and your MAGI is under $100k (phasing out to $0 by $150k); unused losses carry forward. On sale, claimed depreciation is recaptured at up to 25%, and gains may owe capital-gains tax (a 1031 exchange can defer both). Figures are a year-1 estimate at your 24.0% rate — not tax advice; consult a CPA.
Schools (NCES district)
- District
- Berkeley Unified
- NCES district ID
- 0604740
- Math proficiency
- 61% ▲ 2.00%
- Reading proficiency
- 67% ▲ 2.00%
- Median HH income
- $66,202
- Composite
- 57.37/100
- National rank
- #2288
- State rank
- #175 of 1400 in CA
Livability — Berkeley
- Score
- 77/100
- State rank
- #74
- US rank
- #2860
Category grades
Schools grade is shown separately in the Schools card above.
Census & demographics
- Census place
- Berkeley, CA
- County
- Alameda County · 1,614,355 people
- City population
- 121,632
- Metro
- San Francisco-Oakland-Berkeley, CA
- Population (ZIP)
- 17,635
- Household income
- $99,775
- Rent vs Own
- Severe rent burden
- 1183.0
Population outlook (Alameda County) Hauer SSP2
- Today (2025)
- 1,928,884 people
- By 2030
- 2,069,146 · +7.3%
- By 2040
- 2,338,405 · +21.2%
- By 2050
- 2,586,608 · +34.1%
- By 2075
- 3,061,911 · +58.7%
- By 2100
- 3,234,133 · +67.7%
Race, ethnicity, and origin ACS 2023
- Neighborhood character
- Highly diverse neighborhood (Simpson 0.71)
- Race & ethnicity
- White 48% Black 15% Asian 14% Two or more races 13% Hispanic / Latino 12%
- Hispanic origin (detail)
- Mexican 8%
- Common ancestry
- Romanian 3% Lithuanian 2% Italian 2%
- Foreign-born
- 19% · Canada, China, Vietnam
- Languages at home
- 78% English-only · Spanish 8% Chinese 3% Other Indo-European 3%
Political lean MEDSL · Alameda
- 2024 margin
- Solid D (+53.6) · D 74.6% · R 21.0% · Other 4.4%
- 2008→2024 swing
- -5.9pp toward R · 2008: 59.5pp · 2024: 53.6pp
- All cycles
- 2024: D+53.6 2020: D+62.5 2016: D+64.4 2012: D+59.8 2008: D+59.5
Not yet ingested
- Civics
- —
Market trends
- HPI YoY
- ▼ -1257.77%
- Current HPI
- 327.4724
- Rent YoY
- ▲ 3.65%
- Metro
- San Francisco-Oakland-Berkeley, CA
- State GDP YoY
- ▲ 3.21%
- F500 in state
- 116
Industry mix (Fortune 500 HQ in CA)
| Industry | F500 HQs | Revenue |
|---|---|---|
| Technology | 27 | $1,492B |
|
||
| Financial Services | 3 | $174B |
|
||
| Retail | 3 | $44B |
|
||
| Insurance | 3 | $26B |
|
||
| Media / Entertainment | 2 | $115B |
|
||
| Pharmaceuticals / Biotech | 2 | $62B |
|
||
Price history
-42.8% since first listed3 events — show timeline
- 2026-05-13 Price Changed $635,000 bridgeMLS, Bay East AOR, or Contra Costa AOR
- 2025-12-10 Price Changed $875,000 bridgeMLS, Bay East AOR, or Contra Costa AOR
- 2025-10-02 Listed $1,110,000 bridgeMLS, Bay East AOR, or Contra Costa AOR
Property tax history
+4.6%/yrLatest (2025): $8,215 · +21.4% YoY. Source: county tax records.
Cash-flow waterfall
monthlySold comps — $/sqft
last 12 mo · ≤1 miLoading sold comps…