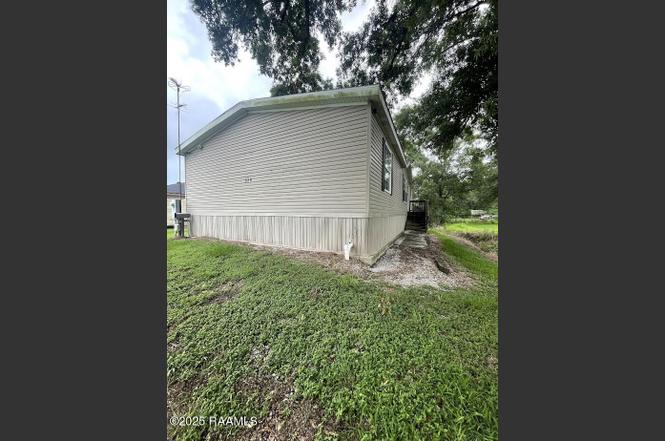
319 E Lovell St · Crowley, LA
Flood risk 9/10 · Severe
- FEMA flood zone
- A
- Chance of flooding over 30 yrs
- 0.99%
- Est. flood insurance / yr
- $1,009 – $1,996
Fire risk 1/10 · Minimal
- Est. fire insurance / yr
- $1,269 – $2,357
Heat risk 9/10 · Severe
- Hot days now (above 109°F)
- 7 days/yr
- Hot days in 30 yrs
- 20 days/yr
Wind risk 9/10 · Severe
- Chance of severe wind over 30 yrs
- 99.0%
Air-quality risk 1/10 · Minimal
- Unhealthy air days now
- 0 days/yr
- Unhealthy air days in 30 yrs
- 0 days/yr
Risk factors via First Street. Map © Google.
Why this score? — see what drove the B- grade
The composite is a weighted blend of 9 inputs, each scored 0–100. Each bar is that input's sub-score; the figure is the points it added to the 100-point composite (weight × sub-score).
- Cash flow +30.0/30.0
- 1% rule +10.0/10.0
- DSCR +10.0/10.0
- ARV discount +7.5/15.0
- Schools +3.2/10.0
- Livability +3.2/5.0
- Rent growth +2.5/5.0
- Condition / age +2.5/5.0
- Appreciation +0.0/10.0
$49,900
🖨 Deal sheet (PDF) 📄 Offer letter ✓ Due diligence
Listing remarks
This spacious home offers 3 bedrooms, 2 baths with open living room and kitchen. Great investor property, fixer upper! Schedule your showing today!
Key facts
- 8,276 sq ft lot
- Parking
- Listed 378 days
Property features AI
Exterior
- Parking: Open parking
- Utilities: Public sewer; Electric service: CLECO
- Home design: Manufactured home; Property marked as fixer
- Construction: Vinyl siding construction
- Exterior features: Vinyl siding
Interior
- Bathrooms: 2 full bathrooms
- Interior features: Central air conditioning; Central heating
Neighborhood map
What this means for you Summary
Snapshot
- This is a 3-bed/2.0-bath manufactured listed at $50k.
Deal economics
- At list price, monthly cash flow is $506 ($6k/yr) — positive.
- The deal already cash-flows at list — no discount required.
- Meets the 1% rule at list price ($1k rent vs $50k).
- Recommended offer: $44k (12.0% below list) — sets the bar for market timing.
- Cap rate 21.5% vs local median 3.5% in Crowley — top-decile yield for the area; either an underpriced asset or a hidden risk that comps aren't pricing in. Stress-test before assuming the spread holds.
Location & tenants
- Location reads 65/100 on livability (#145 in LA) — a middle-class / working-renter tenant base. Strengths: cost of living A+, health & safety A+, housing A-; Watch: crime F, amenities F, commute F.
- Acadia Parish (rural): math 32% / reading 44% proficiency, ranked #28 of 98 in LA (top 29%) — families likely to look elsewhere, expect single-tenant / working-renter base with shorter leases; 62% free/reduced lunch — lower-income household profile, screen leases tightly.
- Zoned schools: South Crowley Elementary School (math 22% / reading 32%, grade F, #359 of 646 statewide, top 57%, 301 students, 86% FRL); Crowley Middle School (math 9% / reading 17%, grade F, #189 of 218 statewide, top 87%, 449 students, 83% FRL); Crowley High School (math 22% / reading 27%, grade F, #153 of 265 statewide, top 62%, 536 students, 76% FRL) — zoned schools average 82% FRL vs 62% district-wide (20 pts higher); higher-poverty schools than district average — tighter screening recommended.
- Zoned-school proficiency averages 22% at this address vs 38% district-wide (-16 pts) — the specific schools serving this property underperform the Acadia Parish average; the district grade overstates school quality for this exact location.
- Market conditions: 96 active listings in the ZIP; 137 units permitted in Acadia Parish in 2024 (0 in 5+ unit buildings).
Forward outlook
- Local home prices are declining (-3.0%/yr); year-one equity from $345 of loan paydown is wiped out by about $1k of value loss. Plan a longer hold.
- At projected returns (-3.0% appreciation + 3.0% rent growth), your $14k cash investment doubles in ~3 years — after that, you're playing with house money.
Negotiation context
- It's been on market 378 days — a 12% lower offer ($44k) is reasonable based on typical stale-listing flexibility.
- 6 sale attempts since 2y ago; this cycle's ask has dropped $16k (24%) from the opening price — seller is motivated, your offer sets the floor, not the list.
Risks & watch-outs
- Watch-outs: flood insurance adds $125/mo.
- Climate carrying-cost: in FEMA flood zone A (mandatory federal flood insurance); severe wind risk, 99% chance of damaging wind over 30y; extreme-heat days projected 7→20/yr by 2055 (HVAC capex compounding) — expect insurance premiums to compound above CPI over the hold.
Questions for the listing agent
- It's been on market 378 days. Have you received any prior offers? Is the seller open to a 12% concession, seller financing, or rate buy-down credit?
- What's the actual annual flood-insurance premium (NFIP or private), and is the property in a SFHA with mandatory coverage?
- Why hasn't it sold? Are there any deal-killer items the seller is aware of (foundation, flood, title, zoning, code violations)?
- Is there a deadline driving the sale (1031 exchange, divorce, estate, relocation)? That informs how much negotiation room exists.
- Schools are B-rated — typically a magnet for longer-tenancy family renters. What's the average tenant stay here, and is there a school-zone premium baked into asking?
- Crime grade is F in this area — have there been break-ins, vandalism, or insurance claims at this property in the last 3 years? What carrier currently insures it and at what premium?
- What's the average days-on-market for RENTAL listings here right now (not sales)? A rising rental-DOM trend means longer vacancies and softer asking-rent achievability than the comps imply.
- What's the recent tenant-quality profile in this submarket — average credit score on applications, eviction rate, late-payment / NSF rate, and stable-employment percentage? A property-management company in the area should have these aggregated.
- How much new for-sale + rental construction is in the pipeline within 1–3 miles? Heavy new supply typically softens prices + rents 12–24 months out; constrained supply supports both.
Investment metrics
- 1% rule
- 2.45% ✓
- Cap rate
- 21.46%
- Cash-on-cash
- 54.18%
- DSCR
- 3.41
- GRM
- 3.4
CMA / ARV
No comps found within radius.
Projected returns pro-forma
-3.0% appreciation · 3.0% rent growth · sell at horizon
- IRR
- 40.4%
- Equity multiple
- 2.73×
- Total profit
- $24,205
- Equity at exit
- $7,440
- IRR
- 46.7%
- Equity multiple
- 5.50×
- Total profit
- $62,904
- Equity at exit
- $4,314
Cash invested: $13,972 (down + closing). Projections, not guarantees.
Landlord ↔ Tenant lean methodology
- Overall (STATE)
- 90 Strongly Landlord-Friendly
- State Louisiana
- 90 Strongly Landlord-Friendly · R+12
- County
- — inherits STATE
- City
- — inherits STATE
ZIP-level market 70526
- Active inventory
- 96
- Price-to-rent
- 3.4×
Monthly cashflow live
- Estimated rent
- $1,222 medium interval (Pro) →
- Mortgage (P&I)
- −$262
- Tax from tax record
- −$52 /mo · $624/yr
- Insurance
- −$21
- Flood insurance flood zone
- −$125 /mo · $1,502/yr
- HOA
- −$0
- Vacancy / Maint / Mgmt
- −$257
- Net cashflow
- $506
Break-even live
Sensitivity live
| Price | -10% $534 | -5% $520 | +0% $506 | +5% $491 | +10% $477 |
|---|---|---|---|---|---|
| Rent | -10% $409 | -5% $457 | +0% $506 | +5% $554 | +10% $602 |
| Rate | -1.0pp $531 | -0.5pp $518 | base $506 | +0.5pp $493 | +1.0pp $480 |
UW: 25.0% down · 7.5% · 30yr · 1.5% tax · 5.0% vac · 8.0% maint · 8.0% mgmt
Financing live
Cash to close
- Down payment
- $12,475
- Closing costs
- $1,497
- Reserves months
- —
- Total cash needed
- —
Loan-product check · same deal, 3 products live
Conventional
25% down · 7.5% · 30yr
- Down + closing
- —
- Monthly P&I
- —
- Monthly cashflow
- —
- DSCR
- —
- Eligible?
- —
Personal DTI + credit; lowest rate.
DSCR
20% down · 8.5% · 30yr
- Down + closing
- —
- Monthly P&I
- —
- Monthly cashflow
- —
- DSCR
- —
- Eligible?
- —
No personal income docs; deal must DSCR.
Hard money
10% down · 12.0% · 12mo
- Down + closing
- —
- Monthly P&I
- —
- Monthly cashflow
- —
- DSCR
- —
- Eligible?
- —
Short-term bridge; refi at stabilization.
Listing history 38 events
-
2026-06-21days on market $49,900 Active 378 DOM
-
2026-06-21days on market $49,900 Active 377 DOM
-
2026-06-18days on market $49,900 Active 375 DOM
-
2026-06-17days on market $49,900 Active 374 DOM
-
2026-06-16days on market $49,900 Active 373 DOM
-
2026-06-15days on market $49,900 Active 372 DOM
-
2026-06-13days on market $49,900 Active 370 DOM
-
2026-06-12days on market $49,900 Active 369 DOM
-
2026-06-09days on market $49,900 Active 366 DOM
-
2026-06-08days on market $49,900 Active 365 DOM
-
2026-06-07days on market $49,900 Active 364 DOM
-
2026-06-07days on market $49,900 Active 363 DOM
-
2026-06-04days on market $49,900 Active 360 DOM
-
2026-06-02days on market $49,900 Active 359 DOM
-
2026-06-01days on market $49,900 Active 358 DOM
-
2026-05-31days on market $49,900 Active 357 DOM
-
2026-05-31days on market $49,900 Active 356 DOM
-
2026-05-04price $49,900
-
2026-01-31status Active
-
2025-12-30status Active
-
2025-11-04status Active
-
2025-09-09price $56,900
-
2025-08-02price $59,750
-
2025-07-04price $62,500
-
2025-05-30$65,650 Active
-
2025-04-08price $65,650
-
2025-03-07price $65,750
-
2025-02-07price $69,000
-
2024-11-23price $79,850
-
2024-11-22status Active
-
2024-10-22price $83,950
-
2024-09-13price $87,950
-
2024-08-08price $91,850
-
2024-07-12price $95,750
-
2024-06-06price $99,900
-
2024-04-29$104,900 Active
-
2016-06-30soldstatus $110,078
-
2006-11-08soldstatus
ⓘ Source: listings_history table (triggers on properties + properties_extension) + one-shot
backfill from property_details.listing_events for pre-trigger history.
Tax reassessment forecast LA · Resets to sale price
- Current annual tax
- $624 · $52/mo
- Projected year-2 tax
- $624 · $52/mo
- Expected delta
- $0/yr ($0/mo · 0.0%)
ⓘ Screening estimate from a state-policy table — verify with the county assessor before closing.
Climate risk First Street
- Flood 9/10 Extreme FEMA zone A · 99% chance over 30 yrs
- Wildfire 1/10 Low
- Heat 9/10 Extreme 7 d/yr ≥109°F today · 20 d/yr by 30 yrs out
- Wind 9/10 Extreme 99% chance of damaging wind over 30 yrs
- Air quality 1/10 Low 0 unhealthy d/yr today · 0 by 30 yrs out
Nearby sold comps map
Loading sold comps map…
Walkable amenities ~0.75 mi
Loading nearby amenities…
Taxation est. · year 1
- Rental income
- $14,662
- − Mortgage interest
- −$2,795
- − Property taxes
- −$624
- − Insurance
- −$1,752
- − Repairs & maintenance
- −$1,173
- − Management
- −$1,173
- − Depreciation
- −$1,452
- Taxable income
- $5,694
- Est. tax owed @ 24.0%
- −$1,366
- After-tax cash flow
- $4,701/yr
For passive investors: Depreciation is non-cash, so a rental often shows a tax loss while cash-flowing — sheltering income. Rental losses are passive: they offset passive income freely, and up to $25,000/yr can offset ordinary (W-2) income if you actively participate and your MAGI is under $100k (phasing out to $0 by $150k); unused losses carry forward. On sale, claimed depreciation is recaptured at up to 25%, and gains may owe capital-gains tax (a 1031 exchange can defer both). Figures are a year-1 estimate at your 24.0% rate — not tax advice; consult a CPA.
Schools (NCES district)
- District
- Acadia Parish
- NCES district ID
- 2200030
- Math proficiency
- 32% ▼ -39.00%
- Reading proficiency
- 44% ▼ -32.00%
- Median HH income
- $38,012
- Composite
- 31.65/100
- National rank
- #5929
- State rank
- #28 of 98 in LA
Livability — Crowley
- Score
- 65/100
- State rank
- #145
- US rank
- #12669
Category grades
Schools grade is shown separately in the Schools card above.
Census & demographics
- City population
- 16,740
- Population (ZIP)
- 16,740
Population outlook (Acadia County) Hauer SSP2
- Today (2025)
- 63,846 people
- By 2030
- 64,141 · +0.5%
- By 2040
- 63,922 · +0.1%
- By 2050
- 62,263 · -2.5%
- By 2075
- 56,507 · -11.5%
- By 2100
- 46,316 · -27.5%
Race, ethnicity, and origin ACS 2023
- Neighborhood character
- Predominantly White (72%)
- Race & ethnicity
- White 72% Black 20% Two or more races 6% Hispanic / Latino 2%
- Common ancestry
- Lithuanian 14% Italian 2%
- Foreign-born
- 1% · Canada
- Languages at home
- 95% English-only · French/Haitian/Cajun 4% Spanish 1%
Political lean MEDSL · Acadia
- 2024 margin
- Solid R (+64.0) · D 17.6% · R 81.5%
- 2008→2024 swing
- -18.3pp toward R · 2008: -45.7pp · 2024: -64.0pp
- All cycles
- 2024: R+64.0 2020: R+60.3 2016: R+56.7 2012: R+49.8 2008: R+45.7
Not yet ingested
- Civics
- —
Market trends
- HPI YoY
- ▼ -52.11%
- Current HPI
- 88.3686
- Rent YoY
- —
- Metro
- —
- State GDP YoY
- ▲ 3.29%
- F500 in state
- 10
Industry mix (Fortune 500 HQ in LA)
| Industry | F500 HQs | Revenue |
|---|---|---|
| Telecommunications | 2 | $23B |
|
||
| Utilities | 1 | $12B |
|
||
| Wholesale / Distribution | 1 | $5B |
|
||
| Advertising | 1 | $2B |
|
||
Price history
-54.7% since first listed21 events — show timeline
- 2026-05-04 Price Changed $49,900 AcadianaMLS
- 2026-01-31 Relisted — AcadianaMLS
- 2025-12-30 Relisted — AcadianaMLS
- 2025-11-04 Relisted — AcadianaMLS
- 2025-09-09 Price Changed $56,900 AcadianaMLS
- 2025-08-02 Price Changed $59,750 AcadianaMLS
- 2025-07-04 Price Changed $62,500 AcadianaMLS
- 2025-05-30 Listed $65,650 AcadianaMLS
- 2025-04-08 Price Changed $65,650 AcadianaMLS
- 2025-03-07 Price Changed $65,750 AcadianaMLS
- 2025-02-07 Price Changed $69,000 AcadianaMLS
- 2024-11-23 Price Changed $79,850 AcadianaMLS
- 2024-11-22 Relisted — AcadianaMLS
- 2024-10-22 Price Changed $83,950 AcadianaMLS
- 2024-09-13 Price Changed $87,950 AcadianaMLS
- 2024-08-08 Price Changed $91,850 AcadianaMLS
- 2024-07-12 Price Changed $95,750 AcadianaMLS
- 2024-06-06 Price Changed $99,900 AcadianaMLS
- 2024-04-29 Listed $104,900 AcadianaMLS
- 2016-06-30 Sold (Public Records) $110,078 Public Records
- 2006-11-08 Sold (Public Records) — Public Records
Property tax history
+30.3%/yrLatest (2025): $624 · +0.3% YoY. Source: county tax records.
Cash-flow waterfall
monthlySold comps — $/sqft
last 12 mo · ≤1 miLoading sold comps…