473 12th Ave S · Naples, FL
Flood risk 9/10 · Severe
- FEMA flood zone
- AE
- Chance of flooding over 30 yrs
- 0.99%
- Est. flood insurance / yr
- $1,737 – $8,500
Fire risk 1/10 · Minimal
- Est. fire insurance / yr
- $947 – $1,759
Heat risk 10/10 · Severe
- Hot days now (above 107°F)
- 7 days/yr
- Hot days in 30 yrs
- 26 days/yr
Wind risk 10/10 · Severe
- Chance of severe wind over 30 yrs
- 99.0%
Air-quality risk 3/10 · Minor
- Unhealthy air days now
- 3 days/yr
- Unhealthy air days in 30 yrs
- 3 days/yr
Risk factors via First Street. Map © Google.
Why this score? — see what drove the A- grade
The composite is a weighted blend of 9 inputs, each scored 0–100. Each bar is that input's sub-score; the figure is the points it added to the 100-point composite (weight × sub-score).
- Cash flow +30.0/30.0
- 1% rule +10.0/10.0
- DSCR +10.0/10.0
- ARV discount +7.5/15.0
- Appreciation +7.0/10.0
- Schools +5.0/10.0
- Rent growth +4.7/5.0
- Livability +4.0/5.0
- Condition / age +2.5/5.0
$275,000
🖨 Deal sheet 📄 Offer letter ✓ Due diligence
Listing remarks MLS
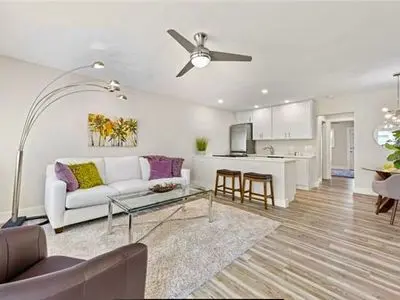
C. 9092 - Prime location, bright and airy, 2nd floor apt with crown molding, plantation shutters, custom mirrors, walk-in closet, plus lots of closet space. Extra storage, liberal rental policy - not over 55 complex. Community pool and clubhouse. New range and refrigerator.
Key facts
- Clubhouse
- Rehabbed
- Pool
Tags
Neighborhood map
What this means for you Summary
Snapshot
- This is a 1-bed/1.0-bath condo listed at $275k.
Deal economics
- At list price, monthly cash flow is $608 ($7k/yr) — positive.
- The deal already cash-flows at list — no discount required.
- Meets the 1% rule at list price ($5k rent vs $275k).
- Recommended offer: $267k (3.0% below list) — sets the bar for market timing.
Location & tenants
- Location reads 80/100 on livability (#126 in FL, #1,903 nationally) — a professional / high-income tenant draw. Strengths: crime A+, amenities A+, employment A+; Watch: commute D+, cost of living F.
- Collier (suburban): math 60% / reading 56% proficiency, ranked #16 of 73 in FL (top 22%) — acceptable for families but not a draw, mixed tenant base, ~2y average lease.
- Market conditions: Rents rising fast (+8.8%/yr); 614 active listings in the ZIP; 40 comparable units currently listed for rent nearby; rentals at typical pace (median 23d on market — plan ~3-4 weeks tenant-placement turnaround); high-income renter base; 3,520 units permitted in Collier County in 2024 (959 in 5+ unit buildings).
- This rent runs 43% of the median local income ($131k/yr) — at the standard rent-burdened threshold; future hikes will face affordability resistance.
Forward outlook
- In year one you build about $13k of equity ($2k loan paydown + $11k appreciation (4.1% local appreciation)).
- Collier County population projected at +30% by 2050 — long-run rental-demand tailwind backs the buy-and-hold thesis.
- At projected returns (4.1% appreciation + 8.0% rent growth), your $77k cash investment doubles in ~4 years — after that, you're playing with house money.
- By year 3, paydown + projected appreciation supports a ~$32k cash-out refi (75% LTV) — recoverable capital for the next deal without selling this one.
Negotiation context
- It's been on market 31 days — a 3% lower offer ($267k) is reasonable based on typical stale-listing flexibility.
- 10 sale attempts since 18y ago with the ask held roughly flat each time — persistent listings suggest the price (not the market) is what's stuck; bring a comps-based counter.
- Current owner paid $160k; list at $275k implies a 72% gain — meaningful room to come down on a strong offer.
Risks & watch-outs
- Watch-outs: flood insurance adds $427/mo.
- Climate carrying-cost: in FEMA flood zone AE (mandatory federal flood insurance); severe wind risk, 99% chance of damaging wind over 30y; extreme-heat days projected 7→26/yr by 2055 (HVAC capex compounding) — expect insurance premiums to compound above CPI over the hold.
Questions for the listing agent
- It's been on market 31 days. Have you received any prior offers? Is the seller open to a 3% concession, seller financing, or rate buy-down credit?
- What's the actual annual flood-insurance premium (NFIP or private), and is the property in a SFHA with mandatory coverage?
- What does the HOA fee cover, when was the last increase, and are there any pending special assessments or reserve-fund shortfalls?
- Any open or pending special assessments — roof, HVAC, plumbing, elevator, façade? What's the per-unit balance and payoff schedule, and is the seller paying it off at close or rolling it to the buyer?
- Is there a deadline driving the sale (1031 exchange, divorce, estate, relocation)? That informs how much negotiation room exists.
- Schools are B-rated — typically a magnet for longer-tenancy family renters. What's the average tenant stay here, and is there a school-zone premium baked into asking?
- What's the average days-on-market for RENTAL listings here right now (not sales)? A rising rental-DOM trend means longer vacancies and softer asking-rent achievability than the comps imply.
- What's the recent tenant-quality profile in this submarket — average credit score on applications, eviction rate, late-payment / NSF rate, and stable-employment percentage? A property-management company in the area should have these aggregated.
- How much new apartment / multifamily construction is in the pipeline within 1–3 miles? Heavy new supply (>2% of stock underway) typically softens rents 12–24 months out; light construction supports rent growth.
Investment metrics
- 1% rule
- 1.70% ✓
- Cap rate
- 10.81%
- Cash-on-cash
- 16.12%
- DSCR
- 1.72
- GRM
- 4.9
CMA / ARV
No comps found within radius.
Projected returns pro-forma
4.08% appreciation · 8.0% rent growth · sell at horizon
- IRR
- 23.4%
- Equity multiple
- 2.47×
- Total profit
- $113,395
- Equity at exit
- $140,773
- IRR
- 26.9%
- Equity multiple
- 5.90×
- Total profit
- $377,464
- Equity at exit
- $231,325
Cash invested: $77,000 (down + closing). Projections, not guarantees.
Landlord ↔ Tenant lean methodology
- Overall (STATE)
- 87 Strongly Landlord-Friendly
- State Florida
- 87 Strongly Landlord-Friendly · R+3
- County
- — inherits STATE
- City
- — inherits STATE
ZIP-level market 34102
- Home prices YoY
- 1.3%
- Rents YoY
- 8.8%
- Active inventory
- 614
- Price-to-rent
- 4.9×
Monthly cashflow live
- Estimated rent
- $4,665 medium interval (Pro) →
- Mortgage (P&I)
- −$1,442
- Tax est. 1.5%
- −$344 /mo · $4,125/yr
- Insurance
- −$115
- Flood insurance flood zone
- −$427 /mo · $5,118/yr
- HOA est. from 2 same-building comps
- −$750
- Vacancy / Maint / Mgmt
- −$980
- Net cashflow
- $608
Break-even live
UW: 25.0% down · 7.5% · 30yr · 1.5% tax · 5.0% vac · 8.0% maint · 8.0% mgmt
Financing live
Cash to close
- Down payment
- $68,750
- Closing costs
- $8,250
- Reserves months
- —
- Total cash needed
- —
Loan-product check · same deal, 3 products live
Conventional
25% down · 7.5% · 30yr
- Down + closing
- —
- Monthly P&I
- —
- Monthly cashflow
- —
- DSCR
- —
- Eligible?
- —
Personal DTI + credit; lowest rate.
DSCR
20% down · 8.5% · 30yr
- Down + closing
- —
- Monthly P&I
- —
- Monthly cashflow
- —
- DSCR
- —
- Eligible?
- —
No personal income docs; deal must DSCR.
Hard money
10% down · 12.0% · 12mo
- Down + closing
- —
- Monthly P&I
- —
- Monthly cashflow
- —
- DSCR
- —
- Eligible?
- —
Short-term bridge; refi at stabilization.
Rent comps 40 comps
| Address | Beds | Baths | Sqft | Rent | $/sqft | DOM | Units | Dist |
|---|---|---|---|---|---|---|---|---|
| 404 Broad Ave S Unit H404 Naples, FL | 2.0 | 2.0 | 890 | $9,995 | $11.23 | 23d | 1 | 0.02mi |
| 421 12th Ave S Unit A1 Naples, FL | 2.0 | 1.0 | 760 | $6,400 | $8.42 | 13d | 1 | 0.03mi |
| 473 12th Ave S Naples, FL | 1.0–2.0 | 1.0–2.0 | 700 | $3,000 | $4.29 | 23d | 2 | 0.04mi |
| 546 Broad Ave S #546 Naples, FL | 2.0 | 2.0 | 890 | $4,800 | $5.39 | 23d | 1 | 0.09mi |
| 609 12th Ave S #609 Naples, FL | 2.0 | 2.0 | 860 | $8,000 | $9.30 | 23d | 1 | 0.18mi |
| 636 Broad Ave S Unit 1259386P Naples, FL | 2.0 | 2.0 | 882 | $4,307 | $4.88 | 13d | 1 | 0.18mi |
| 940 3rd St S Naples, FL | 1.0–2.0 | 1.0–2.0 | 870 | $2,800 | $3.22 | 23d | 2 | 0.28mi |
| 1295 Gulf Shore Blvd S #218 Naples, FL | 2.0 | 2.0 | 662 | $10,479 | $15.83 | 23d | 1 | 0.29mi |
| 960 7th St S #103 Naples, FL | 1.0 | 1.0 | 534 | $5,000 | $9.36 | 23d | 1 | 0.30mi |
| 351 8th Ave S #351 Naples, FL | 2.0 | 2.0 | 930 | $4,000 | $4.30 | 23d | 1 | 0.38mi |
| 291 8th Ave S Unit 291A Naples, FL | 1.0 | 1.0 | 550 | $3,900 | $7.09 | 23d | 1 | 0.39mi |
| 250 7th Ave S #301 Naples, FL | 2.0 | 2.0 | 1000 | $10,000 | $10.00 | 23d | 1 | 0.43mi |
| 666 3rd St S Naples, FL | 1.0–2.0 | 1.0–2.0 | 932 | $2,500 | $2.68 | 13d | 2 | 0.46mi |
| 365 5th Ave S #303 Naples, FL | 2.0 | 2.0 | 1090 | $13,000 | $11.93 | 23d | 1 | 0.58mi |
| 950 7th Ave S #23 Naples, FL | 1.0 | 1.0 | 631 | $3,250 | $5.15 | 13d | 1 | 0.60mi |
| 980 7th Ave S Naples, FL | 1.0 | 1.0 | 540 | $7,500 | $13.89 | 23d | 2 | 0.61mi |
| 480 5th St S #102 Naples, FL | 1.0 | 1.0 | 600 | $6,500 | $10.83 | 23d | 1 | 0.62mi |
| 540 4th Ave S #13 Naples, FL | 1.0 | 1.0 | 580 | $5,000 | $8.62 | 23d | 1 | 0.62mi |
| 388 4th Ave S #388 Naples, FL | 2.0 | 2.0 | 965 | $13,000 | $13.47 | 23d | 1 | 0.63mi |
| 175 5th Ave S Naples, FL | 2.0 | 2.0 | 732 | $14,000 | $19.13 | 23d | 2 | 0.63mi |
| 296 4th Ave S #296 Naples, FL | 2.0 | 2.5 | 1120 | $2,950 | $2.63 | 21d | 1 | 0.64mi |
| 1100 8th Ave S Naples, FL | 2.0 | 2.0 | 1218 | $9,000 | $7.39 | 13d | 5 | 0.67mi |
| 230 3rd Ave S #4 Naples, FL | 2.0 | 2.5 | 978 | $12,000 | $12.27 | 23d | 1 | 0.72mi |
| 290 4th St S #202 Naples, FL | 2.0 | 2.0 | 1058 | $10,000 | $9.45 | 23d | 1 | 0.74mi |
| 286 4th St S #203 Naples, FL | 2.0 | 2.0 | 1058 | $10,000 | $9.45 | 23d | 1 | 0.74mi |
| 284 4th St S #103 Naples, FL | 2.0 | 2.0 | 979 | $9,000 | $9.19 | 23d | 1 | 0.74mi |
| 282 4th St S Naples, FL | 2.0 | 2.0 | 1058 | $11,000 | $10.40 | 23d | 1 | 0.74mi |
| 1360 Chesapeake Ave Unit 1372 Naples, FL | 1.0 | 1.0 | 600 | $1,850 | $3.08 | 23d | 1 | 0.82mi |
| 805 River Point Dr Unit 307C Naples, FL | 1.0 | 1.0 | 816 | $2,700 | $3.31 | 23d | 1 | 0.84mi |
| 803 River Point Dr Unit 201B Naples, FL | 1.0 | 1.0 | 715 | $2,300 | $3.22 | 23d | 1 | 0.86mi |
| 801 River Point Dr Unit 303A Naples, FL | 1.0 | 1.0 | 815 | $5,000 | $6.13 | 21d | 1 | 0.87mi |
| 1395 Curlew Ave Unit 4-3 Naples, FL | 2.0 | 2.0 | 975 | $7,000 | $7.18 | 23d | 1 | 0.87mi |
| 1435 Curlew Ave #1 Naples, FL | 2.0 | 2.0 | 975 | $2,850 | $2.92 | 23d | 1 | 0.91mi |
| 1435 Curlew Ave #1 Naples, FL | 2.0 | 2.0 | 975 | $2,850 | $2.92 | 21d | 1 | 0.91mi |
| 101 8th St S Naples, FL | 1.0 | 1.0–2.0 | 940 | $12,600 | $13.40 | 23d | 4 | 0.91mi |
| 101 8th St S Naples, FL | 1.0 | 1.0–2.0 | 940 | $12,600 | $13.40 | 13d | 4 | 0.91mi |
| 1555 Blue Point Ave Unit 3 Naples, FL | 2.0 | 2.0 | 1025 | $1,745 | $1.70 | 13d | 1 | 0.95mi |
| 766 Central Ave Naples, FL | 2.0–3.0 | 2.0 | 855 | $6,300 | $7.37 | 21d | 3 | 0.95mi |
| 766 Central Ave Naples, FL | 2.0–3.0 | 2.0 | 943 | $5,000 | $5.30 | 13d | 4 | 0.95mi |
| 450 Bayfront Pl Naples, FL | 1.0–3.0 | 1.0–2.5 | 1324 | $5,500 | $4.15 | 23d | 6 | 0.96mi |
HOA detail condo
- Monthly dues
- $0 · $0/yr
- Likely covers
- pool
- Assessments
- None detected in remarks — confirm with the listing agent.
Listing history 28 events
-
2026-06-15days on market $275,000 Active 31 DOM
-
2026-06-10days on market $275,000 Active 26 DOM
-
2026-06-09days on market $275,000 Active 25 DOM
-
2026-06-08days on market $275,000 Active 24 DOM
-
2026-06-07days on market $275,000 Active 23 DOM
-
2026-06-02days on market $275,000 Active 18 DOM
-
2026-06-01days on market $275,000 Active 17 DOM
-
2026-05-31days on market $275,000 Active 16 DOM
-
2026-05-30days on market $275,000 Active 15 DOM
-
2026-05-16$275,000 Active
-
2026-04-22$2,200
-
2024-07-22historical $2,500
-
2024-07-02$2,500
-
2024-06-05historical $2,500
-
2024-05-23$2,500
-
2024-04-29historical $2,500
-
2024-04-27$2,500
-
2024-04-03historical $2,500
-
2024-03-28$2,500
-
2022-06-12price $6,000
-
2014-02-27historical
-
2013-12-27$274,000
-
2013-03-25soldstatus $160,000 274-char remark
Show marketing remark (274 chars)
C. 9092 - Prime location, bright and airy, 2nd floor apt with crown molding, plantation shutters, custom mirrors, walk-in closet, plus lots of closet space. Extra storage, liberal rental policy - not over 55 complex. Community pool and clubhouse. New range and refrigerator.
-
2013-02-13$199,000 274-char remark
Show marketing remark (274 chars)
C. 9092 - Prime location, bright and airy, 2nd floor apt with crown molding, plantation shutters, custom mirrors, walk-in closet, plus lots of closet space. Extra storage, liberal rental policy - not over 55 complex. Community pool and clubhouse. New range and refrigerator.
-
2009-12-31historical
-
2008-06-25$5,800,000
-
2008-06-25historical
-
2008-06-24$3,900,000
ⓘ Source: listings_history table (triggers on properties + properties_extension) + one-shot
backfill from property_details.listing_events for pre-trigger history.
Climate risk First Street
- Flood 9/10 Extreme FEMA zone AE · 99% chance over 30 yrs
- Wildfire 1/10 Low
- Heat 10/10 Extreme 7 d/yr ≥107°F today · 26 d/yr by 30 yrs out
- Wind 10/10 Extreme 99% chance of damaging wind over 30 yrs
- Air quality 3/10 Moderate 3 unhealthy d/yr today · 3 by 30 yrs out
Nearby sold comps map
Loading sold comps map…
Walkable amenities ~0.75 mi
Loading nearby amenities…
Taxation est. · year 1
- Rental income
- $55,976
- − Mortgage interest
- −$15,404
- − Property taxes
- −$4,125
- − Insurance
- −$6,494
- − Repairs & maintenance
- −$4,478
- − Management
- −$4,478
- − HOA
- −$9,000
- − Depreciation
- −$8,000
- Taxable income
- $3,997
- Est. tax owed @ 24.0%
- −$959
- After-tax cash flow
- $6,338/yr
For passive investors: Depreciation is non-cash, so a rental often shows a tax loss while cash-flowing — sheltering income. Rental losses are passive: they offset passive income freely, and up to $25,000/yr can offset ordinary (W-2) income if you actively participate and your MAGI is under $100k (phasing out to $0 by $150k); unused losses carry forward. On sale, claimed depreciation is recaptured at up to 25%, and gains may owe capital-gains tax (a 1031 exchange can defer both). Figures are a year-1 estimate at your 24.0% rate — not tax advice; consult a CPA.
Schools (NCES district)
- District
- Collier
- NCES district ID
- 1200330
- Math proficiency
- 60% ▼ -4.00%
- Reading proficiency
- 56% ▼ -2.00%
- Median HH income
- $58,275
- Composite
- 50.23/100
- National rank
- #1892
- State rank
- #16 of 73 in FL
Livability — Naples
- Score
- 80/100
- State rank
- #126
- US rank
- #1903
Category grades
Schools grade is shown separately in the Schools card above.
Census & demographics
- Census place
- Naples, FL
- County
- Collier County · 396,295 people
- City population
- 344,941
- Metro
- Naples-Marco Island, FL
- Population (ZIP)
- 11,179
- Household income
- $130,929
- Rent vs Own
- Severe rent burden
- 333.0
Population outlook (Collier County) Hauer SSP2
- Today (2025)
- 420,858 people
- By 2030
- 450,054 · +6.9%
- By 2040
- 502,232 · +19.3%
- By 2050
- 544,932 · +29.5%
- By 2075
- 627,203 · +49.0%
- By 2100
- 659,015 · +56.6%
Race, ethnicity, and origin ACS 2023
- Neighborhood character
- Predominantly White (79%)
- Race & ethnicity
- White 79% Hispanic / Latino 9% Two or more races 8% Black 8% Asian 1%
- Hispanic origin (detail)
- Cuban 6%
- Common ancestry
- Hispanic 4% Lithuanian 4% Romanian 4%
- Foreign-born
- 17% · Canada, China
- Languages at home
- 87% English-only · Spanish 7% French/Haitian/Cajun 4% German/W. Germanic 1%
Political lean MEDSL · Collier
- 2024 margin
- Solid R (+33.1) · D 33.1% · R 66.2%
- 2008→2024 swing
- -10.6pp toward R · 2008: -22.5pp · 2024: -33.1pp
- All cycles
- 2024: R+33.1 2020: R+24.7 2016: R+26.0 2012: R+30.1 2008: R+22.5
Not yet ingested
- Civics
- —
Market trends
- HPI YoY
- ▲ 4.08%
- Current HPI
- 328.2755
- Rent YoY
- ▲ 8.75%
- Metro
- Naples-Marco Island, FL
- State GDP YoY
- ▲ 3.28%
- F500 in state
- 36
Industry mix (Fortune 500 HQ in FL)
| Industry | F500 HQs | Revenue |
|---|---|---|
| Industrial Technology | 2 | $29B |
|
||
| Insurance | 2 | $17B |
|
||
| Retail | 1 | $60B |
|
||
| Technology Distribution | 1 | $58B |
|
||
| Homebuilding | 1 | $35B |
|
||
| Technology Manufacturing | 1 | $35B |
|
||
Price history
-92.9% since first listed19 events — show timeline
- 2026-05-16 Listed $275,000 FSBO.com
- 2026-04-22 Listed for Rent $2,200 BUILDIUM
- 2024-07-22 Rental Removed $2,500 BUILDIUM
- 2024-07-02 Listed for Rent $2,500 BUILDIUM
- 2024-06-05 Rental Removed $2,500 BUILDIUM
- 2024-05-23 Listed for Rent $2,500 BUILDIUM
- 2024-04-29 Rental Removed $2,500 BUILDIUM
- 2024-04-27 Listed for Rent $2,500 BUILDIUM
- 2024-04-03 Rental Removed $2,500 BUILDIUM
- 2024-03-28 Listed for Rent $2,500 BUILDIUM
- 2022-06-12 Price Changed $6,000 BUILDIUM
- 2014-02-27 Listing Removed — FORTMLS
- 2013-12-27 Listed $274,000 FORTMLS
- 2013-03-25 Sold (MLS) $160,000 NAPLESMLS
- 2013-02-13 Listed $199,000 NAPLESMLS
- 2009-12-31 Listing Removed — NAPLESMLS
- 2008-06-25 Listing Removed — NAPLESMLS
- 2008-06-25 Listed $5,800,000 NAPLESMLS
- 2008-06-24 Listed $3,900,000 NAPLESMLS
Cash-flow waterfall
monthlySold comps — $/sqft
last 12 mo · ≤1 miLoading sold comps…