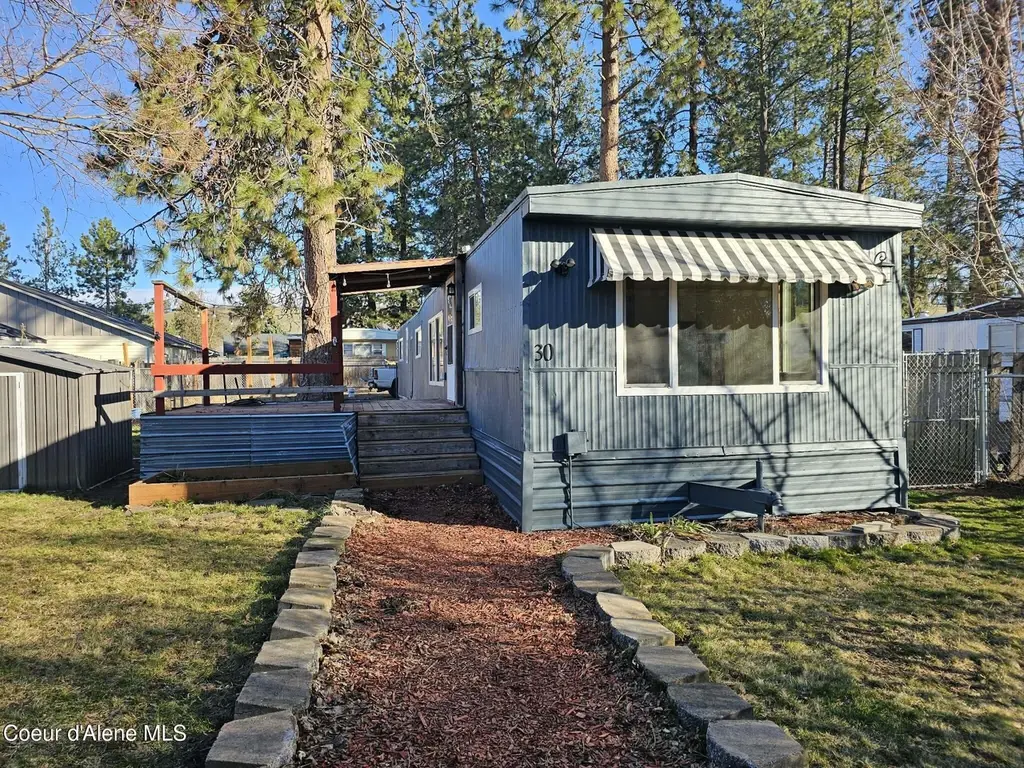
4301 E Maplewood Ave #30 · Post Falls, ID
Flood risk 1/10 · Minimal
- FEMA flood zone
- X (unshaded)
- Chance of flooding over 30 yrs
- 0.0%
- Est. flood insurance / yr
- $507 – $1,088
Fire risk 4/10 · Minor
- Est. fire insurance / yr
- $584 – $1,086
Heat risk 2/10 · Minimal
- Hot days now (above 92°F)
- 7 days/yr
- Hot days in 30 yrs
- 16 days/yr
Wind risk 1/10 · Minimal
- Chance of severe wind over 30 yrs
- —
Air-quality risk 8/10 · Major
- Unhealthy air days now
- 13 days/yr
- Unhealthy air days in 30 yrs
- 17 days/yr
Risk factors via First Street. Map © Google.
Why this score? — see what drove the C+ grade
The composite is a weighted blend of 9 inputs, each scored 0–100. Each bar is that input's sub-score; the figure is the points it added to the 100-point composite (weight × sub-score).
- Cash flow +30.0/30.0
- 1% rule +10.0/10.0
- DSCR +10.0/10.0
- Livability +4.4/5.0
- Schools +4.2/10.0
- Rent growth +2.9/5.0
- Condition / age +2.5/5.0
- ARV discount +0.0/15.0
- Appreciation +0.0/10.0
$100,021
🖨 Deal sheet 📄 Offer letter ✓ Due diligence
Listing remarks
Come check out this newly remodeled home! New carport, New flooring, and freshly painted in and out. This 2 bed 1 bath home would make a great starter home. Don't miss your chance to get your foot in the door of the housing market in Kootenai county. Also as an added bonus seller will pay the first 3 months lot rent!!!
Key facts
- Newly remodeled home
- New carport
- Built 1973
Tags
Property features AI
Finance
- HOA & community: Has an association (Savory) with monthly fees; Association covers sewer, water, and snow removal
Exterior
- Parking: Paved parking
- Utilities: Community water; Community sewer
- Home design: Mobile home; Entry on main level
- Construction: Built with miscellaneous/other materials; Rubber roof; Pillar/post/pier foundation
- Exterior features: Open deck; Back yard fencing; Shed(s); Level lot; Located on a cul-de-sac
Interior
- Kitchen: Cooktop; Refrigerator
- Bedrooms: 2 bedrooms on the main level
- Flooring: LVP flooring
- Bathrooms: 1 bathroom on the main level
- Heating & cooling: Natural gas and electric heating; Furnace
- Interior features: Fireplace with insert; Washer hookup
- Laundry & utility: Washer; Electric dryer; Electric dryer hookup; Gas water heater
Neighborhood map
What this means for you Summary
Snapshot
- This is a 2-bed/1.0-bath single-family listed at $100k.
Deal economics
- At list price, monthly cash flow is $658 ($8k/yr) — positive.
- The deal already cash-flows at list — no discount required.
- Meets the 1% rule at list price ($2k rent vs $100k).
- Recommended offer: $91k (9.0% below list) — sets the bar for market timing.
- Cap rate 14.2% vs local median 2.2% in Post Falls — top-decile yield for the area; either an underpriced asset or a hidden risk that comps aren't pricing in. Stress-test before assuming the spread holds.
Location & tenants
- Location reads 88/100 on livability (#1 in ID, #198 nationally) — a professional / high-income tenant draw. Strengths: crime A+, commute A+, housing A+.
- Post Falls District (suburban): math 43% / reading 56% proficiency, ranked #31 of 92 in ID (top 34%) — families likely to look elsewhere, expect single-tenant / working-renter base with shorter leases.
- Market conditions: Rents rising (+1.5%/yr); 625 active listings in the ZIP; 2 comparable units currently listed for rent nearby; solid renter incomes; 1,606 units permitted in Kootenai County in 2024 (154 in 5+ unit buildings).
Forward outlook
- Local home prices are declining (-3.0%/yr); year-one equity from $692 of loan paydown is wiped out by about $3k of value loss. Plan a longer hold.
- Kootenai County population projected at +33% by 2050 — long-run rental-demand tailwind backs the buy-and-hold thesis.
- At projected returns (-3.0% appreciation + 1.5% rent growth), your $28k cash investment doubles in ~5 years — after that, you're playing with house money.
Negotiation context
- It's been on market 103 days — a 9% lower offer ($91k) is reasonable based on typical stale-listing flexibility.
Questions for the listing agent
- It's been on market 103 days. Have you received any prior offers? Is the seller open to a 9% concession, seller financing, or rate buy-down credit?
- Built in 1973 — when were the roof, HVAC, electrical panel, plumbing, and water heater last replaced?
- Why hasn't it sold? Are there any deal-killer items the seller is aware of (foundation, flood, title, zoning, code violations)?
- Is there a deadline driving the sale (1031 exchange, divorce, estate, relocation)? That informs how much negotiation room exists.
- What's the average days-on-market for RENTAL listings here right now (not sales)? A rising rental-DOM trend means longer vacancies and softer asking-rent achievability than the comps imply.
- What's the recent tenant-quality profile in this submarket — average credit score on applications, eviction rate, late-payment / NSF rate, and stable-employment percentage? A property-management company in the area should have these aggregated.
- How much new for-sale + rental construction is in the pipeline within 1–3 miles? Heavy new supply typically softens prices + rents 12–24 months out; constrained supply supports both.
Investment metrics
- 1% rule
- 1.71% ✓
- Cap rate
- 14.19%
- Cash-on-cash
- 28.21%
- DSCR
- 2.26
- GRM
- 4.9
CMA / ARV
- ARV (on-the-fly)
- $75,516
- Comps found
- 7
Show comp detail 7 sales within ~0.75 mi
| Address | Dist | Beds/Ba | Sqft | Sold | Price | $/sf | Match |
|---|---|---|---|---|---|---|---|
| 4301 E Maplewood Ave #2 | 0.02mi | 2/1.0 | 952 (+10%) | 10mo | $80,000 | $84 | 74 |
| 4301 E Maplewood Ave #6 | 0.02mi | 2/2.0 | 924 (+6%) | 23mo | $79,000 | $85 | 65 |
| 115 N Vine St | 0.68mi | 2/1.0 | 756 (-13%) | 10mo | $71,900 | $95 | 39 |
| 3196 E 3rd Ave | 0.71mi | 2/2.0 | 924 (+6%) | 16mo | $115,000 | $124 | 39 |
| 3219 E Osler Ave | 0.70mi | 3/1.0 (+1) | 924 (+6%) | 16mo | $80,000 | $87 | 38 |
| 160 N Cambie St | 0.70mi | 3/1.5 (+1) | 980 (+13%) | 2mo | $110,000 | $112 | 37 |
| 1356 N Highway 41 #33 | 0.65mi | 2/1.0 | 980 (+13%) | 16mo | $64,000 | $65 | 35 |
Match score weights: distance 35% · size 25% · config 20% · recency 20%. Top-matched comps best support the ARV.
Projected returns pro-forma
-3.0% appreciation · 1.46% rent growth · sell at horizon
- IRR
- 20.7%
- Equity multiple
- 1.83×
- Total profit
- $23,145
- Equity at exit
- $14,913
- IRR
- 27.8%
- Equity multiple
- 3.28×
- Total profit
- $63,884
- Equity at exit
- $8,648
Cash invested: $28,006 (down + closing). Projections, not guarantees.
Landlord ↔ Tenant lean methodology
- Overall (STATE)
- 91 Strongly Landlord-Friendly
- State Idaho
- 91 Strongly Landlord-Friendly · R+18
- County
- — inherits STATE
- City
- — inherits STATE
ZIP-level market 83854
- Rents YoY
- 1.5%
- Active inventory
- 625
- Price-to-rent
- 4.9×
Monthly cashflow live
- Estimated rent
- $1,708 medium interval (Pro) →
- Mortgage (P&I)
- −$525
- Tax est. 1.5%
- −$125 /mo · $1,500/yr
- Insurance
- −$42
- HOA
- −$0
- Vacancy / Maint / Mgmt
- −$359
- Net cashflow
- $658
Break-even live
UW: 25.0% down · 7.5% · 30yr · 1.5% tax · 5.0% vac · 8.0% maint · 8.0% mgmt
Financing live
Cash to close
- Down payment
- $25,005
- Closing costs
- $3,001
- Reserves months
- —
- Total cash needed
- —
Loan-product check · same deal, 3 products live
Conventional
25% down · 7.5% · 30yr
- Down + closing
- —
- Monthly P&I
- —
- Monthly cashflow
- —
- DSCR
- —
- Eligible?
- —
Personal DTI + credit; lowest rate.
DSCR
20% down · 8.5% · 30yr
- Down + closing
- —
- Monthly P&I
- —
- Monthly cashflow
- —
- DSCR
- —
- Eligible?
- —
No personal income docs; deal must DSCR.
Hard money
10% down · 12.0% · 12mo
- Down + closing
- —
- Monthly P&I
- —
- Monthly cashflow
- —
- DSCR
- —
- Eligible?
- —
Short-term bridge; refi at stabilization.
Rent comps 2 comps
| Address | Beds | Baths | Sqft | Rent | $/sqft | DOM | Units | Dist |
|---|---|---|---|---|---|---|---|---|
| 1090 N Cecil Rd Post Falls, ID | 3.0 | 1.0–2.0 | 914 | $1,602 | $1.75 | 21d | 1 | 1.05mi |
| 1812 E Coeur D Alene Ave Post Falls, ID | 3.0 | 2.0 | 1122 | $1,895 | $1.69 | 21d | 1 | 1.25mi |
Listing history 21 events
-
2026-06-19days on market $100,021 Active 103 DOM
-
2026-06-18days on market $100,021 Active 102 DOM
-
2026-06-17days on market $100,021 Active 101 DOM
-
2026-06-16days on market $100,021 Active 100 DOM
-
2026-06-15days on market $100,021 Active 99 DOM
-
2026-06-14days on market $100,021 Active 97 DOM
-
2026-06-13pricedays on market $100,021 Active 96 DOM
-
2026-06-10days on market $116,021 Active 94 DOM
-
2026-06-09days on market $116,021 Active 93 DOM
-
2026-06-08days on market $116,021 Active 92 DOM
-
2026-06-07days on market $116,021 Active 91 DOM
-
2026-06-05days on market $116,021 Active 88 DOM
-
2026-06-03days on market $116,021 Active 87 DOM
-
2026-06-02days on market $116,021 Active 86 DOM
-
2026-06-01days on market $116,021 Active 85 DOM
-
2026-05-31days on market $116,021 Active 84 DOM
-
2026-05-30days on market $116,021 Active 83 DOM
-
2026-05-04price $116,021
-
2026-04-16price $118,021
-
2026-04-06price $129,000
-
2026-03-08$135,000 Active
ⓘ Source: listings_history table (triggers on properties + properties_extension) + one-shot
backfill from property_details.listing_events for pre-trigger history.
Climate risk First Street
- Flood 1/10 Low FEMA zone X (unshaded) · 0% chance over 30 yrs
- Wildfire 4/10 Moderate
- Heat 2/10 Low 7 d/yr ≥92°F today · 16 d/yr by 30 yrs out
- Wind 1/10 Low
- Air quality 8/10 Severe 13 unhealthy d/yr today · 17 by 30 yrs out
Nearby sold comps map
Loading sold comps map…
Walkable amenities ~0.75 mi
Loading nearby amenities…
Taxation est. · year 1
- Rental income
- $20,501
- − Mortgage interest
- −$5,603
- − Property taxes
- −$1,500
- − Insurance
- −$500
- − Repairs & maintenance
- −$1,640
- − Management
- −$1,640
- − Depreciation
- −$2,910
- Taxable income
- $6,708
- Est. tax owed @ 24.0%
- −$1,610
- After-tax cash flow
- $6,291/yr
For passive investors: Depreciation is non-cash, so a rental often shows a tax loss while cash-flowing — sheltering income. Rental losses are passive: they offset passive income freely, and up to $25,000/yr can offset ordinary (W-2) income if you actively participate and your MAGI is under $100k (phasing out to $0 by $150k); unused losses carry forward. On sale, claimed depreciation is recaptured at up to 25%, and gains may owe capital-gains tax (a 1031 exchange can defer both). Figures are a year-1 estimate at your 24.0% rate — not tax advice; consult a CPA.
Schools (NCES district)
- District
- Post Falls District
- NCES district ID
- 1602670
- Math proficiency
- 43% ▼ -5.00%
- Reading proficiency
- 56% ▬ 0.00%
- Median HH income
- $49,504
- Composite
- 42.27/100
- National rank
- #3268
- State rank
- #31 of 92 in ID
Livability — Post Falls
- Score
- 88/100
- State rank
- #1
- US rank
- #198
Category grades
Schools grade is shown separately in the Schools card above.
Census & demographics
- County
- Kootenai County · 146,553 people
- City population
- 54,851
- Metro
- Coeur d'Alene, ID
- Population (ZIP)
- 54,851
- Household income
- $82,742
- Rent vs Own
- Severe rent burden
- 1218.0
Population outlook (Kootenai County) Hauer SSP2
- Today (2025)
- 177,692 people
- By 2030
- 190,689 · +7.3%
- By 2040
- 214,704 · +20.8%
- By 2050
- 236,510 · +33.1%
- By 2075
- 285,984 · +60.9%
- By 2100
- 316,459 · +78.1%
Race, ethnicity, and origin ACS 2023
- Neighborhood character
- Predominantly White (84%)
- Race & ethnicity
- White 84% Two or more races 10% Hispanic / Latino 6% Native American 1%
- Hispanic origin (detail)
- Mexican 4%
- Common ancestry
- Portuguese 4% Italian 3% Slovak 2%
- Foreign-born
- 2% · Canada
- Languages at home
- 96% English-only · Spanish 2%
Political lean MEDSL · Kootenai
- 2024 margin
- Solid R (+51.9) · D 22.9% · R 74.8% · Other 2.2%
- 2008→2024 swing
- -25.6pp toward R · 2008: -26.3pp · 2024: -51.9pp
- All cycles
- 2024: R+51.9 2020: R+42.9 2016: R+42.5 2012: R+34.3 2008: R+26.3
Not yet ingested
- Civics
- —
Market trends
- HPI YoY
- ▼ -259.70%
- Current HPI
- 259.7767
- Rent YoY
- ▲ 1.46%
- Metro
- Coeur d'Alene, ID
- State GDP YoY
- ▲ 4.51%
- F500 in state
- 6
Industry mix (Fortune 500 HQ in ID)
| Industry | F500 HQs | Revenue |
|---|---|---|
| Retail | 1 | $79B |
|
||
| Technology | 1 | $25B |
|
||
| Food / Agriculture | 1 | $6B |
|
||
Price history
-14.1% since first listed4 events — show timeline
- 2026-05-04 Price Changed $116,021 CDAMLS
- 2026-04-16 Price Changed $118,021 CDAMLS
- 2026-04-06 Price Changed $129,000 CDAMLS
- 2026-03-08 Listed $135,000 CDAMLS
Cash-flow waterfall
monthlySold comps — $/sqft
last 12 mo · ≤1 miLoading sold comps…