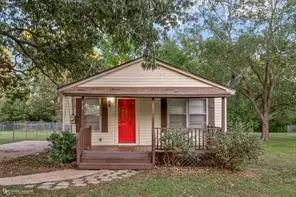
814 Lee St · Benton, LA
Flood risk No data
- FEMA flood zone
- —
- Chance of flooding over 30 yrs
- —
- Est. flood insurance / yr
- —
Fire risk No data
- Est. fire insurance / yr
- —
Heat risk No data
- Hot days now (above threshold)
- —
- Hot days in 30 yrs
- —
Wind risk No data
- Chance of severe wind over 30 yrs
- —
Air-quality risk No data
- Unhealthy air days now
- —
- Unhealthy air days in 30 yrs
- —
Risk factors via First Street. Map © Google.
Why this score? — see what drove the B- grade
The composite is a weighted blend of 9 inputs, each scored 0–100. Each bar is that input's sub-score; the figure is the points it added to the 100-point composite (weight × sub-score).
- Cash flow +26.2/30.0
- ARV discount +12.7/15.0
- DSCR +8.9/10.0
- 1% rule +6.3/10.0
- Schools +3.8/10.0
- Livability +3.6/5.0
- Rent growth +2.5/5.0
- Condition / age +2.5/5.0
- Appreciation +0.0/10.0
$140,000
🖨 Deal sheet (PDF) 📄 Offer letter ✓ Due diligence
Listing remarks MLS
FOR SALE IN THE HEART OF BENTON!!! INCOME PRODUCING PROPERTY! Investors, THIS ONE IS FOR YOU!!! This 3-bedroom, 2-bathroom, 1,050 square foot home is the one you have been looking for! Situated on a quiet street in Benton, this home offers a fresh look to a quaint country-style home! Close proximity to Benton shopping and dining, this home also qualifies for Rural Development, FHA, VA, Conventional, and Cash buyers alike! Investors, this is also a WONDERFUL move-in ready rental property! If you have been searching for an affordable, well-maintained home in Benton, THIS IS THE ONE! Call to schedule your showing TODAY!!!!
Key facts
- 5,345 sq ft lot
- Built 1952
- Listed 134 days
Neighborhood map
What this means for you Summary
Snapshot
- This is a 3-bed/2.0-bath single-family listed at $140k.
Deal economics
- At list price, monthly cash flow is $358 ($4k/yr) — positive.
- The deal already cash-flows at list — no discount required.
- Meets the 1% rule at list price ($2k rent vs $140k).
- Recommended offer: $123k (12.0% below list) — sets the bar for market timing.
- Cap rate 9.4% vs local median 3.4% in Benton — top-decile yield for the area; either an underpriced asset or a hidden risk that comps aren't pricing in. Stress-test before assuming the spread holds.
Location & tenants
- Location reads 72/100 on livability (#41 in LA) — a middle-class / working-renter tenant base. Strengths: cost of living A+, housing A+, crime A; Watch: amenities F, commute F, health & safety F.
- Bossier Parish (urban): math 40% / reading 47% proficiency, ranked #17 of 98 in LA (top 17%) — families likely to look elsewhere, expect single-tenant / working-renter base with shorter leases.
- Zoned schools: Kingston Elementary School (math 73% / reading 69%, grade A-, #23 of 646 statewide, top 4%, 820 students, 33% FRL); Benton Middle School (math 49% / reading 58%, grade C+, #21 of 218 statewide, top 9%, 850 students, 34% FRL); Benton High School (math 55% / reading 63%, grade C+, #22 of 265 statewide, top 8%, 1,538 students, 28% FRL).
- Zoned-school proficiency averages 61% at this address vs 44% district-wide (+18 pts) — the actual schools serving this property are materially stronger than the Bossier Parish average implies; a family-tenant draw the district grade alone would hide.
- Market conditions: 200 active listings in the ZIP; 716 units permitted in Bossier Parish in 2024 (0 in 5+ unit buildings).
Forward outlook
- Local home prices are declining (-3.0%/yr); year-one equity from $968 of loan paydown is wiped out by about $4k of value loss. Plan a longer hold.
- Bossier County population projected at +28% by 2050 — long-run rental-demand tailwind backs the buy-and-hold thesis.
- At projected returns (-3.0% appreciation + 3.0% rent growth), your $39k cash investment doubles in ~10 years — after that, you're playing with house money.
Negotiation context
- It's been on market 134 days — a 12% lower offer ($123k) is reasonable based on typical stale-listing flexibility.
- 11 sale attempts since 4y ago with the ask held roughly flat each time — persistent listings suggest the price (not the market) is what's stuck; bring a comps-based counter.
Risks & watch-outs
- Watch-outs: built in 1952 — expect roof / HVAC / electrical / plumbing capex.
Questions for the listing agent
- It's been on market 134 days. Have you received any prior offers? Is the seller open to a 12% concession, seller financing, or rate buy-down credit?
- Built in 1952 — when were the roof, HVAC, electrical panel, plumbing, and water heater last replaced?
- Why hasn't it sold? Are there any deal-killer items the seller is aware of (foundation, flood, title, zoning, code violations)?
- Is there a deadline driving the sale (1031 exchange, divorce, estate, relocation)? That informs how much negotiation room exists.
- Schools are A-rated — typically a magnet for longer-tenancy family renters. What's the average tenant stay here, and is there a school-zone premium baked into asking?
- What's the average days-on-market for RENTAL listings here right now (not sales)? A rising rental-DOM trend means longer vacancies and softer asking-rent achievability than the comps imply.
- What's the recent tenant-quality profile in this submarket — average credit score on applications, eviction rate, late-payment / NSF rate, and stable-employment percentage? A property-management company in the area should have these aggregated.
- How much new for-sale + rental construction is in the pipeline within 1–3 miles? Heavy new supply typically softens prices + rents 12–24 months out; constrained supply supports both.
Investment metrics
- 1% rule
- 1.13% ✓
- Cap rate
- 9.36%
- Cash-on-cash
- 10.96%
- DSCR
- 1.49
- GRM
- 7.3
CMA / ARV
- ARV (median comp)
- $158,096
- List price
- $140,000
- Delta
- -11.45%
- Verdict
- UNDERPRICED
- Comps
- 20 within 1.0 mi
Show comp detail 2 sales within ~0.75 mi
| Address | Dist | Beds/Ba | Sqft | Sold | Price | $/sf | Match |
|---|---|---|---|---|---|---|---|
| 910 Lee St | 0.08mi | 2/1.0 (-1) | 956 (-9%) | 3mo | $62,400 | $65 | 69 |
| 914 5th St | 0.70mi | 3/1.0 | 1,102 (+5%) | 17mo | $154,900 | $141 | 41 |
Match score weights: distance 35% · size 25% · config 20% · recency 20%. Top-matched comps best support the ARV.
Projected returns pro-forma
-3.0% appreciation · 3.0% rent growth · sell at horizon
- IRR
- 0.1%
- Equity multiple
- 1.00×
- Total profit
- $94
- Equity at exit
- $20,874
- IRR
- 9.7%
- Equity multiple
- 1.75×
- Total profit
- $29,361
- Equity at exit
- $12,105
Cash invested: $39,200 (down + closing). Projections, not guarantees.
Landlord ↔ Tenant lean methodology
- Overall (STATE)
- 90 Strongly Landlord-Friendly
- State Louisiana
- 90 Strongly Landlord-Friendly · R+12
- County
- — inherits STATE
- City
- — inherits STATE
ZIP-level market 71006
- Home prices YoY
- -30.4%
- Active inventory
- 200
- Price-to-rent
- 7.3×
Monthly cashflow live
- Estimated rent
- $1,588 medium interval (Pro) →
- Mortgage (P&I)
- −$734
- Tax from tax record
- −$104 /mo · $1,248/yr
- Insurance
- −$58
- HOA
- −$0
- Vacancy / Maint / Mgmt
- −$333
- Net cashflow
- $358
Break-even live
Sensitivity live
| Price | -10% $437 | -5% $398 | +0% $358 | +5% $318 | +10% $279 |
|---|---|---|---|---|---|
| Rent | -10% $233 | -5% $295 | +0% $358 | +5% $421 | +10% $483 |
| Rate | -1.0pp $428 | -0.5pp $394 | base $358 | +0.5pp $322 | +1.0pp $285 |
UW: 25.0% down · 7.5% · 30yr · 1.5% tax · 5.0% vac · 8.0% maint · 8.0% mgmt
Financing live
Cash to close
- Down payment
- $35,000
- Closing costs
- $4,200
- Reserves months
- —
- Total cash needed
- —
Loan-product check · same deal, 3 products live
Conventional
25% down · 7.5% · 30yr
- Down + closing
- —
- Monthly P&I
- —
- Monthly cashflow
- —
- DSCR
- —
- Eligible?
- —
Personal DTI + credit; lowest rate.
DSCR
20% down · 8.5% · 30yr
- Down + closing
- —
- Monthly P&I
- —
- Monthly cashflow
- —
- DSCR
- —
- Eligible?
- —
No personal income docs; deal must DSCR.
Hard money
10% down · 12.0% · 12mo
- Down + closing
- —
- Monthly P&I
- —
- Monthly cashflow
- —
- DSCR
- —
- Eligible?
- —
Short-term bridge; refi at stabilization.
Listing history 50 events
-
2026-06-21days on market $140,000 Active 134 DOM
-
2026-06-18days on market $140,000 Active 131 DOM
-
2026-06-17days on market $140,000 Active 130 DOM
-
2026-06-16days on market $140,000 Active 129 DOM
-
2026-06-15days on market $140,000 Active 128 DOM
-
2026-06-14days on market $140,000 Active 126 DOM
-
2026-06-13days on market $140,000 Active 125 DOM
-
2026-06-10days on market $140,000 Active 123 DOM
-
2026-06-09days on market $140,000 Active 122 DOM
-
2026-06-08days on market $140,000 Active 121 DOM
-
2026-06-07days on market $140,000 Active 120 DOM
-
2026-06-02days on market $140,000 Active 115 DOM
-
2026-06-01days on market $140,000 Active 114 DOM
-
2026-05-31days on market $140,000 Active 113 DOM
-
2026-05-30days on market $140,000 Active 112 DOM
-
2026-02-07$140,000 Active 627-char remark
Show marketing remark (627 chars)
FOR SALE IN THE HEART OF BENTON!!! INCOME PRODUCING PROPERTY! Investors, THIS ONE IS FOR YOU!!! This 3-bedroom, 2-bathroom, 1,050 square foot home is the one you have been looking for! Situated on a quiet street in Benton, this home offers a fresh look to a quaint country-style home! Close proximity to Benton shopping and dining, this home also qualifies for Rural Development, FHA, VA, Conventional, and Cash buyers alike! Investors, this is also a WONDERFUL move-in ready rental property! If you have been searching for an affordable, well-maintained home in Benton, THIS IS THE ONE! Call to schedule your showing TODAY!!!!
-
2026-02-06historical
-
2026-01-19status Active
-
2026-01-13status Pending
-
2025-11-18price $135,000
-
2025-09-05price $145,000
-
2025-08-27historical $1,200
-
2025-08-21$1,200
-
2025-08-21historical $1,200
-
2025-08-20$1,200
-
2025-08-05$150,000 Active
-
2024-09-23historical $1,100
-
2024-08-23price $1,100
-
2024-08-03price $1,200
-
2024-07-01price $1,275
-
2024-06-18price $1,350
-
2024-05-23price $1,400
-
2024-05-08price $1,450
-
2024-04-23$1,500
-
2024-04-23historical $1,500
-
2024-04-23soldstatus $137,000
-
2024-04-22soldstatus Closed
-
2024-04-12$1,500
-
2024-03-22status Pending
-
2024-03-11price $137,900
-
2024-01-12$139,900 Active
-
2024-01-11historical
-
2024-01-01price $139,900
-
2023-11-20price $142,500
-
2023-10-16$144,900 Active
-
2022-10-31soldstatus Closed
-
2022-10-31soldstatus $129,000
-
2022-09-26status Pending
-
2022-09-22status Active
-
2022-08-27status Pending
ⓘ Source: listings_history table (triggers on properties + properties_extension) + one-shot
backfill from property_details.listing_events for pre-trigger history.
Tax reassessment forecast LA · Resets to sale price
- Current annual tax
- $1,248 · $104/mo
- Projected year-2 tax
- $1,248 · $104/mo
- Expected delta
- $0/yr ($0/mo · 0.0%)
ⓘ Screening estimate from a state-policy table — verify with the county assessor before closing.
Nearby sold comps map
Loading sold comps map…
Walkable amenities ~0.75 mi
Loading nearby amenities…
Taxation est. · year 1
- Rental income
- $19,056
- − Mortgage interest
- −$7,842
- − Property taxes
- −$1,248
- − Insurance
- −$700
- − Repairs & maintenance
- −$1,524
- − Management
- −$1,524
- − Depreciation
- −$4,073
- Taxable income
- $2,144
- Est. tax owed @ 24.0%
- −$515
- After-tax cash flow
- $3,781/yr
For passive investors: Depreciation is non-cash, so a rental often shows a tax loss while cash-flowing — sheltering income. Rental losses are passive: they offset passive income freely, and up to $25,000/yr can offset ordinary (W-2) income if you actively participate and your MAGI is under $100k (phasing out to $0 by $150k); unused losses carry forward. On sale, claimed depreciation is recaptured at up to 25%, and gains may owe capital-gains tax (a 1031 exchange can defer both). Figures are a year-1 estimate at your 24.0% rate — not tax advice; consult a CPA.
Schools (NCES district)
- District
- Bossier Parish
- NCES district ID
- 2200270
- Math proficiency
- 40% ▼ -32.00%
- Reading proficiency
- 47% ▼ -28.00%
- Median HH income
- $51,326
- Composite
- 37.5/100
- National rank
- #4402
- State rank
- #17 of 98 in LA
Livability — Benton
- Score
- 72/100
- State rank
- #41
- US rank
- #6159
Category grades
Schools grade is shown separately in the Schools card above.
Census & demographics
- Census place
- Benton, LA
- Population (ZIP)
- 15,341
Population outlook (Bossier County) Hauer SSP2
- Today (2025)
- 143,247 people
- By 2030
- 151,802 · +6.0%
- By 2040
- 168,194 · +17.4%
- By 2050
- 183,533 · +28.1%
- By 2075
- 217,009 · +51.5%
- By 2100
- 230,091 · +60.6%
Race, ethnicity, and origin ACS 2023
- Neighborhood character
- Predominantly White (77%)
- Race & ethnicity
- White 77% Two or more races 11% Black 9% Hispanic / Latino 3%
- Common ancestry
- Italian 7% Lithuanian 4% Iranian 2%
- Foreign-born
- 1% · Vietnam, Canada
- Languages at home
- 98% English-only · Spanish 1% Vietnamese 1%
Political lean MEDSL · Bossier
- 2024 margin
- Solid R (+43.3) · D 27.7% · R 71.0% · Other 1.3%
- 2008→2024 swing
- +0.3pp no change · 2008: -43.7pp · 2024: -43.3pp
- All cycles
- 2024: R+43.3 2020: R+41.0 2016: R+45.8 2012: R+45.4 2008: R+43.7
Not yet ingested
- Civics
- —
Market trends
- HPI YoY
- ▼ -72.62%
- Current HPI
- 166.3435
- Rent YoY
- —
- Metro
- —
- State GDP YoY
- ▲ 3.29%
- F500 in state
- 10
Industry mix (Fortune 500 HQ in LA)
| Industry | F500 HQs | Revenue |
|---|---|---|
| Telecommunications | 2 | $23B |
|
||
| Utilities | 1 | $12B |
|
||
| Wholesale / Distribution | 1 | $5B |
|
||
| Advertising | 1 | $2B |
|
||
Price history
+551.2% since first listed43 events — show timeline
- 2026-02-07 Listed $140,000 NTREIS
- 2026-02-06 Listing Removed — NTREIS
- 2026-01-19 Relisted — NTREIS
- 2026-01-13 Pending — NTREIS
- 2025-11-18 Price Changed $135,000 NTREIS
- 2025-09-05 Price Changed $145,000 NTREIS
- 2025-08-27 Rental Removed $1,200 NTREIS
- 2025-08-21 Listed for Rent $1,200 NTREIS
- 2025-08-21 Rental Removed $1,200 APPFOLIO
- 2025-08-20 Listed for Rent $1,200 APPFOLIO
- 2025-08-05 Listed $150,000 NTREIS
- 2024-09-23 Rental Removed $1,100 NTREIS
- 2024-08-23 Price Changed $1,100 NTREIS
- 2024-08-03 Price Changed $1,200 NTREIS
- 2024-07-01 Price Changed $1,275 NTREIS
- 2024-06-18 Price Changed $1,350 NTREIS
- 2024-05-23 Price Changed $1,400 NTREIS
- 2024-05-08 Price Changed $1,450 NTREIS
- 2024-04-23 Listed for Rent $1,500 NTREIS
- 2024-04-23 Rental Removed $1,500 APPFOLIO
- 2024-04-23 Sold (Public Records) $137,000 Public Records
- 2024-04-22 Sold (MLS) — NTREIS
- 2024-04-12 Listed for Rent $1,500 APPFOLIO
- 2024-03-22 Pending — NTREIS
- 2024-03-11 Price Changed $137,900 NTREIS
- 2024-01-12 Listed $139,900 NTREIS
- 2024-01-11 Listing Removed — NTREIS
- 2024-01-01 Price Changed $139,900 NTREIS
- 2023-11-20 Price Changed $142,500 NTREIS
- 2023-10-16 Listed $144,900 NTREIS
- 2022-10-31 Sold (Public Records) $129,000 Public Records
- 2022-10-31 Sold (MLS) — NTREIS
- 2022-09-26 Pending — NTREIS
- 2022-09-22 Relisted — NTREIS
- 2022-08-27 Pending — NTREIS
- 2022-08-09 Price Changed $129,900 NTREIS
- 2022-07-28 Price Changed $134,500 NTREIS
- 2022-07-08 Price Changed $136,500 NTREIS
- 2022-07-01 Listed $139,000 NTREIS
- 2015-09-22 Sold (Public Records) $85,000 Public Records
- 2010-08-23 Sold (Public Records) $71,728 Public Records
- 2007-07-23 Sold (Public Records) $21,500 Public Records
- 1948-11-02 Sold (Public Records) — Public Records
Property tax history
+4.3%/yrLatest (2025): $1,248 · -1.0% YoY. Source: county tax records.
Cash-flow waterfall
monthlySold comps — $/sqft
last 12 mo · ≤1 miLoading sold comps…