14218 W County Rd 175 · Odessa, TX
Flood risk 1/10 · Minimal
- FEMA flood zone
- X
- Chance of flooding over 30 yrs
- 0.0%
- Est. flood insurance / yr
- $507 – $1,088
Fire risk 7/10 · Major
- Est. fire insurance / yr
- $1,222 – $2,270
Heat risk 6/10 · Moderate
- Hot days now (above 102°F)
- 7 days/yr
- Hot days in 30 yrs
- 22 days/yr
Wind risk 3/10 · Minor
- Chance of severe wind over 30 yrs
- 5.0%
Air-quality risk 1/10 · Minimal
- Unhealthy air days now
- 0 days/yr
- Unhealthy air days in 30 yrs
- 0 days/yr
Risk factors via First Street. Map © Google.
Why this score? — see what drove the C+ grade
The composite is a weighted blend of 9 inputs, each scored 0–100. Each bar is that input's sub-score; the figure is the points it added to the 100-point composite (weight × sub-score).
- Cash flow +23.8/30.0
- DSCR +7.7/10.0
- ARV discount +7.5/15.0
- Appreciation +7.5/10.0
- 1% rule +5.4/10.0
- Livability +3.8/5.0
- Schools +3.2/10.0
- Rent growth +2.5/5.0
- Condition / age +1.0/5.0
$220,000
🖨 Deal sheet 📄 Offer letter ✓ Due diligence
Listing remarks MLS
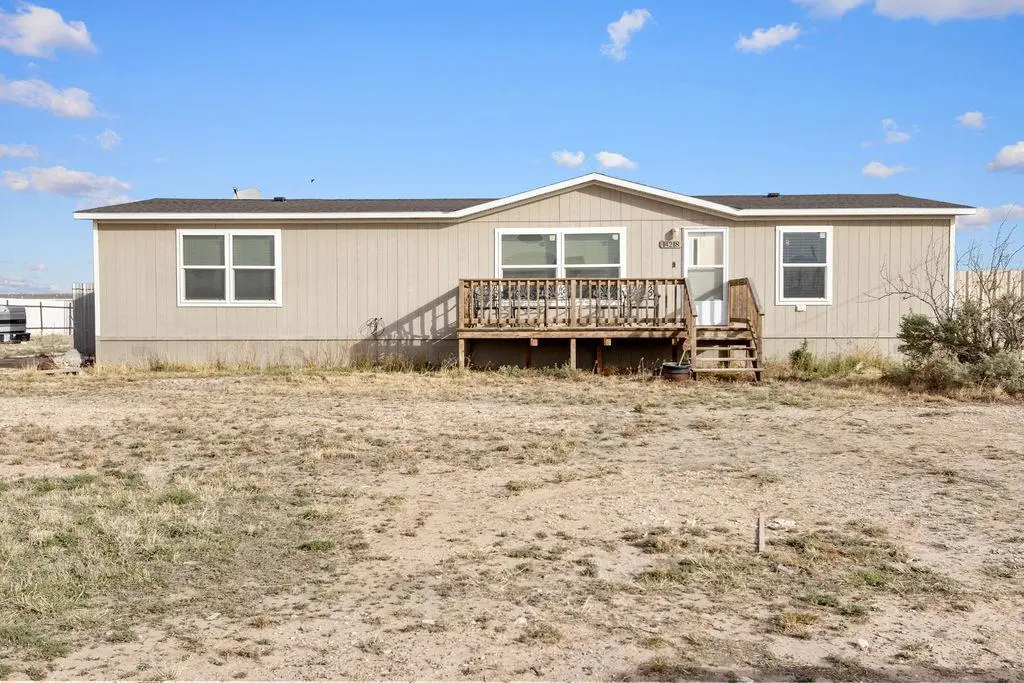
2018 Mobile home located on a corner lot offering 3 bedrooms and 2 bathrooms on a 1-acre. Features a spacious, flowing layout from living area to kitchen. Property includes shed and 2 horse stalls located at the back of the lot, perfect for horses!
Key facts
- 2 horse stalls
- Level 1-acre lot
- Corner lot
Tags
Neighborhood map
What this means for you Summary
Snapshot
- This is a 3-bed/2.0-bath manufactured listed at $220k. Condition is rated poor.
Deal economics
- At list price, monthly cash flow is $423 ($5k/yr) — positive.
- The deal already cash-flows at list — no discount required.
- Meets the 1% rule at list price ($2k rent vs $220k).
- Recommended offer: $200k (9.0% below list) — sets the bar for market timing.
Location & tenants
- Location reads 75/100 on livability (#132 in TX, #3,928 nationally) — a middle-class / working-renter tenant base. Strengths: cost of living A+, housing A+, health & safety A+; Watch: commute D+, amenities D, schools F.
- Midland ISD (urban): math 34% / reading 36% proficiency, ranked #477 of 826 in TX (top 58%) — families likely to look elsewhere, expect single-tenant / working-renter base with shorter leases.
- Market conditions: 78 active listings in the ZIP; 1,504 units permitted in Midland County in 2024 (0 in 5+ unit buildings).
Forward outlook
- In year one you build about $12k of equity ($2k loan paydown + $11k appreciation (4.9% local appreciation)).
- Midland County population projected at +83% by 2050 — long-run rental-demand tailwind backs the buy-and-hold thesis.
- At projected returns (4.9% appreciation + 3.0% rent growth), your $62k cash investment doubles in ~4 years — after that, you're playing with house money.
- By year 3, paydown + projected appreciation supports a ~$30k cash-out refi (75% LTV) — recoverable capital for the next deal without selling this one.
Negotiation context
- It's been on market 96 days — a 9% lower offer ($200k) is reasonable based on typical stale-listing flexibility.
Risks & watch-outs
- Climate carrying-cost: major wildfire risk; extreme-heat days projected 7→22/yr by 2055 (HVAC capex compounding) — expect insurance premiums to compound above CPI over the hold.
Questions for the listing agent
- It's been on market 96 days. Have you received any prior offers? Is the seller open to a 9% concession, seller financing, or rate buy-down credit?
- Have any recent inspections been done? Can we get a copy of the seller's disclosures and any deferred-maintenance estimates?
- What does the HOA fee cover, when was the last increase, and are there any pending special assessments or reserve-fund shortfalls?
- Why hasn't it sold? Are there any deal-killer items the seller is aware of (foundation, flood, title, zoning, code violations)?
- Is there a deadline driving the sale (1031 exchange, divorce, estate, relocation)? That informs how much negotiation room exists.
- Schools are F-rated, which usually means shorter tenancies and higher turnover. Who's the typical renter profile here, and what's been the actual vacancy rate?
- What's the average days-on-market for RENTAL listings here right now (not sales)? A rising rental-DOM trend means longer vacancies and softer asking-rent achievability than the comps imply.
- What's the recent tenant-quality profile in this submarket — average credit score on applications, eviction rate, late-payment / NSF rate, and stable-employment percentage? A property-management company in the area should have these aggregated.
- How much new for-sale + rental construction is in the pipeline within 1–3 miles? Heavy new supply typically softens prices + rents 12–24 months out; constrained supply supports both.
Investment metrics
- 1% rule
- 1.04% ✓
- Cap rate
- 8.60%
- Cash-on-cash
- 8.24%
- DSCR
- 1.37
- GRM
- 8.0
CMA / ARV
No comps found within radius.
Projected returns pro-forma
4.91% appreciation · 3.0% rent growth · sell at horizon
- IRR
- 19.7%
- Equity multiple
- 2.24×
- Total profit
- $76,467
- Equity at exit
- $123,454
- IRR
- 19.6%
- Equity multiple
- 4.38×
- Total profit
- $208,367
- Equity at exit
- $212,065
Cash invested: $61,600 (down + closing). Projections, not guarantees.
Landlord ↔ Tenant lean methodology
- Overall (STATE)
- 87 Strongly Landlord-Friendly
- State Texas
- 87 Strongly Landlord-Friendly · R+5
- County
- — inherits STATE
- City
- — inherits STATE
ZIP-level market 79766
- Home prices YoY
- 2.3%
- Active inventory
- 78
- Price-to-rent
- 8.0×
Monthly cashflow live
- Estimated rent
- $2,299 medium interval (Pro) →
- Mortgage (P&I)
- −$1,154
- Tax from tax record
- −$117 /mo · $1,409/yr
- Insurance
- −$92
- HOA
- −$30
- Vacancy / Maint / Mgmt
- −$483
- Net cashflow
- $423
Break-even live
UW: 25.0% down · 7.5% · 30yr · 1.5% tax · 5.0% vac · 8.0% maint · 8.0% mgmt
Financing live
Cash to close
- Down payment
- $55,000
- Closing costs
- $6,600
- Reserves months
- —
- Total cash needed
- —
Loan-product check · same deal, 3 products live
Conventional
25% down · 7.5% · 30yr
- Down + closing
- —
- Monthly P&I
- —
- Monthly cashflow
- —
- DSCR
- —
- Eligible?
- —
Personal DTI + credit; lowest rate.
DSCR
20% down · 8.5% · 30yr
- Down + closing
- —
- Monthly P&I
- —
- Monthly cashflow
- —
- DSCR
- —
- Eligible?
- —
No personal income docs; deal must DSCR.
Hard money
10% down · 12.0% · 12mo
- Down + closing
- —
- Monthly P&I
- —
- Monthly cashflow
- —
- DSCR
- —
- Eligible?
- —
Short-term bridge; refi at stabilization.
HOA detail
- Monthly dues
- $30 · $360/yr
Listing history 20 events
-
2026-06-19days on market $220,000 Active 96 DOM
-
2026-06-18days on market $220,000 Active 95 DOM
-
2026-06-17days on market $220,000 Active 94 DOM
-
2026-06-16days on market $220,000 Active 93 DOM
-
2026-06-15days on market $220,000 Active 92 DOM
-
2026-06-14days on market $220,000 Active 90 DOM
-
2026-06-13days on market $220,000 Active 89 DOM
-
2026-06-10days on market $220,000 Active 87 DOM
-
2026-06-09days on market $220,000 Active 86 DOM
-
2026-06-08days on market $220,000 Active 85 DOM
-
2026-06-07days on market $220,000 Active 84 DOM
-
2026-06-03days on market $220,000 Active 80 DOM
-
2026-06-03price $220,000 Active 79 DOM
-
2026-06-02days on market $235,000 Active 79 DOM
-
2026-06-01days on market $235,000 Active 78 DOM
-
2026-05-31days on market $235,000 Active 77 DOM
-
2026-05-30days on market $235,000 Active 76 DOM
-
2026-05-06price $235,000 249-char remark
Show marketing remark (249 chars)
2018 Mobile home located on a corner lot offering 3 bedrooms and 2 bathrooms on a 1-acre. Features a spacious, flowing layout from living area to kitchen. Property includes shed and 2 horse stalls located at the back of the lot, perfect for horses!
-
2026-04-13price $243,000 249-char remark
Show marketing remark (249 chars)
2018 Mobile home located on a corner lot offering 3 bedrooms and 2 bathrooms on a 1-acre. Features a spacious, flowing layout from living area to kitchen. Property includes shed and 2 horse stalls located at the back of the lot, perfect for horses!
-
2026-03-15$248,000 Active 249-char remark
Show marketing remark (249 chars)
2018 Mobile home located on a corner lot offering 3 bedrooms and 2 bathrooms on a 1-acre. Features a spacious, flowing layout from living area to kitchen. Property includes shed and 2 horse stalls located at the back of the lot, perfect for horses!
ⓘ Source: listings_history table (triggers on properties + properties_extension) + one-shot
backfill from property_details.listing_events for pre-trigger history.
Tax reassessment forecast TX · Resets to sale price
- Current annual tax
- $1,409 · $117/mo
- Projected year-2 tax
- $4,026 · $336/mo
- Expected delta
- +$2,617/yr (+$218/mo · 185.7%)
ⓘ Screening estimate from a state-policy table — verify with the county assessor before closing.
Climate risk First Street
- Flood 1/10 Low FEMA zone X · 0% chance over 30 yrs
- Wildfire 7/10 Severe
- Heat 6/10 Major 7 d/yr ≥102°F today · 22 d/yr by 30 yrs out
- Wind 3/10 Moderate 5% chance of damaging wind over 30 yrs
- Air quality 1/10 Low 0 unhealthy d/yr today · 0 by 30 yrs out
Nearby sold comps map
Loading sold comps map…
Walkable amenities ~0.75 mi
Loading nearby amenities…
Taxation est. · year 1
- Rental income
- $27,583
- − Mortgage interest
- −$12,323
- − Property taxes
- −$1,409
- − Insurance
- −$1,100
- − Repairs & maintenance
- −$2,207
- − Management
- −$2,207
- − HOA
- −$360
- − Depreciation
- −$6,400
- Taxable income
- $1,577
- Est. tax owed @ 24.0%
- −$379
- After-tax cash flow
- $4,699/yr
For passive investors: Depreciation is non-cash, so a rental often shows a tax loss while cash-flowing — sheltering income. Rental losses are passive: they offset passive income freely, and up to $25,000/yr can offset ordinary (W-2) income if you actively participate and your MAGI is under $100k (phasing out to $0 by $150k); unused losses carry forward. On sale, claimed depreciation is recaptured at up to 25%, and gains may owe capital-gains tax (a 1031 exchange can defer both). Figures are a year-1 estimate at your 24.0% rate — not tax advice; consult a CPA.
Condition & rehab AI · 1 photo
This mobile home requires extensive repairs and landscaping to improve its condition and value.
Repairs flagged
- Major Exposed wooden framing and debris under the deck — Structural damage
- Major Landscaping and curb appeal — Improves aesthetics
Value-add opportunities
- Both Landscaping and curb appeal — Improves aesthetics and curb appeal
- Both Structural repairs — Ensures structural integrity and safety
Renovation cost estimate screening
| Repair item | Severity | Est. cost |
|---|---|---|
| Exposed wooden framing and debris under the deck · Structural damage | Major | $15,000–50,000 |
| Landscaping and curb appeal · Improves aesthetics | Major | $15,000–50,000 |
| Total estimated repair cost · 2 items | $30,000–100,000 |
Value-add ROI direction
- Both Landscaping and curb appeal — Improves aesthetics and curb appeal ↑
- Both Structural repairs — Ensures structural integrity and safety ↑
ⓘ Cost ranges are severity-bucket heuristics (US national rule-of-thumb). Get contractor quotes + a written scope before underwriting a rehab budget.
Schools (NCES district)
- District
- Midland ISD
- NCES district ID
- 4830570
- Math proficiency
- 34% ▼ -7.00%
- Reading proficiency
- 36% ▬ 0.00%
- Median HH income
- $63,457
- Composite
- 31.63/100
- National rank
- #5938
- State rank
- #477 of 826 in TX
Livability — Odessa
- Score
- 75/100
- State rank
- #132
- US rank
- #3928
Category grades
Schools grade is shown separately in the Schools card above.
Census & demographics
- City population
- 131,169
- Population (ZIP)
- 10,712
Population outlook (Midland County) Hauer SSP2
- Today (2025)
- 220,895 people
- By 2030
- 253,667 · +14.8%
- By 2040
- 325,498 · +47.4%
- By 2050
- 404,168 · +83.0%
- By 2075
- 609,802 · +176.1%
- By 2100
- 760,172 · +244.1%
Race, ethnicity, and origin ACS 2023
- Neighborhood character
- Predominantly Hispanic (68%)
- Race & ethnicity
- Hispanic / Latino 68% White 25% Two or more races 24% Black 3% Native American 2%
- Hispanic origin (detail)
- Mexican 63% Cuban 2%
- Common ancestry
- Slovak 5% Serbian 4% Lithuanian 1%
- Foreign-born
- 22% · Canada, Jamaica
- Languages at home
- 36% English-only · Spanish 63%
Political lean MEDSL · Midland
- 2024 margin
- Solid R (+60.5) · D 19.3% · R 79.8%
- 2008→2024 swing
- -3.3pp toward R · 2008: -57.3pp · 2024: -60.5pp
- All cycles
- 2024: R+60.5 2020: R+56.6 2016: R+55.2 2012: R+61.5 2008: R+57.3
Not yet ingested
- Civics
- —
Market trends
- HPI YoY
- ▲ 4.91%
- Current HPI
- 222.3497
- Rent YoY
- —
- Metro
- —
- State GDP YoY
- ▲ 3.95%
- F500 in state
- 110
Industry mix (Fortune 500 HQ in TX)
| Industry | F500 HQs | Revenue |
|---|---|---|
| Energy | 16 | $1,198B |
|
||
| Technology | 5 | $198B |
|
||
| Engineering / Construction | 4 | $72B |
|
||
| Energy Services | 3 | $60B |
|
||
| Utilities | 3 | $41B |
|
||
| Healthcare | 2 | $330B |
|
||
Price history
-5.2% since first listed3 events — show timeline
- 2026-05-06 Price Changed $235,000 ODMLS
- 2026-04-13 Price Changed $243,000 ODMLS
- 2026-03-15 Listed $248,000 ODMLS
Property tax history
-1.3%/yrLatest (2025): $1,409 · -6.0% YoY. Source: county tax records.
Cash-flow waterfall
monthlySold comps — $/sqft
last 12 mo · ≤1 miLoading sold comps…