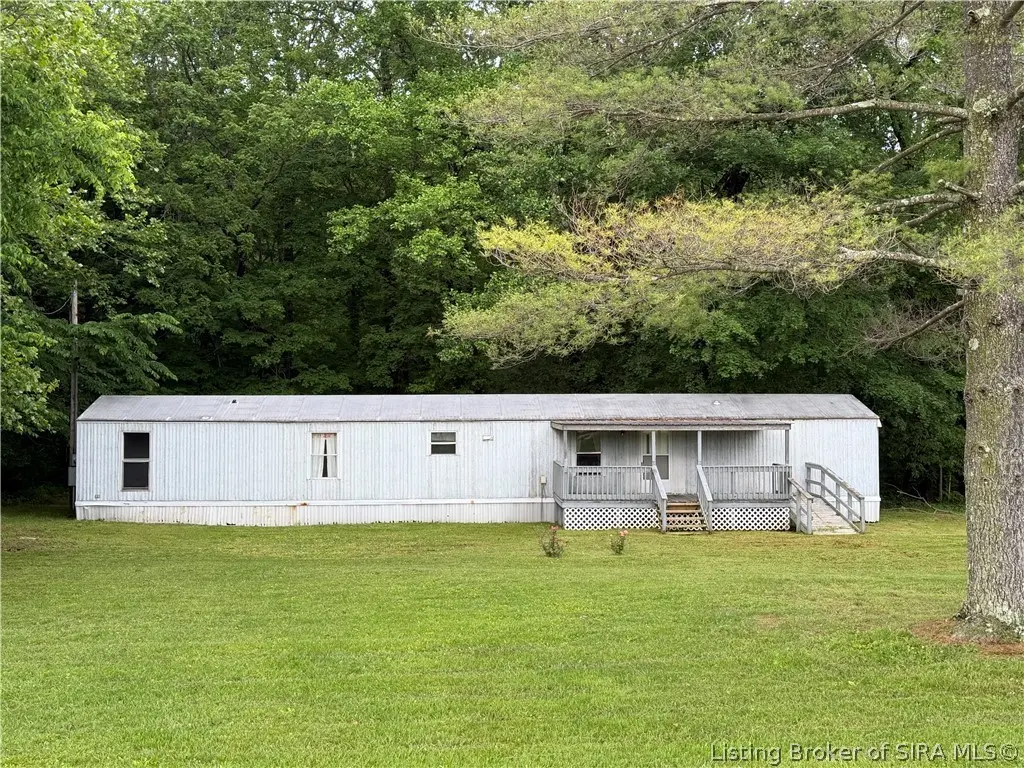
7856 S County Road 575 E · Marengo, IN
Flood risk 1/10 · Minimal
- FEMA flood zone
- X (unshaded)
- Chance of flooding over 30 yrs
- 0.0%
- Est. flood insurance / yr
- $507 – $1,088
Fire risk 3/10 · Minor
- Est. fire insurance / yr
- $717 – $1,331
Heat risk 4/10 · Minor
- Hot days now (above 105°F)
- 7 days/yr
- Hot days in 30 yrs
- 19 days/yr
Wind risk 2/10 · Minimal
- Chance of severe wind over 30 yrs
- 2.0%
Air-quality risk 2/10 · Minimal
- Unhealthy air days now
- 1 days/yr
- Unhealthy air days in 30 yrs
- 1 days/yr
Risk factors via First Street. Map © Google.
Why this score? — see what drove the D grade
The composite is a weighted blend of 9 inputs, each scored 0–100. Each bar is that input's sub-score; the figure is the points it added to the 100-point composite (weight × sub-score).
- Cash flow +10.0/30.0
- Appreciation +7.8/10.0
- ARV discount +7.5/15.0
- Livability +3.2/5.0
- 1% rule +3.0/10.0
- Schools +2.9/10.0
- DSCR +2.8/10.0
- Rent growth +2.5/5.0
- Condition / age +2.5/5.0
$110,000
🖨 Deal sheet (PDF) 📄 Offer letter ✓ Due diligence
Listing remarks MLS
Excellent opportunity on this mobile home situation on approx . 38 acres. Online Auction Dates: 3/22/2026-3/26/2026. Please contact your agent for details. * * NO MH CURATIVE TO BE DONE, NO DMV TITLE PROVIDED. PROPERTY IS BEING MARKETED "AS IS" * *
Key facts
- 0.38 acre lot
- Built 2002
- Listed 29 days
Property features AI
Finance
- Financial info: Annual tax amount noted
Exterior
- Utilities: Public water connection; Septic tank
- Home design: Single-wide mobile home; Entry level on main floor
- Construction: Metal siding; Metal roof; Crawlspace foundation; Built area listed as 1,216 above-grade
- Exterior features: Paved road access; Residential zoning
Interior
- Kitchen: Eat-in kitchen
- Bedrooms: Main level primary
- Bathrooms: 2 full bathrooms
- Heating & cooling: Forced air heating; Central air conditioning
- Interior features: Eat-in kitchen; Main level primary bedroom; Utility room
- Laundry & utility: Laundry closet on main level; Utility room
Neighborhood map
What this means for you Summary
Snapshot
- This is a 3-bed/2.0-bath manufactured listed at $110k.
Deal economics
- At list price, monthly cash flow is $-67 ($-800/yr) — negative.
- To cash-flow at today's rent, offer at most $100k (8.8% below list).
- To meet the 1% rule (rent ≥ 1% of price), the offer needs to be $88k (20.2% below list).
- Recommended offer: $88k (20.2% below list) — sets the bar for 1% rule.
Location & tenants
- Location reads 64/100 on livability (#407 in IN) — a middle-class / working-renter tenant base. Strengths: cost of living A+, housing B; Watch: health & safety C-, crime D, amenities F.
- Paoli Community School Corporation (town): math 28% / reading 42% proficiency, ranked #200 of 301 in IN (top 66%) — families likely to look elsewhere, expect single-tenant / working-renter base with shorter leases.
- Zoned schools: Throop Elementary School (math 36% / reading 36%, grade F, #577 of 994 statewide, top 59%, 712 students, 61% FRL); Paoli Jr & Sr High School (math 19% / reading 50%, grade F, #270 of 369 statewide, top 77%, 561 students, 55% FRL).
- Market conditions: 5 active listings in the ZIP; 54 units permitted in Orange County in 2024 (40 in 5+ unit buildings).
Forward outlook
- In year one you build about $7k of equity ($761 loan paydown + $6k appreciation (5.5% local appreciation)).
- Orange County population projected at -14% by 2050 — secular population decline; favor cash flow + early exit over multi-decade hold.
- At projected returns (5.5% appreciation + 3.0% rent growth), your $31k cash investment doubles in ~5 years — after that, you're playing with house money.
- By year 6, paydown + projected appreciation supports a ~$37k cash-out refi (75% LTV) — recoverable capital for the next deal without selling this one.
Negotiation context
- It's been on market 30 days — a 2% lower offer ($108k) is reasonable based on typical stale-listing flexibility.
- 2 sale attempts; this cycle's ask has dropped $10k (8%) from the opening price — seller is motivated, your offer sets the floor, not the list.
- Current owner paid $50k; list at $110k implies a 118% gain — meaningful room to come down on a strong offer.
Questions for the listing agent
- What do current leases actually rent for vs. the listed asking? Can we see a recent rent roll and the last 12 months of T-12 income?
- Is there a deadline driving the sale (1031 exchange, divorce, estate, relocation)? That informs how much negotiation room exists.
- Schools are D-rated, which usually means shorter tenancies and higher turnover. Who's the typical renter profile here, and what's been the actual vacancy rate?
- Crime grade is D in this area — have there been break-ins, vandalism, or insurance claims at this property in the last 3 years? What carrier currently insures it and at what premium?
- The area grade is low — what's the realistic commute time and amenity access for the typical tenant pool here? Any planned neighborhood developments (good or bad) we should know about?
- What's the average days-on-market for RENTAL listings here right now (not sales)? A rising rental-DOM trend means longer vacancies and softer asking-rent achievability than the comps imply.
- What's the recent tenant-quality profile in this submarket — average credit score on applications, eviction rate, late-payment / NSF rate, and stable-employment percentage? A property-management company in the area should have these aggregated.
- How much new for-sale + rental construction is in the pipeline within 1–3 miles? Heavy new supply typically softens prices + rents 12–24 months out; constrained supply supports both.
Investment metrics
- 1% rule
- 0.80% ✗
- Cap rate
- 5.57%
- Cash-on-cash
- -2.60%
- DSCR
- 0.88
- GRM
- 10.4
CMA / ARV
No comps found within radius.
Projected returns pro-forma
5.5% appreciation · 3.0% rent growth · sell at horizon
- IRR
- 12.0%
- Equity multiple
- 1.79×
- Total profit
- $24,290
- Equity at exit
- $65,708
- IRR
- 12.9%
- Equity multiple
- 3.46×
- Total profit
- $75,754
- Equity at exit
- $116,294
Cash invested: $30,800 (down + closing). Projections, not guarantees.
Landlord ↔ Tenant lean methodology
- Overall (STATE)
- 90 Strongly Landlord-Friendly
- State Indiana
- 90 Strongly Landlord-Friendly · R+11
- County
- — inherits STATE
- City
- — inherits STATE
ZIP-level market 47140
- Home prices YoY
- 2.5%
- Active inventory
- 5
- Price-to-rent
- 10.4×
Monthly cashflow live
- Estimated rent
- $878 medium interval (Pro) →
- Mortgage (P&I)
- −$577
- Tax est. 1.5%
- −$138 /mo · $1,650/yr
- Insurance
- −$46
- HOA
- −$0
- Lot rent leased land?
- −$0
- Vacancy / Maint / Mgmt
- −$184
- Net cashflow
- $-67
Break-even live
Sensitivity live
| Price | -10% $9 | -5% $-29 | +0% $-67 | +5% $-105 | +10% $-143 |
|---|---|---|---|---|---|
| Rent | -10% $-136 | -5% $-101 | +0% $-67 | +5% $-32 | +10% $3 |
| Rate | -1.0pp $-11 | -0.5pp $-39 | base $-67 | +0.5pp $-95 | +1.0pp $-124 |
UW: 25.0% down · 7.5% · 30yr · 1.5% tax · 5.0% vac · 8.0% maint · 8.0% mgmt
Financing live
Cash to close
- Down payment
- $27,500
- Closing costs
- $3,300
- Reserves months
- —
- Total cash needed
- —
Loan-product check · same deal, 3 products live
Conventional
25% down · 7.5% · 30yr
- Down + closing
- —
- Monthly P&I
- —
- Monthly cashflow
- —
- DSCR
- —
- Eligible?
- —
Personal DTI + credit; lowest rate.
DSCR
20% down · 8.5% · 30yr
- Down + closing
- —
- Monthly P&I
- —
- Monthly cashflow
- —
- DSCR
- —
- Eligible?
- —
No personal income docs; deal must DSCR.
Hard money
10% down · 12.0% · 12mo
- Down + closing
- —
- Monthly P&I
- —
- Monthly cashflow
- —
- DSCR
- —
- Eligible?
- —
Short-term bridge; refi at stabilization.
Listing history 22 events
-
2026-06-22days on market $110,000 Active 30 DOM
-
2026-06-21days on market $110,000 Active 29 DOM
-
2026-06-21days on market $110,000 Active 28 DOM
-
2026-06-18days on market $110,000 Active 26 DOM
-
2026-06-17days on market $110,000 Active 25 DOM
-
2026-06-16days on market $110,000 Active 24 DOM
-
2026-06-15days on market $110,000 Active 23 DOM
-
2026-06-13days on market $110,000 Active 21 DOM
-
2026-06-12pricedays on market $110,000 Active 20 DOM
-
2026-06-09days on market $118,000 Active 17 DOM
-
2026-06-08days on market $118,000 Active 16 DOM
-
2026-06-07days on market $118,000 Active 15 DOM
-
2026-06-07pricedays on market $118,000 Active 14 DOM
-
2026-06-04days on market $120,000 Active 11 DOM
-
2026-06-02days on market $120,000 Active 10 DOM
-
2026-06-01days on market $120,000 Active 9 DOM
-
2026-05-31days on market $120,000 Active 8 DOM
-
2026-05-31days on market $120,000 Active 7 DOM
-
2026-05-23$120,000 Active
-
2026-04-16soldstatus $50,500 Closed 261-char remark
Show marketing remark (261 chars)
Excellent opportunity on this mobile home situation on approx . 38 acres. Online Auction Dates: 3/22/2026-3/26/2026. Please contact your agent for details. * * NO MH CURATIVE TO BE DONE, NO DMV TITLE PROVIDED. PROPERTY IS BEING MARKETED "AS IS" * *
-
2026-03-25historical 261-char remark
Show marketing remark (261 chars)
Excellent opportunity on this mobile home situation on approx . 38 acres. Online Auction Dates: 3/22/2026-3/26/2026. Please contact your agent for details. * * NO MH CURATIVE TO BE DONE, NO DMV TITLE PROVIDED. PROPERTY IS BEING MARKETED "AS IS" * *
-
2026-03-12$34,900 Active 261-char remark
Show marketing remark (261 chars)
Excellent opportunity on this mobile home situation on approx . 38 acres. Online Auction Dates: 3/22/2026-3/26/2026. Please contact your agent for details. * * NO MH CURATIVE TO BE DONE, NO DMV TITLE PROVIDED. PROPERTY IS BEING MARKETED "AS IS" * *
ⓘ Source: listings_history table (triggers on properties + properties_extension) + one-shot
backfill from property_details.listing_events for pre-trigger history.
Climate risk First Street
- Flood 1/10 Low FEMA zone X (unshaded) · 0% chance over 30 yrs
- Wildfire 3/10 Moderate
- Heat 4/10 Moderate 7 d/yr ≥105°F today · 19 d/yr by 30 yrs out
- Wind 2/10 Low 2% chance of damaging wind over 30 yrs
- Air quality 2/10 Low 1 unhealthy d/yr today · 1 by 30 yrs out
Nearby sold comps map
Loading sold comps map…
Walkable amenities ~0.75 mi
Loading nearby amenities…
Taxation est. · year 1
- Rental income
- $10,534
- − Mortgage interest
- −$6,162
- − Property taxes
- −$1,650
- − Insurance
- −$550
- − Repairs & maintenance
- −$843
- − Management
- −$843
- − Depreciation
- −$3,200
- Taxable loss
- −$2,713
- Est. tax savings @ 24.0%
- +$651
- After-tax cash flow
- $-149/yr
For passive investors: Depreciation is non-cash, so a rental often shows a tax loss while cash-flowing — sheltering income. Rental losses are passive: they offset passive income freely, and up to $25,000/yr can offset ordinary (W-2) income if you actively participate and your MAGI is under $100k (phasing out to $0 by $150k); unused losses carry forward. On sale, claimed depreciation is recaptured at up to 25%, and gains may owe capital-gains tax (a 1031 exchange can defer both). Figures are a year-1 estimate at your 24.0% rate — not tax advice; consult a CPA.
Schools (NCES district)
- District
- Paoli Community School Corporation
- NCES district ID
- 1808640
- Math proficiency
- 28% ▼ -14.00%
- Reading proficiency
- 42% ▼ -5.00%
- Median HH income
- $38,333
- Composite
- 29.18/100
- National rank
- #6571
- State rank
- #200 of 301 in IN
Livability — Marengo
- Score
- 64/100
- State rank
- #407
- US rank
- #14811
Category grades
Schools grade is shown separately in the Schools card above.
Census & demographics
- Population (ZIP)
- 2,458
Population outlook (Orange County) Hauer SSP2
- Today (2025)
- 18,948 people
- By 2030
- 18,479 · -2.5%
- By 2040
- 17,387 · -8.2%
- By 2050
- 16,301 · -14.0%
- By 2075
- 14,361 · -24.2%
- By 2100
- 12,594 · -33.5%
Race, ethnicity, and origin ACS 2023
- Neighborhood character
- Predominantly White (94%)
- Race & ethnicity
- White 94% Two or more races 4%
- Common ancestry
- Lithuanian 2% Slovak 1% Scottish 1%
- Foreign-born
- 2% · South Korea
Political lean MEDSL · Orange
- 2024 margin
- Solid R (+52.1) · D 23.1% · R 75.3% · Other 1.6%
- 2008→2024 swing
- -38.0pp toward R · 2008: -14.2pp · 2024: -52.1pp
- All cycles
- 2024: R+52.1 2020: R+47.6 2016: R+45.8 2012: R+21.6 2008: R+14.2
Not yet ingested
- Civics
- —
Market trends
- HPI YoY
- ▲ 5.50%
- Current HPI
- 222.9757
- Rent YoY
- —
- Metro
- —
- State GDP YoY
- ▲ 2.90%
- F500 in state
- 18
Industry mix (Fortune 500 HQ in IN)
| Industry | F500 HQs | Revenue |
|---|---|---|
| Industrial Machinery | 2 | $37B |
|
||
| Healthcare | 1 | $177B |
|
||
| Pharmaceuticals | 1 | $45B |
|
||
| Metals / Steel | 1 | $18B |
|
||
| Agriculture | 1 | $17B |
|
||
| Packaging | 1 | $12B |
|
||
Price history
+243.8% since first listed4 events — show timeline
- 2026-05-23 Listed $120,000 SIRA
- 2026-04-16 Sold (MLS) $50,500 SIRA
- 2026-03-25 Delisted — SIRA
- 2026-03-12 Listed $34,900 SIRA
Property tax history
+159.5%/yrLatest (2024): $34 · -26.0% YoY. Source: county tax records.
Cash-flow waterfall
monthlySold comps — $/sqft
last 12 mo · ≤1 miLoading sold comps…