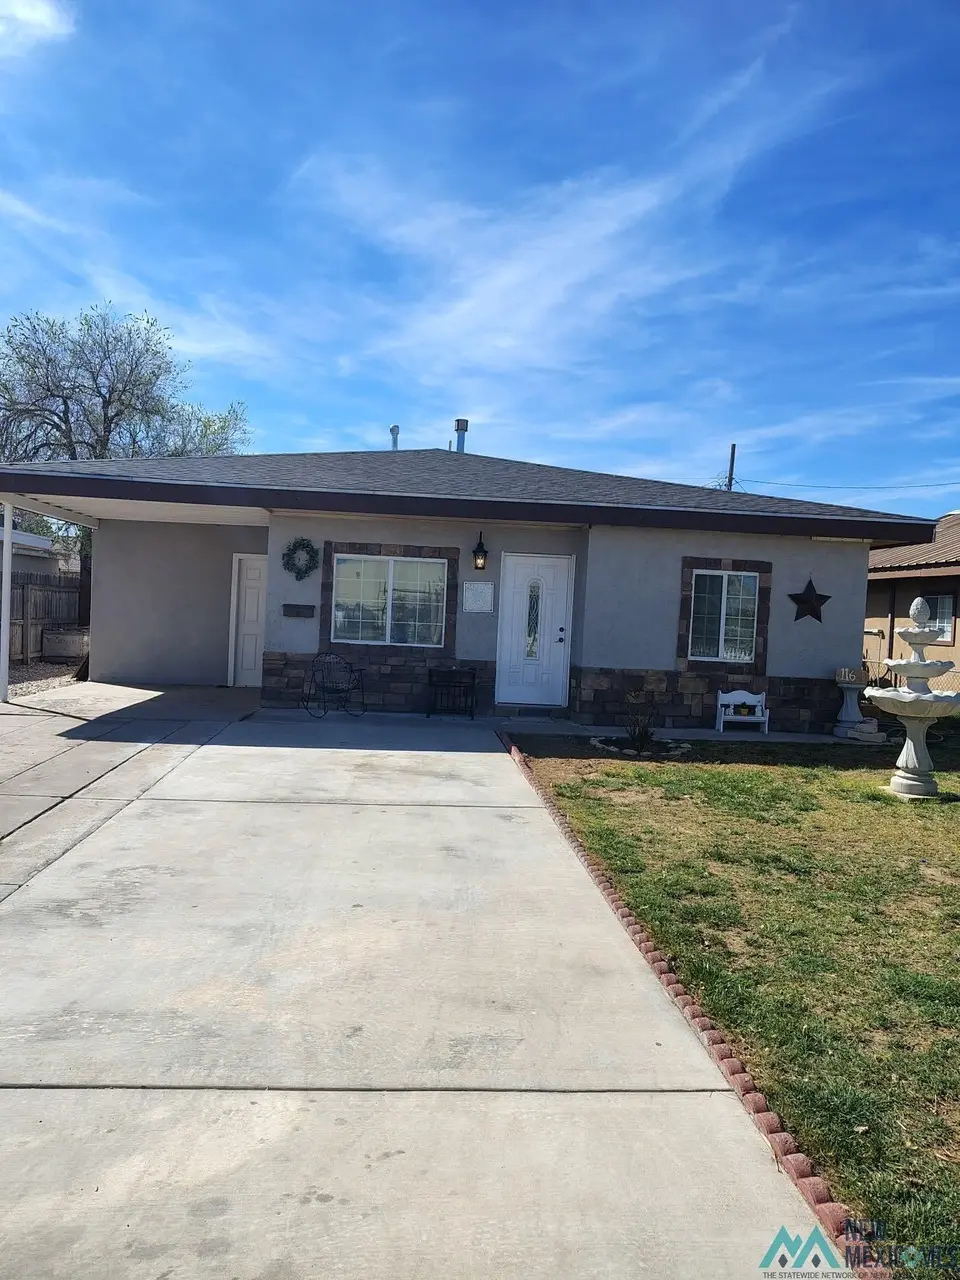
116 W Wildy St · Roswell, NM
Flood risk 1/10 · Minimal
- FEMA flood zone
- X (unshaded)
- Chance of flooding over 30 yrs
- 0.0%
- Est. flood insurance / yr
- $507 – $1,088
Fire risk 6/10 · Moderate
- Est. fire insurance / yr
- $706 – $1,312
Heat risk 5/10 · Moderate
- Hot days now (above 99°F)
- 7 days/yr
- Hot days in 30 yrs
- 20 days/yr
Wind risk 2/10 · Minimal
- Chance of severe wind over 30 yrs
- —
Air-quality risk 1/10 · Minimal
- Unhealthy air days now
- 0 days/yr
- Unhealthy air days in 30 yrs
- 0 days/yr
Risk factors via First Street. Map © Google.
Why this score? — see what drove the D grade
The composite is a weighted blend of 9 inputs, each scored 0–100. Each bar is that input's sub-score; the figure is the points it added to the 100-point composite (weight × sub-score).
- Cash flow +16.1/30.0
- ARV discount +7.5/15.0
- DSCR +5.0/10.0
- Livability +3.8/5.0
- 1% rule +3.1/10.0
- Schools +2.6/10.0
- Rent growth +2.5/5.0
- Condition / age +2.5/5.0
- Appreciation +0.0/10.0
$175,000
🖨 Deal sheet (PDF) 📄 Offer letter ✓ Due diligence
Listing remarks MLS
Move in ready, 3 bedroms, 2 baths with dinning room, den and living room. New Roof and new HVAC.
Key facts
- New hvac
- New roof
- 5,100 sq ft lot
Tags
Neighborhood map
What this means for you Summary
Snapshot
- This is a 3-bed/1.0-bath single-family listed at $175k.
Deal economics
- At list price, monthly cash flow is $89 ($1k/yr) — positive.
- The deal already cash-flows at list — no discount required.
- To meet the 1% rule (rent ≥ 1% of price), the offer needs to be $141k (19.3% below list).
- Recommended offer: $141k (19.3% below list) — sets the bar for 1% rule.
Location & tenants
- Location reads 75/100 on livability (#8 in NM, #4,339 nationally) — a middle-class / working-renter tenant base. Strengths: commute A+, cost of living A+, housing A+; Watch: employment D, crime F, amenities F.
- Roswell Independent Schools (town): math 11% / reading 52% proficiency, ranked #16 of 29 in NM (top 55%) — families likely to look elsewhere, expect single-tenant / working-renter base with shorter leases; 75% free/reduced lunch — lower-income household profile, screen leases tightly.
- Zoned schools: Valley View Elementary (math 16% / reading 68%, grade F, #31 of 68 statewide, top 46%, 463 students, 100% FRL); Sierra Middle (math 8% / reading 44%, grade F, #16 of 27 statewide, top 58%, 627 students, 100% FRL); Roswell High (math 11% / reading 30%, grade F, #97 of 110 statewide, top 88%, 1,438 students, 0% FRL).
- Market conditions: 181 active listings in the ZIP; 6 comparable units currently listed for rent nearby; rentals lingering (median 46d on market — plan ~5-8 weeks vacancy on turnover, expect pricing pressure); 100% of comp listings sitting > 30 days — soft ceiling on asking rent; lower-income renter base — watch delinquency; 88 units permitted in Chaves County in 2024 (0 in 5+ unit buildings).
- This rent runs 40% of the median local income ($42k/yr) — at the standard rent-burdened threshold; future hikes will face affordability resistance.
Forward outlook
- Local home prices are declining (-3.0%/yr); year-one equity from $1k of loan paydown is wiped out by about $5k of value loss. Plan a longer hold.
Negotiation context
- It's been on market 96 days — a 9% lower offer ($159k) is reasonable based on typical stale-listing flexibility.
Risks & watch-outs
- Watch-outs: built in 1950 — expect roof / HVAC / electrical / plumbing capex.
- Climate carrying-cost: major wildfire risk; extreme-heat days projected 7→20/yr by 2055 (HVAC capex compounding) — expect insurance premiums to compound above CPI over the hold.
Questions for the listing agent
- It's been on market 96 days. Have you received any prior offers? Is the seller open to a 19% concession, seller financing, or rate buy-down credit?
- Built in 1950 — when were the roof, HVAC, electrical panel, plumbing, and water heater last replaced?
- Why hasn't it sold? Are there any deal-killer items the seller is aware of (foundation, flood, title, zoning, code violations)?
- Is there a deadline driving the sale (1031 exchange, divorce, estate, relocation)? That informs how much negotiation room exists.
- Schools are F-rated, which usually means shorter tenancies and higher turnover. Who's the typical renter profile here, and what's been the actual vacancy rate?
- Crime grade is F in this area — have there been break-ins, vandalism, or insurance claims at this property in the last 3 years? What carrier currently insures it and at what premium?
- The area grade is low — what's the realistic commute time and amenity access for the typical tenant pool here? Any planned neighborhood developments (good or bad) we should know about?
- What's the average days-on-market for RENTAL listings here right now (not sales)? A rising rental-DOM trend means longer vacancies and softer asking-rent achievability than the comps imply.
- What's the recent tenant-quality profile in this submarket — average credit score on applications, eviction rate, late-payment / NSF rate, and stable-employment percentage? A property-management company in the area should have these aggregated.
- How much new for-sale + rental construction is in the pipeline within 1–3 miles? Heavy new supply typically softens prices + rents 12–24 months out; constrained supply supports both.
Investment metrics
- 1% rule
- 0.81% ✗
- Cap rate
- 6.90%
- Cash-on-cash
- 2.17%
- DSCR
- 1.10
- GRM
- 10.3
CMA / ARV
- ARV (median comp)
- $94,941
- List price
- $175,000
- Delta
- 84.32%
- Verdict
- OVERPRICED
- Comps
- 3 within 2.0 mi
Show comp detail 1 sale within ~0.75 mi
| Address | Dist | Beds/Ba | Sqft | Sold | Price | $/sf | Match |
|---|---|---|---|---|---|---|---|
| 903 Davidson Dr | 0.74mi | 3/2.0 | 1,215 (+9%) | 8mo | $75,000 | $62 | 40 |
Match score weights: distance 35% · size 25% · config 20% · recency 20%. Top-matched comps best support the ARV.
Projected returns pro-forma
-3.0% appreciation · 3.0% rent growth · sell at horizon
- IRR
- -12.9%
- Equity multiple
- 0.53×
- Total profit
- $-22,804
- Equity at exit
- $26,093
- IRR
- -4.0%
- Equity multiple
- 0.74×
- Total profit
- $-12,958
- Equity at exit
- $15,131
Cash invested: $49,000 (down + closing). Projections, not guarantees.
Landlord ↔ Tenant lean methodology
- Overall (STATE)
- 55 Moderately Landlord-Leaning
- State New Mexico
- 55 Moderately Landlord-Leaning · D+3
- County
- — inherits STATE
- City
- — inherits STATE
ZIP-level market 88203
- Home prices YoY
- -34.1%
- Active inventory
- 181
- Price-to-rent
- 10.3×
Monthly cashflow live
- Estimated rent
- $1,413 high interval (Pro) →
- Mortgage (P&I)
- −$918
- Tax from tax record
- −$37 /mo · $442/yr
- Insurance
- −$73
- HOA
- −$0
- Vacancy / Maint / Mgmt
- −$297
- Net cashflow
- $89
Break-even live
Sensitivity live
| Price | -10% $188 | -5% $138 | +0% $89 | +5% $39 | +10% $-10 |
|---|---|---|---|---|---|
| Rent | -10% $-23 | -5% $33 | +0% $89 | +5% $144 | +10% $200 |
| Rate | -1.0pp $177 | -0.5pp $133 | base $89 | +0.5pp $43 | +1.0pp $-3 |
UW: 25.0% down · 7.5% · 30yr · 1.5% tax · 5.0% vac · 8.0% maint · 8.0% mgmt
Financing live
Cash to close
- Down payment
- $43,750
- Closing costs
- $5,250
- Reserves months
- —
- Total cash needed
- —
Loan-product check · same deal, 3 products live
Conventional
25% down · 7.5% · 30yr
- Down + closing
- —
- Monthly P&I
- —
- Monthly cashflow
- —
- DSCR
- —
- Eligible?
- —
Personal DTI + credit; lowest rate.
DSCR
20% down · 8.5% · 30yr
- Down + closing
- —
- Monthly P&I
- —
- Monthly cashflow
- —
- DSCR
- —
- Eligible?
- —
No personal income docs; deal must DSCR.
Hard money
10% down · 12.0% · 12mo
- Down + closing
- —
- Monthly P&I
- —
- Monthly cashflow
- —
- DSCR
- —
- Eligible?
- —
Short-term bridge; refi at stabilization.
Rent comps 6 comps
| Address | Beds | Baths | Sqft | Rent | $/sqft | DOM | Units | Dist |
|---|---|---|---|---|---|---|---|---|
| 1014 Plaza del Sol Roswell, NM | 2.0 | 2.0 | 1150 | $1,275 | $1.11 | 45d | 1 | 0.82mi |
| 1002 W Deming St Roswell, NM | 2.0 | 1.0 | 792 | $1,050 | $1.33 | 45d | 1 | 0.88mi |
| 1303 W Bonita Dr Roswell, NM | 2.0 | 1.0 | 840 | $875 | $1.04 | 45d | 1 | 1.04mi |
| 2703 S Onyx Dr Roswell, NM | 3.0 | 2.0 | 1400 | $1,900 | $1.36 | 45d | 1 | 1.16mi |
| 1049 W Poe St Roswell, NM | 2.0 | 1.5 | 1413 | $1,200 | $0.85 | 45d | 1 | 1.24mi |
| 2614 Palomar Pl Roswell, NM | 3.0 | 2.0 | 1278 | $1,400 | $1.10 | 45d | 1 | 1.36mi |
Listing history 19 events
-
2026-06-21days on market $175,000 Active 96 DOM
-
2026-06-19days on market $175,000 Active 94 DOM
-
2026-06-18days on market $175,000 Active 93 DOM
-
2026-06-17days on market $175,000 Active 92 DOM
-
2026-06-16days on market $175,000 Active 91 DOM
-
2026-06-15days on market $175,000 Active 90 DOM
-
2026-06-14days on market $175,000 Active 88 DOM
-
2026-06-12days on market $175,000 Active 87 DOM
-
2026-06-09days on market $175,000 Active 84 DOM
-
2026-06-08days on market $175,000 Active 83 DOM
-
2026-06-07days on market $175,000 Active 82 DOM
-
2026-06-05days on market $175,000 Active 79 DOM
-
2026-06-03days on market $175,000 Active 78 DOM
-
2026-06-02days on market $175,000 Active 77 DOM
-
2026-06-01days on market $175,000 Active 76 DOM
-
2026-05-31days on market $175,000 Active 75 DOM
-
2026-05-30days on market $175,000 Active 74 DOM
-
2026-03-18$175,000 Active 96-char remark
Show marketing remark (96 chars)
Move in ready, 3 bedroms, 2 baths with dinning room, den and living room. New Roof and new HVAC.
-
2002-02-28soldstatus
ⓘ Source: listings_history table (triggers on properties + properties_extension) + one-shot
backfill from property_details.listing_events for pre-trigger history.
Tax reassessment forecast NM · Resets to sale price
- Current annual tax
- $442 · $37/mo
- Projected year-2 tax
- $1,400 · $117/mo
- Expected delta
- +$958/yr (+$80/mo · 216.7%)
ⓘ Screening estimate from a state-policy table — verify with the county assessor before closing.
Climate risk First Street
- Flood 1/10 Low FEMA zone X (unshaded) · 0% chance over 30 yrs
- Wildfire 6/10 Major
- Heat 5/10 Major 7 d/yr ≥99°F today · 20 d/yr by 30 yrs out
- Wind 2/10 Low
- Air quality 1/10 Low 0 unhealthy d/yr today · 0 by 30 yrs out
Nearby sold comps map
Loading sold comps map…
Walkable amenities ~0.75 mi
Loading nearby amenities…
Taxation est. · year 1
- Rental income
- $16,953
- − Mortgage interest
- −$9,803
- − Property taxes
- −$442
- − Insurance
- −$875
- − Repairs & maintenance
- −$1,356
- − Management
- −$1,356
- − Depreciation
- −$5,091
- Taxable loss
- −$1,970
- Est. tax savings @ 24.0%
- +$473
- After-tax cash flow
- $1,536/yr
For passive investors: Depreciation is non-cash, so a rental often shows a tax loss while cash-flowing — sheltering income. Rental losses are passive: they offset passive income freely, and up to $25,000/yr can offset ordinary (W-2) income if you actively participate and your MAGI is under $100k (phasing out to $0 by $150k); unused losses carry forward. On sale, claimed depreciation is recaptured at up to 25%, and gains may owe capital-gains tax (a 1031 exchange can defer both). Figures are a year-1 estimate at your 24.0% rate — not tax advice; consult a CPA.
Schools (NCES district)
- District
- Roswell Independent Schools
- NCES district ID
- 3502250
- Math proficiency
- 11% ▼ -9.00%
- Reading proficiency
- 52% ▲ 23.00%
- Median HH income
- $38,848
- Composite
- 26.21/100
- National rank
- #7262
- State rank
- #16 of 29 in NM
Livability — Roswell
- Score
- 75/100
- State rank
- #8
- US rank
- #4339
Category grades
Schools grade is shown separately in the Schools card above.
Census & demographics
- Census place
- Roswell, NM
- County
- Chaves County · 56,277 people
- City population
- 56,277
- Metro
- Roswell, NM
- Population (ZIP)
- 28,753
- Household income
- $42,207
- Rent vs Own
- Severe rent burden
- 995.0
Population outlook (Chaves County) Hauer SSP2
- Today (2025)
- 66,122 people
- By 2030
- 66,351 · +0.3%
- By 2040
- 66,818 · +1.1%
- By 2050
- 66,928 · +1.2%
- By 2075
- 65,474 · -1.0%
- By 2100
- 58,943 · -10.9%
Race, ethnicity, and origin ACS 2023
- Neighborhood character
- Predominantly Hispanic (65%)
- Race & ethnicity
- Hispanic / Latino 65% White 31% Two or more races 22% Black 2% Native American 1%
- Hispanic origin (detail)
- Mexican 58%
- Common ancestry
- Slovak 1% Serbian 1% Lithuanian 1%
- Foreign-born
- 12% · Canada
- Languages at home
- 62% English-only · Spanish 38%
Political lean MEDSL · Chaves
- 2024 margin
- Solid R (+44.8) · D 26.8% · R 71.6% · Other 1.6%
- 2008→2024 swing
- -20.2pp toward R · 2008: -24.7pp · 2024: -44.8pp
- All cycles
- 2024: R+44.8 2020: R+41.3 2016: R+36.4 2012: R+32.4 2008: R+24.7
Not yet ingested
- Civics
- —
Market trends
- HPI YoY
- ▼ -78.30%
- Current HPI
- 151.1401
- Rent YoY
- —
- Metro
- Roswell, NM
- State GDP YoY
- —
- F500 in state
- 0
Price history
2 events — show timeline
- 2026-03-18 Listed $175,000 NMMLS
- 2002-02-28 Sold (Public Records) — Public Records
Property tax history
+0.6%/yrLatest (2025): $442 · -0.9% YoY. Source: county tax records.
Cash-flow waterfall
monthlySold comps — $/sqft
last 12 mo · ≤1 miLoading sold comps…