261 5th Ave · Callaghan, VA
Flood risk 4/10 · Minor
- FEMA flood zone
- X (unshaded)
- Chance of flooding over 30 yrs
- 0.24%
- Est. flood insurance / yr
- $507 – $1,088
Fire risk 3/10 · Minor
- Est. fire insurance / yr
- $787 – $1,461
Heat risk 4/10 · Minor
- Hot days now (above 92°F)
- 8 days/yr
- Hot days in 30 yrs
- 22 days/yr
Wind risk 2/10 · Minimal
- Chance of severe wind over 30 yrs
- —
Air-quality risk 1/10 · Minimal
- Unhealthy air days now
- 0 days/yr
- Unhealthy air days in 30 yrs
- 0 days/yr
Risk factors via First Street. Map © Google.
Why this score? — see what drove the D grade
The composite is a weighted blend of 9 inputs, each scored 0–100. Each bar is that input's sub-score; the figure is the points it added to the 100-point composite (weight × sub-score).
- Cash flow +10.8/30.0
- ARV discount +7.5/15.0
- Appreciation +7.5/10.0
- Livability +3.6/5.0
- DSCR +3.1/10.0
- Rent growth +2.5/5.0
- Schools +2.5/10.0
- Condition / age +2.5/5.0
- 1% rule +1.8/10.0
$169,000
🖨 Deal sheet (PDF) 📄 Offer letter ✓ Due diligence
Listing remarks
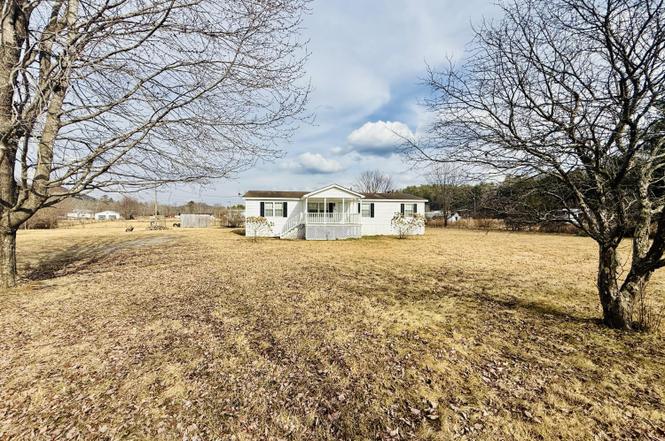
Nestled on a fenced lot of nearly one acre, this well-maintained 3-bedroom, 2-bath manufactured home offers 1,512 square feet of comfortable living space. The property includes an additional single-wide used for storage along with two outbuildings, providing ample space for equipment, hobbies, or extra storage. Enjoy peaceful surroundings from the covered front porch or relax on the screened-in back porch overlooking the yard. Conveniently located near Sherwood Lake and Blue Bend Recreation Area, with nearby trout fishing, camping, hiking trails, and abundant outdoor recreation. A great opportunity for those seeking country living with easy access to nature and adventure.
Key facts
- Covered front porch
- Country living
- Two outbuildings
Tags
Neighborhood map
What this means for you Summary
Snapshot
- This is a 3-bed/2.0-bath single-family listed at $169k.
Deal economics
- At list price, monthly cash flow is $-77 ($-927/yr) — negative.
- To cash-flow at today's rent, offer at most $155k (8.1% below list).
- To meet the 1% rule (rent ≥ 1% of price), the offer needs to be $115k (32.0% below list).
- Recommended offer: $115k (32.0% below list) — sets the bar for 1% rule.
Location & tenants
- Location reads 71/100 on livability (#212 in VA) — a middle-class / working-renter tenant base. Strengths: employment A+, cost of living A+, housing A+; Watch: commute D, amenities F, health & safety F.
- Greenbrier County Schools (town): math 24% / reading 37% proficiency, ranked #31 of 55 in WV (top 56%) — families likely to look elsewhere, expect single-tenant / working-renter base with shorter leases.
- Zoned schools: White Sulphur Elementary (math 37% / reading 32%, grade F, #148 of 377 statewide, top 49%, 337 students, 0% FRL); Eastern Greenbrier Middle School (math 14% / reading 36%, grade F, #81 of 109 statewide, top 76%, 732 students, 0% FRL); Greenbrier East High School (math 21% / reading 51%, grade F, #39 of 110 statewide, top 36%, 1,014 students, 0% FRL) — zoned schools average 0% FRL vs 49% district-wide (49 pts lower); this property's tenant base skews higher-income than the district average.
- Market conditions: 74 units permitted in Greenbrier County in 2024 (0 in 5+ unit buildings).
Forward outlook
- In year one you build about $10k of equity ($1k loan paydown + $8k appreciation (5.0% local appreciation)).
- Greenbrier County population projected to shrink 7% by 2050 — rents likely to lag national; underwrite the cash flow, not the appreciation.
- At projected returns (5.0% appreciation + 3.0% rent growth), your $47k cash investment doubles in ~5 years — after that, you're playing with house money.
- By year 4, paydown + projected appreciation supports a ~$32k cash-out refi (75% LTV) — recoverable capital for the next deal without selling this one.
Negotiation context
- It's been on market 19 days — a 2% lower offer ($166k) is reasonable based on typical stale-listing flexibility.
- 2 sale attempts with the ask held roughly flat each time — persistent listings suggest the price (not the market) is what's stuck; bring a comps-based counter.
- Current owner paid $30k; list at $169k implies a 463% gain — meaningful room to come down on a strong offer.
Questions for the listing agent
- What do current leases actually rent for vs. the listed asking? Can we see a recent rent roll and the last 12 months of T-12 income?
- Is there a deadline driving the sale (1031 exchange, divorce, estate, relocation)? That informs how much negotiation room exists.
- Schools are F-rated, which usually means shorter tenancies and higher turnover. Who's the typical renter profile here, and what's been the actual vacancy rate?
- The area grade is low — what's the realistic commute time and amenity access for the typical tenant pool here? Any planned neighborhood developments (good or bad) we should know about?
- What's the average days-on-market for RENTAL listings here right now (not sales)? A rising rental-DOM trend means longer vacancies and softer asking-rent achievability than the comps imply.
- What's the recent tenant-quality profile in this submarket — average credit score on applications, eviction rate, late-payment / NSF rate, and stable-employment percentage? A property-management company in the area should have these aggregated.
- How much new for-sale + rental construction is in the pipeline within 1–3 miles? Heavy new supply typically softens prices + rents 12–24 months out; constrained supply supports both.
Investment metrics
- 1% rule
- 0.68% ✗
- Cap rate
- 5.74%
- Cash-on-cash
- -1.96%
- DSCR
- 0.91
- GRM
- 12.3
CMA / ARV
No comps found within radius.
Projected returns pro-forma
4.98% appreciation · 3.0% rent growth · sell at horizon
- IRR
- 11.1%
- Equity multiple
- 1.71×
- Total profit
- $33,722
- Equity at exit
- $95,539
- IRR
- 12.4%
- Equity multiple
- 3.24×
- Total profit
- $106,149
- Equity at exit
- $164,697
Cash invested: $47,320 (down + closing). Projections, not guarantees.
Landlord ↔ Tenant lean methodology
- Overall (STATE)
- 55 Moderately Landlord-Leaning
- State Virginia
- 55 Moderately Landlord-Leaning · D+2
- County
- — inherits STATE
- City
- — inherits STATE
ZIP-level market 24986
- Home prices YoY
- 3.1%
- Price-to-rent
- 12.3×
Monthly cashflow live
- Estimated rent
- $1,149 medium interval (Pro) →
- Mortgage (P&I)
- −$886
- Tax from tax record
- −$29 /mo · $343/yr
- Insurance
- −$70
- HOA
- −$0
- Vacancy / Maint / Mgmt
- −$241
- Net cashflow
- $-77
Break-even live
Sensitivity live
| Price | -10% $18 | -5% $-29 | +0% $-77 | +5% $-318 | +10% $-377 |
|---|---|---|---|---|---|
| Rent | -10% $-168 | -5% $-123 | +0% $-77 | +5% $-32 | +10% $14 |
| Rate | -1.0pp $8 | -0.5pp $-34 | base $-77 | +0.5pp $-121 | +1.0pp $-166 |
UW: 25.0% down · 7.5% · 30yr · 1.5% tax · 5.0% vac · 8.0% maint · 8.0% mgmt
Financing live
Cash to close
- Down payment
- $42,250
- Closing costs
- $5,070
- Reserves months
- —
- Total cash needed
- —
Loan-product check · same deal, 3 products live
Conventional
25% down · 7.5% · 30yr
- Down + closing
- —
- Monthly P&I
- —
- Monthly cashflow
- —
- DSCR
- —
- Eligible?
- —
Personal DTI + credit; lowest rate.
DSCR
20% down · 8.5% · 30yr
- Down + closing
- —
- Monthly P&I
- —
- Monthly cashflow
- —
- DSCR
- —
- Eligible?
- —
No personal income docs; deal must DSCR.
Hard money
10% down · 12.0% · 12mo
- Down + closing
- —
- Monthly P&I
- —
- Monthly cashflow
- —
- DSCR
- —
- Eligible?
- —
Short-term bridge; refi at stabilization.
Listing history 5 events
-
2026-04-17status Pending
-
2026-04-15status Active
-
2026-03-23status Pending
-
2026-03-06$169,000 Active
-
2001-09-24soldstatus $30,000
ⓘ Source: listings_history table (triggers on properties + properties_extension) + one-shot
backfill from property_details.listing_events for pre-trigger history.
Tax reassessment forecast VA · Resets to sale price
- Current annual tax
- $343 · $29/mo
- Projected year-2 tax
- $1,386 · $115/mo
- Expected delta
- +$1,043/yr (+$87/mo · 303.8%)
ⓘ Screening estimate from a state-policy table — verify with the county assessor before closing.
Climate risk First Street
- Flood 4/10 Moderate FEMA zone X (unshaded) · 24% chance over 30 yrs
- Wildfire 3/10 Moderate
- Heat 4/10 Moderate 8 d/yr ≥92°F today · 22 d/yr by 30 yrs out
- Wind 2/10 Low
- Air quality 1/10 Low 0 unhealthy d/yr today · 0 by 30 yrs out
Nearby sold comps map
Loading sold comps map…
Walkable amenities ~0.75 mi
Loading nearby amenities…
Taxation est. · year 1
- Rental income
- $13,793
- − Mortgage interest
- −$9,467
- − Property taxes
- −$343
- − Insurance
- −$845
- − Repairs & maintenance
- −$1,103
- − Management
- −$1,103
- − Depreciation
- −$4,916
- Taxable loss
- −$3,985
- Est. tax savings @ 24.0%
- +$956
- After-tax cash flow
- $30/yr
For passive investors: Depreciation is non-cash, so a rental often shows a tax loss while cash-flowing — sheltering income. Rental losses are passive: they offset passive income freely, and up to $25,000/yr can offset ordinary (W-2) income if you actively participate and your MAGI is under $100k (phasing out to $0 by $150k); unused losses carry forward. On sale, claimed depreciation is recaptured at up to 25%, and gains may owe capital-gains tax (a 1031 exchange can defer both). Figures are a year-1 estimate at your 24.0% rate — not tax advice; consult a CPA.
Schools (NCES district)
- District
- Greenbrier County Schools
- NCES district ID
- 5400390
- Math proficiency
- 24% ▼ -14.00%
- Reading proficiency
- 37% ▼ -10.00%
- Median HH income
- $37,088
- Composite
- 25.34/100
- National rank
- #7477
- State rank
- #31 of 55 in WV
Livability — Callaghan
- Score
- 71/100
- State rank
- #212
- US rank
- #6887
Category grades
Schools grade is shown separately in the Schools card above.
Census & demographics
- Population (ZIP)
- 5,082
Population outlook (Greenbrier County) Hauer SSP2
- Today (2025)
- 35,394 people
- By 2030
- 35,182 · -0.6%
- By 2040
- 34,241 · -3.3%
- By 2050
- 32,882 · -7.1%
- By 2075
- 29,435 · -16.8%
- By 2100
- 24,473 · -30.9%
Race, ethnicity, and origin ACS 2023
- Neighborhood character
- Predominantly White (91%)
- Race & ethnicity
- White 91% Black 5% Two or more races 2% Hispanic / Latino 2%
- Common ancestry
- Italian 5% Slovak 2% Serbian 1%
- Foreign-born
- 1% · Canada
- Languages at home
- 97% English-only · Spanish 2% Arabic 1%
Political lean MEDSL · Greenbrier
- 2024 margin
- Solid R (+42.1) · D 28.0% · R 70.1% · Other 1.9%
- 2008→2024 swing
- -29.9pp toward R · 2008: -12.3pp · 2024: -42.1pp
- All cycles
- 2024: R+42.1 2020: R+39.6 2016: R+41.2 2012: R+24.8 2008: R+12.3
Not yet ingested
- Civics
- —
Market trends
- HPI YoY
- ▲ 4.98%
- Current HPI
- 165.3067
- Rent YoY
- —
- Metro
- —
- State GDP YoY
- ▲ 2.40%
- F500 in state
- 50
Industry mix (Fortune 500 HQ in VA)
| Industry | F500 HQs | Revenue |
|---|---|---|
| Aerospace / Defense | 4 | $236B |
|
||
| Technology / Defense | 3 | $32B |
|
||
| Financial Services | 2 | $176B |
|
||
| Utilities | 2 | $27B |
|
||
| Insurance | 2 | $25B |
|
||
| Technology | 2 | $15B |
|
||
Price history
+463.3% since first listed5 events — show timeline
- 2026-04-17 Pending — GVBOR
- 2026-04-15 Relisted — GVBOR
- 2026-03-23 Pending — GVBOR
- 2026-03-06 Listed $169,000 GVBOR
- 2001-09-24 Sold (Public Records) $30,000 Public Records
Property tax history
+9.3%/yrLatest (2025): $343 · -4.0% YoY. Source: county tax records.
Cash-flow waterfall
monthlySold comps — $/sqft
last 12 mo · ≤1 miLoading sold comps…