 Duplex
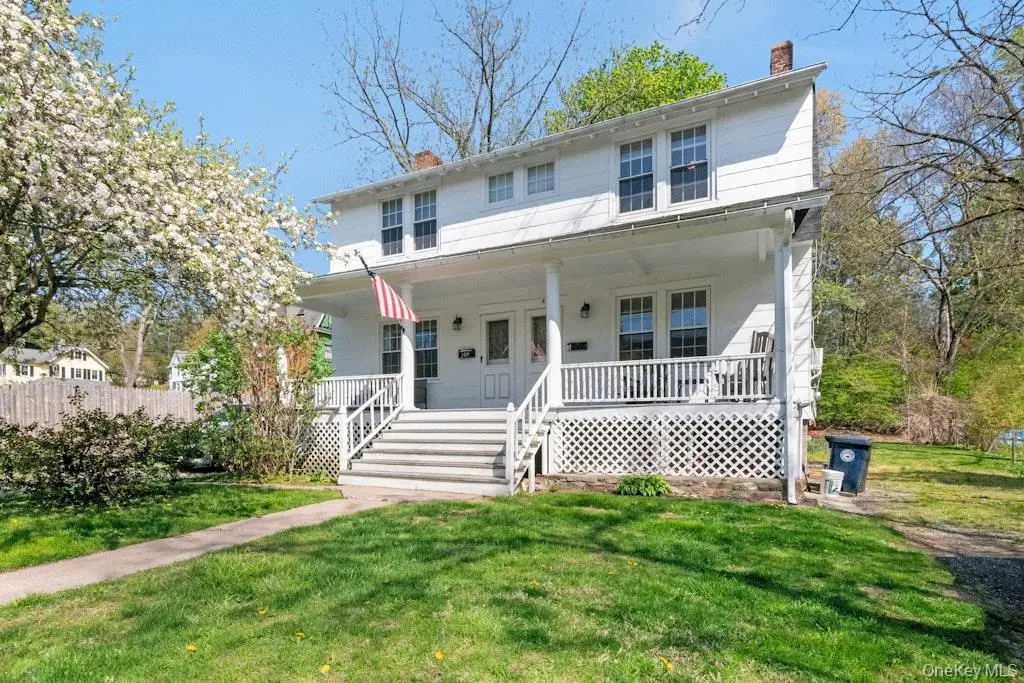
3 Elm St · Chappaqua, NY
Flood risk 8/10 · Major
- FEMA flood zone
- X (unshaded)
- Chance of flooding over 30 yrs
- 0.99%
- Est. flood insurance / yr
- $473 – $860
Fire risk 3/10 · Minor
- Est. fire insurance / yr
- $691 – $1,283
Heat risk 5/10 · Moderate
- Hot days now (above 98°F)
- 7 days/yr
- Hot days in 30 yrs
- 15 days/yr
Wind risk 6/10 · Moderate
- Chance of severe wind over 30 yrs
- 27.0%
Air-quality risk 4/10 · Minor
- Unhealthy air days now
- 4 days/yr
- Unhealthy air days in 30 yrs
- 5 days/yr
Risk factors via First Street. Map © Google.
Why this score? — see what drove the D grade
The composite is a weighted blend of 9 inputs, each scored 0–100. Each bar is that input's sub-score; the figure is the points it added to the 100-point composite (weight × sub-score).
- ARV discount +15.0/15.0
- Schools +8.6/10.0
- Cash flow +6.8/30.0
- Livability +4.0/5.0
- Rent growth +2.5/5.0
- Condition / age +2.5/5.0
- 1% rule +1.7/10.0
- DSCR +1.0/10.0
- Appreciation +0.0/10.0
$1,095,000
🖨 Deal sheet 📄 Offer letter ✓ Due diligence
Multi-family units
County records classify this as Multi-Family (2-4 Unit). Listing-text estimate: 2 units. confirmed
Listing remarks MLS
Rare opportunity- a real 2 family home (side by side). Flat land, convenient to all. Needs updating. House sold "as is".
Key facts
- 7,841 sq ft lot
- Built 1905
- Listed 16 days
Property features AI
Exterior
- Parking: Private driveway
- Utilities: Electricity connected (Con-Edison); Natural gas connected; Public sewer; Public water
- Home design: Duplex; Updated/remodeled condition
- Construction: Frame construction; Shingle siding; Unfinished walk-out basement
- Exterior features: Level, private lot; No waterfront
Interior
- Kitchen: Eat-in kitchen with granite counters
- Bedrooms: Two 2-bedroom units
- Flooring: Hardwood floors
- Bathrooms: Four full bathrooms
- Heating & cooling: Natural gas heating; Wall/window air conditioning units
- Interior features: Eat-in kitchen; Granite counters; Patio
- Laundry & utility: In-unit laundry
Neighborhood map
What this means for you Summary
Snapshot
- This is a 2 × 2-bed/2.0-bath units multifamily listed at $1.09M.
Deal economics
- At list price, monthly cash flow is $-2k ($-21k/yr) — negative. Per door: $-876/mo.
- To cash-flow at today's rent, offer at most $785k (28.3% below list).
- To meet the 1% rule (rent ≥ 1% of price), the offer needs to be $729k (33.4% below list).
- Recommended offer: $729k (33.4% below list) — sets the bar for 1% rule.
- Cap rate 4.4% vs local median 1.5% in Chappaqua — top-decile yield for the area; either an underpriced asset or a hidden risk that comps aren't pricing in. Stress-test before assuming the spread holds.
Location & tenants
- Location reads 81/100 on livability (#99 in NY, #1,518 nationally) — a professional / high-income tenant draw. Strengths: crime A+, employment A+, housing A+; Watch: commute C-, amenities F, cost of living F.
- Chappaqua Central School District (suburban): math 81% / reading 88% proficiency, ranked #5 of 590 in NY (top 1%) — strong family-tenant draw, lease renewals of 3-5y typical; only 2% free/reduced lunch — higher-income household profile.
- Zoned schools: Douglas G Grafflin School (math 82% / reading 92%, grade A+, #69 of 2,108 statewide, top 4%, 438 students, 4% FRL); Robert E Bell School (math 71% / reading 84%, grade A+, #39 of 729 statewide, top 5%, 594 students, 6% FRL); Horace Greeley High School (math 100% / reading 100%, grade A+, #1 of 1,100 statewide, top 0%, 1,152 students, 0% FRL) — zoned schools at 4% FRL track the district average.
- Market conditions: 75 active listings in the ZIP; 954 units permitted in Westchester County in 2024 (649 in 5+ unit buildings).
Forward outlook
- Local home prices are declining (-3.0%/yr); year-one equity from $8k of loan paydown is wiped out by about $33k of value loss. Plan a longer hold.
- Westchester County population projected at +10% by 2050 — modest demand growth; plan on rents tracking national, not racing it.
Negotiation context
- It's been on market 16 days — a 2% lower offer ($1.08M) is reasonable based on typical stale-listing flexibility.
- 3 sale attempts since 10y ago with the ask held roughly flat each time — persistent listings suggest the price (not the market) is what's stuck; bring a comps-based counter.
- Current owner paid $418k; list at $1.09M implies a 162% gain — meaningful room to come down on a strong offer.
Risks & watch-outs
- Watch-outs: flood insurance adds $56/mo; built in 1905 — expect roof / HVAC / electrical / plumbing capex.
- Climate carrying-cost: severe flood risk; major wind risk, 27% chance of damaging wind over 30y; extreme-heat days projected 7→15/yr by 2055 (HVAC capex compounding) — expect insurance premiums to compound above CPI over the hold.
Questions for the listing agent
- What do current leases actually rent for vs. the listed asking? Can we see a recent rent roll and the last 12 months of T-12 income?
- Can we see the unit-by-unit rent roll, current vacancy, and any below-market leases? What's the average tenancy length?
- What capital expenditures (roof, boiler, parking lot, exteriors) have been made in the last 5 years, and what's planned in the next 2?
- Built in 1905 — when were the roof, HVAC, electrical panel, plumbing, and water heater last replaced?
- What's the actual annual flood-insurance premium (NFIP or private), and is the property in a SFHA with mandatory coverage?
- Is there a deadline driving the sale (1031 exchange, divorce, estate, relocation)? That informs how much negotiation room exists.
- Schools are A-rated — typically a magnet for longer-tenancy family renters. What's the average tenant stay here, and is there a school-zone premium baked into asking?
- The area grade is low — what's the realistic commute time and amenity access for the typical tenant pool here? Any planned neighborhood developments (good or bad) we should know about?
- What's the average days-on-market for RENTAL listings here right now (not sales)? A rising rental-DOM trend means longer vacancies and softer asking-rent achievability than the comps imply.
- What's the recent tenant-quality profile in this submarket — average credit score on applications, eviction rate, late-payment / NSF rate, and stable-employment percentage? A property-management company in the area should have these aggregated.
- How much new apartment / multifamily construction is in the pipeline within 1–3 miles? Heavy new supply (>2% of stock underway) typically softens rents 12–24 months out; light construction supports rent growth.
Investment metrics
- 1% rule
- 0.67% ✗
- Cap rate
- 4.43%
- Cash-on-cash
- -6.64%
- DSCR
- 0.70
- GRM
- 12.5
CMA / ARV
- ARV (median comp)
- $1,816,785
- List price
- $1,095,000
- Delta
- -39.73%
- Verdict
- UNDERPRICED
- Comps
- 2 within 1.0 mi
Projected returns pro-forma
-3.0% appreciation · 3.0% rent growth · sell at horizon
- IRR
- -28.2%
- Equity multiple
- 0.06×
- Total profit
- $-288,955
- Equity at exit
- $163,268
- IRR
- -27.2%
- Equity multiple
- -0.29×
- Total profit
- $-395,004
- Equity at exit
- $94,676
Cash invested: $306,600 (down + closing). Projections, not guarantees.
Landlord ↔ Tenant lean methodology
- Overall (STATE)
- 15 Strongly Tenant-Friendly
- State New York
- 15 Strongly Tenant-Friendly · D+10
- County
- — inherits STATE
- City
- — inherits STATE
ZIP-level market 10514
- Active inventory
- 75
- Price-to-rent
- 25.0×
Monthly cashflow live
- Estimated rent
- $7,291 high interval (Pro) →
- Mortgage (P&I)
- −$5,742
- Tax from tax record
- −$1,258 /mo · $15,095/yr
- Insurance
- −$456
- Flood insurance flood zone
- −$56 /mo · $666/yr
- HOA
- −$0
- Vacancy / Maint / Mgmt
- −$1,531
- Net cashflow
- $-1,752
Break-even live
2-unit breakdown (identical units grouped — click to expand)
| Units | Beds | Baths | Est. rent |
|---|---|---|---|
| 2× units | 2 | 2 | $7,290 |
| #1 | 2 | 2 | $3,645 |
| #2 | 2 | 2 | $3,645 |
| Total (2 units) | $7,291 | ||
UW: 25.0% down · 7.5% · 30yr · 1.5% tax · 5.0% vac · 8.0% maint · 8.0% mgmt
Financing live
Cash to close
- Down payment
- $273,750
- Closing costs
- $32,850
- Reserves months
- —
- Total cash needed
- —
Loan-product check · same deal, 3 products live
Conventional
25% down · 7.5% · 30yr
- Down + closing
- —
- Monthly P&I
- —
- Monthly cashflow
- —
- DSCR
- —
- Eligible?
- —
Personal DTI + credit; lowest rate.
DSCR
20% down · 8.5% · 30yr
- Down + closing
- —
- Monthly P&I
- —
- Monthly cashflow
- —
- DSCR
- —
- Eligible?
- —
No personal income docs; deal must DSCR.
Hard money
10% down · 12.0% · 12mo
- Down + closing
- —
- Monthly P&I
- —
- Monthly cashflow
- —
- DSCR
- —
- Eligible?
- —
Short-term bridge; refi at stabilization.
Listing history 11 events
-
2026-05-16status Pending 1077-char remark
-
2026-04-29$1,095,000 Active 1077-char remark
-
2022-06-22price $3,200
-
2016-11-16soldstatus $418,000
-
2016-11-04price $418,000 130-char remark
Show marketing remark (130 chars)
Rare opportunity- a real 2 family home (side by side). Flat land, convenient to all. Needs updating. House sold "as is".
-
2016-11-04soldstatus $418,000 Sold 130-char remark
Show marketing remark (130 chars)
Rare opportunity- a real 2 family home (side by side). Flat land, convenient to all. Needs updating. House sold "as is".
-
2016-11-04soldstatus $418,000
Show marketing remark (130 chars)
Rare opportunity- a real 2 family home (side by side). Flat land, convenient to all. Needs updating. House sold "as is".
-
2016-09-27historical Pending 130-char remark
Show marketing remark (130 chars)
Rare opportunity- a real 2 family home (side by side). Flat land, convenient to all. Needs updating. House sold "as is".
-
2016-09-27price $425,000 130-char remark
Show marketing remark (130 chars)
Rare opportunity- a real 2 family home (side by side). Flat land, convenient to all. Needs updating. House sold "as is".
-
2016-09-08$425,000 Active 130-char remark
Show marketing remark (130 chars)
Rare opportunity- a real 2 family home (side by side). Flat land, convenient to all. Needs updating. House sold "as is".
-
2016-09-08$425,000
Show marketing remark (130 chars)
Rare opportunity- a real 2 family home (side by side). Flat land, convenient to all. Needs updating. House sold "as is".
ⓘ Source: listings_history table (triggers on properties + properties_extension) + one-shot
backfill from property_details.listing_events for pre-trigger history.
Tax reassessment forecast NY · Partial reset (capped growth)
- Current annual tax
- $15,095 · $1,258/mo
- Projected year-2 tax
- $16,800 · $1,400/mo
- Expected delta
- +$1,705/yr (+$142/mo · 11.3%)
ⓘ Screening estimate from a state-policy table — verify with the county assessor before closing.
Climate risk First Street
- Flood 8/10 Severe FEMA zone X (unshaded) · 99% chance over 30 yrs
- Wildfire 3/10 Moderate
- Heat 5/10 Major 7 d/yr ≥98°F today · 15 d/yr by 30 yrs out
- Wind 6/10 Major 27% chance of damaging wind over 30 yrs
- Air quality 4/10 Moderate 4 unhealthy d/yr today · 5 by 30 yrs out
Nearby sold comps map
Loading sold comps map…
Walkable amenities ~0.75 mi
Loading nearby amenities…
Taxation est. · year 1
- Rental income
- $87,492
- − Mortgage interest
- −$61,337
- − Property taxes
- −$15,095
- − Insurance
- −$6,142
- − Repairs & maintenance
- −$6,999
- − Management
- −$6,999
- − Depreciation
- −$31,855
- Taxable loss
- −$40,935
- Est. tax savings @ 24.0%
- +$9,824
- After-tax cash flow
- $-11,201/yr
For passive investors: Depreciation is non-cash, so a rental often shows a tax loss while cash-flowing — sheltering income. Rental losses are passive: they offset passive income freely, and up to $25,000/yr can offset ordinary (W-2) income if you actively participate and your MAGI is under $100k (phasing out to $0 by $150k); unused losses carry forward. On sale, claimed depreciation is recaptured at up to 25%, and gains may owe capital-gains tax (a 1031 exchange can defer both). Figures are a year-1 estimate at your 24.0% rate — not tax advice; consult a CPA.
Schools (NCES district)
- District
- Chappaqua Central School District
- NCES district ID
- 3606990
- Math proficiency
- 81% ▼ -7.00%
- Reading proficiency
- 88% ▲ 6.00%
- Median HH income
- $200,741
- Composite
- 85.78/100
- National rank
- #7
- State rank
- #5 of 590 in NY
Livability — Chappaqua
- Score
- 81/100
- State rank
- #99
- US rank
- #1518
Category grades
Schools grade is shown separately in the Schools card above.
Census & demographics
- Census place
- Chappaqua, NY
- Population (ZIP)
- 12,227
Population outlook (Westchester County) Hauer SSP2
- Today (2025)
- 1,028,035 people
- By 2030
- 1,051,636 · +2.3%
- By 2040
- 1,098,520 · +6.9%
- By 2050
- 1,136,044 · +10.5%
- By 2075
- 1,196,925 · +16.4%
- By 2100
- 1,175,147 · +14.3%
Race, ethnicity, and origin ACS 2023
- Neighborhood character
- Predominantly White (69%)
- Race & ethnicity
- White 69% Asian 13% Two or more races 9% Hispanic / Latino 9% Black 4%
- Hispanic origin (detail)
- Dominican 3%
- Common ancestry
- Italian 4% Romanian 3% Scotch-Irish 3%
- Foreign-born
- 15% · Canada, China, South Korea
- Languages at home
- 85% English-only · Other Indo-European 6% Chinese 3% Spanish 3%
Political lean MEDSL · Westchester
- 2024 margin
- Strong D (+26.3) · D 63.1% · R 36.9%
- 2008→2024 swing
- -1.3pp toward R · 2008: 27.6pp · 2024: 26.3pp
- All cycles
- 2024: D+26.3 2020: D+36.3 2016: D+32.8 2012: D+22.2 2008: D+27.6
Not yet ingested
- Civics
- —
Market trends
- HPI YoY
- ▼ -633.91%
- Current HPI
- 251.9894
- Rent YoY
- —
- Metro
- —
- State GDP YoY
- ▲ 2.60%
- F500 in state
- 92
Industry mix (Fortune 500 HQ in NY)
| Industry | F500 HQs | Revenue |
|---|---|---|
| Financial Services | 10 | $950B |
|
||
| Consumer Goods | 9 | $162B |
|
||
| Insurance | 4 | $225B |
|
||
| Telecommunications | 2 | $144B |
|
||
| Pharmaceuticals | 2 | $112B |
|
||
| Media / Entertainment | 2 | $69B |
|
||
Price history
+157.6% since first listed11 events — show timeline
- 2026-05-16 Pending — OneKey® MLS as Distributed by MLS Grid
- 2026-04-29 Listed $1,095,000 OneKey® MLS as Distributed by MLS Grid
- 2022-06-22 Price Changed $3,200 RENT.
- 2016-11-16 Sold (Public Records) $418,000 Public Records
- 2016-11-04 Sold (MLS) $418,000 HGMLS
- 2016-11-04 Price Changed $418,000 HGMLS
- 2016-11-04 Sold (MLS) $418,000 OneKey® MLS as Distributed by MLS Grid
- 2016-09-27 Contingent — HGMLS
- 2016-09-27 Price Changed $425,000 HGMLS
- 2016-09-08 Listed $425,000 HGMLS
- 2016-09-08 Listed $425,000 OneKey® MLS as Distributed by MLS Grid
Property tax history
+2.0%/yrLatest (2025): $15,095 · +2.2% YoY. Source: county tax records.
Cash-flow waterfall
monthlySold comps — $/sqft
last 12 mo · ≤1 miLoading sold comps…