274 3rd St · Elizabethtown, KY
Flood risk 1/10 · Minimal
- FEMA flood zone
- X (unshaded)
- Chance of flooding over 30 yrs
- 0.0%
- Est. flood insurance / yr
- $507 – $1,088
Fire risk 4/10 · Minor
- Est. fire insurance / yr
- $839 – $1,559
Heat risk 4/10 · Minor
- Hot days now (above 103°F)
- 7 days/yr
- Hot days in 30 yrs
- 19 days/yr
Wind risk 2/10 · Minimal
- Chance of severe wind over 30 yrs
- 2.0%
Air-quality risk 2/10 · Minimal
- Unhealthy air days now
- 0 days/yr
- Unhealthy air days in 30 yrs
- 2 days/yr
Risk factors via First Street. Map © Google.
Why this score? — see what drove the D+ grade
The composite is a weighted blend of 9 inputs, each scored 0–100. Each bar is that input's sub-score; the figure is the points it added to the 100-point composite (weight × sub-score).
- ARV discount +15.0/15.0
- Cash flow +13.2/30.0
- DSCR +4.0/10.0
- Livability +3.6/5.0
- Rent growth +3.3/5.0
- Schools +3.2/10.0
- Condition / age +2.5/5.0
- 1% rule +2.4/10.0
- Appreciation +0.0/10.0
$218,000
🖨 Deal sheet (PDF) 📄 Offer letter ✓ Due diligence
Listing remarks
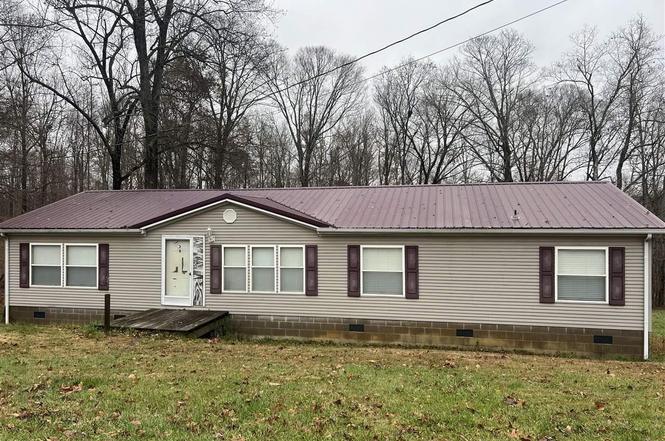
2.2 acres with endless potential! This property features a 3-bedroom, 2-bathroom mobile home offering comfortable living space surrounded by mature scenery. A major highlight is the 2,400 sq. ft. garage/workshop, complete with electric, concrete flooring, and heat provided by a wood-burning stove ideal for projects, storage, or hobby use year-round. With space to spread out and a highly functional setup, this property is perfect for those seeking privacy, room to work, or a versatile homestead. Discover the perfect blend of space, privacy, and functionality on this beautiful 2.2-acre property. Conveniently located on Dixie Hwy (31W), this property provides a quick commute to Fort Knox or Jo
Key facts
- Privacy
- Mobile home
- 2 acres
Tags
Neighborhood map
What this means for you Summary
Snapshot
- This is a 3-bed/2.0-bath single-family listed at $218k.
Deal economics
- At list price, monthly cash flow is $-5 ($-55/yr) — negative.
- To cash-flow at today's rent, offer at most $217k (0.4% below list).
- To meet the 1% rule (rent ≥ 1% of price), the offer needs to be $162k (25.5% below list).
- Recommended offer: $162k (25.5% below list) — sets the bar for 1% rule.
- Cap rate 6.3% vs local median 3.4% in Elizabethtown — top-decile yield for the area; either an underpriced asset or a hidden risk that comps aren't pricing in. Stress-test before assuming the spread holds.
Location & tenants
- Location reads 72/100 on livability (#131 in KY) — a middle-class / working-renter tenant base. Strengths: crime A+, cost of living A+, housing A; Watch: employment D, amenities F, commute F.
- Hardin County (suburban): math 30% / reading 43% proficiency, ranked #47 of 165 in KY (top 28%) — families likely to look elsewhere, expect single-tenant / working-renter base with shorter leases.
- Zoned schools: New Highland Elementary School (math 22% / reading 27%, grade F, #489 of 676 statewide, top 76%, 501 students, 62% FRL); Bluegrass Middle School (math 22% / reading 40%, grade F, #138 of 217 statewide, top 65%, 578 students, 52% FRL); John Hardin High School (math 27% / reading 42%, grade F, #76 of 254 statewide, top 34%, 790 students, 52% FRL).
- Market conditions: Rents rising (+3.3%/yr); 548 active listings in the ZIP; 1 comparable units currently listed for rent nearby; 946 units permitted in Hardin County in 2024 (464 in 5+ unit buildings).
Forward outlook
- Local home prices are declining (-3.0%/yr); year-one equity from $2k of loan paydown is wiped out by about $7k of value loss. Plan a longer hold.
- Hardin County population projected at -16% by 2050 — secular population decline; favor cash flow + early exit over multi-decade hold.
Negotiation context
- It's been on market 147 days — a 12% lower offer ($192k) is reasonable based on typical stale-listing flexibility.
Questions for the listing agent
- What do current leases actually rent for vs. the listed asking? Can we see a recent rent roll and the last 12 months of T-12 income?
- It's been on market 147 days. Have you received any prior offers? Is the seller open to a 26% concession, seller financing, or rate buy-down credit?
- Why hasn't it sold? Are there any deal-killer items the seller is aware of (foundation, flood, title, zoning, code violations)?
- Is there a deadline driving the sale (1031 exchange, divorce, estate, relocation)? That informs how much negotiation room exists.
- The area grade is low — what's the realistic commute time and amenity access for the typical tenant pool here? Any planned neighborhood developments (good or bad) we should know about?
- What's the average days-on-market for RENTAL listings here right now (not sales)? A rising rental-DOM trend means longer vacancies and softer asking-rent achievability than the comps imply.
- What's the recent tenant-quality profile in this submarket — average credit score on applications, eviction rate, late-payment / NSF rate, and stable-employment percentage? A property-management company in the area should have these aggregated.
- How much new for-sale + rental construction is in the pipeline within 1–3 miles? Heavy new supply typically softens prices + rents 12–24 months out; constrained supply supports both.
Investment metrics
- 1% rule
- 0.74% ✗
- Cap rate
- 6.27%
- Cash-on-cash
- -0.09%
- DSCR
- 1.00
- GRM
- 11.2
CMA / ARV
- ARV (on-the-fly)
- $263,500
- Comps found
- 4
Show comp detail 4 sales within ~0.75 mi
| Address | Dist | Beds/Ba | Sqft | Sold | Price | $/sf | Match |
|---|---|---|---|---|---|---|---|
| 801 Pine Valley Ct | 0.64mi | 4/3.0 (+1) | 1,774 (+4%) | 1mo | $274,190 | $155 | 53 |
| 2533 Kensington Way | 0.55mi | 3/2.5 | 1,716 (+1%) | 23mo | $310,000 | $181 | 52 |
| 115 Hickory Hl | 0.67mi | 3/1.5 | 1,620 (-5%) | 12mo | $240,000 | $148 | 49 |
| 429 Meadowview Dr | 0.72mi | 3/1.5 | 1,627 (-4%) | 24mo | $222,000 | $136 | 37 |
Match score weights: distance 35% · size 25% · config 20% · recency 20%. Top-matched comps best support the ARV.
Projected returns pro-forma
-3.0% appreciation · 3.32% rent growth · sell at horizon
- IRR
- -16.2%
- Equity multiple
- 0.42×
- Total profit
- $-35,201
- Equity at exit
- $32,505
- IRR
- -7.5%
- Equity multiple
- 0.52×
- Total profit
- $-29,309
- Equity at exit
- $18,849
Cash invested: $61,040 (down + closing). Projections, not guarantees.
Landlord ↔ Tenant lean methodology
- Overall (STATE)
- 83 Strongly Landlord-Friendly
- State Kentucky
- 83 Strongly Landlord-Friendly · R+16
- County
- — inherits STATE
- City
- — inherits STATE
ZIP-level market 42701
- Home prices YoY
- -29.8%
- Rents YoY
- 3.3%
- Active inventory
- 548
- Price-to-rent
- 11.2×
Monthly cashflow live
- Estimated rent
- $1,623 medium interval (Pro) →
- Mortgage (P&I)
- −$1,143
- Tax from tax record
- −$53 /mo · $635/yr
- Insurance
- −$91
- HOA
- −$0
- Vacancy / Maint / Mgmt
- −$341
- Net cashflow
- $-5
Break-even live
Sensitivity live
| Price | -10% $119 | -5% $57 | +0% $-5 | +5% $-66 | +10% $-128 |
|---|---|---|---|---|---|
| Rent | -10% $-133 | -5% $-69 | +0% $-5 | +5% $60 | +10% $124 |
| Rate | -1.0pp $105 | -0.5pp $51 | base $-5 | +0.5pp $-61 | +1.0pp $-119 |
UW: 25.0% down · 7.5% · 30yr · 1.5% tax · 5.0% vac · 8.0% maint · 8.0% mgmt
Financing live
Cash to close
- Down payment
- $54,500
- Closing costs
- $6,540
- Reserves months
- —
- Total cash needed
- —
Loan-product check · same deal, 3 products live
Conventional
25% down · 7.5% · 30yr
- Down + closing
- —
- Monthly P&I
- —
- Monthly cashflow
- —
- DSCR
- —
- Eligible?
- —
Personal DTI + credit; lowest rate.
DSCR
20% down · 8.5% · 30yr
- Down + closing
- —
- Monthly P&I
- —
- Monthly cashflow
- —
- DSCR
- —
- Eligible?
- —
No personal income docs; deal must DSCR.
Hard money
10% down · 12.0% · 12mo
- Down + closing
- —
- Monthly P&I
- —
- Monthly cashflow
- —
- DSCR
- —
- Eligible?
- —
Short-term bridge; refi at stabilization.
Rent comps 1 comps
| Address | Beds | Baths | Sqft | Rent | $/sqft | DOM | Units | Dist |
|---|---|---|---|---|---|---|---|---|
| 845 Pine Valley Dr Elizabethtown, KY | 2.0–3.0 | 2.0–3.0 | 1412 | $1,350 | $0.96 | 23d | 1 | 0.75mi |
Listing history 3 events
-
2026-04-20status Pending
-
2026-04-08price $218,000
-
2025-11-24$225,000 Active
ⓘ Source: listings_history table (triggers on properties + properties_extension) + one-shot
backfill from property_details.listing_events for pre-trigger history.
Tax reassessment forecast KY · Resets to sale price
- Current annual tax
- $635 · $53/mo
- Projected year-2 tax
- $1,875 · $156/mo
- Expected delta
- +$1,240/yr (+$103/mo · 195.3%)
ⓘ Screening estimate from a state-policy table — verify with the county assessor before closing.
Climate risk First Street
- Flood 1/10 Low FEMA zone X (unshaded) · 0% chance over 30 yrs
- Wildfire 4/10 Moderate
- Heat 4/10 Moderate 7 d/yr ≥103°F today · 19 d/yr by 30 yrs out
- Wind 2/10 Low 2% chance of damaging wind over 30 yrs
- Air quality 2/10 Low 0 unhealthy d/yr today · 2 by 30 yrs out
Nearby sold comps map
Loading sold comps map…
Walkable amenities ~0.75 mi
Loading nearby amenities…
Taxation est. · year 1
- Rental income
- $19,480
- − Mortgage interest
- −$12,211
- − Property taxes
- −$635
- − Insurance
- −$1,090
- − Repairs & maintenance
- −$1,558
- − Management
- −$1,558
- − Depreciation
- −$6,342
- Taxable loss
- −$3,915
- Est. tax savings @ 24.0%
- +$940
- After-tax cash flow
- $885/yr
For passive investors: Depreciation is non-cash, so a rental often shows a tax loss while cash-flowing — sheltering income. Rental losses are passive: they offset passive income freely, and up to $25,000/yr can offset ordinary (W-2) income if you actively participate and your MAGI is under $100k (phasing out to $0 by $150k); unused losses carry forward. On sale, claimed depreciation is recaptured at up to 25%, and gains may owe capital-gains tax (a 1031 exchange can defer both). Figures are a year-1 estimate at your 24.0% rate — not tax advice; consult a CPA.
Schools (NCES district)
- District
- Hardin County
- NCES district ID
- 2102490
- Math proficiency
- 30% ▼ -13.00%
- Reading proficiency
- 43% ▼ -10.00%
- Median HH income
- $50,728
- Composite
- 31.61/100
- National rank
- #5945
- State rank
- #47 of 165 in KY
Livability — Elizabethtown
- Score
- 72/100
- State rank
- #131
- US rank
- #6198
Category grades
Schools grade is shown separately in the Schools card above.
Census & demographics
- County
- Hardin County · 77,611 people
- City population
- 53,987
- Metro
- Elizabethtown-Fort Knox, KY
- Population (ZIP)
- 53,987
- Household income
- $69,619
- Rent vs Own
- Severe rent burden
- 1663.0
Population outlook (Hardin County) Hauer SSP2
- Today (2025)
- 105,573 people
- By 2030
- 103,563 · -1.9%
- By 2040
- 97,077 · -8.0%
- By 2050
- 88,367 · -16.3%
- By 2075
- 65,405 · -38.0%
- By 2100
- 42,245 · -60.0%
Race, ethnicity, and origin ACS 2023
- Neighborhood character
- Predominantly White (79%)
- Race & ethnicity
- White 79% Black 9% Two or more races 6% Hispanic / Latino 5% Asian 2%
- Hispanic origin (detail)
- Mexican 3% Puerto Rican 1%
- Common ancestry
- Italian 3% Slovak 2% Romanian 2%
- Foreign-born
- 4% · Canada, South Korea
- Languages at home
- 94% English-only · Spanish 3% German/W. Germanic 1% Other Indo-European 1%
Political lean MEDSL · Hardin
- 2024 margin
- Strong R (+29.3) · D 34.5% · R 63.8% · Other 1.7%
- 2008→2024 swing
- -8.7pp toward R · 2008: -20.6pp · 2024: -29.3pp
- All cycles
- 2024: R+29.3 2020: R+24.0 2016: R+30.2 2012: R+20.8 2008: R+20.6
Not yet ingested
- Civics
- —
Market trends
- HPI YoY
- ▼ -96.94%
- Current HPI
- 228.7091
- Rent YoY
- ▲ 3.32%
- Metro
- Elizabethtown-Fort Knox, KY
- State GDP YoY
- ▲ 1.81%
- F500 in state
- 4
Industry mix (Fortune 500 HQ in KY)
| Industry | F500 HQs | Revenue |
|---|---|---|
| Healthcare | 1 | $118B |
|
||
| Food / Beverage | 1 | $7B |
|
||
Price history
-3.1% since first listed3 events — show timeline
- 2026-04-20 Pending — HKARMLS
- 2026-04-08 Price Changed $218,000 HKARMLS
- 2025-11-24 Listed $225,000 HKARMLS
Property tax history
-0.9%/yrLatest (2025): $635 · +24.4% YoY. Source: county tax records.
Cash-flow waterfall
monthlySold comps — $/sqft
last 12 mo · ≤1 miLoading sold comps…