1056 Peach St · Bunnell, FL
Flood risk 1/10 · Minimal
- FEMA flood zone
- X (unshaded)
- Chance of flooding over 30 yrs
- 0.0%
- Est. flood insurance / yr
- $507 – $1,088
Fire risk 7/10 · Major
- Est. fire insurance / yr
- $947 – $1,759
Heat risk 9/10 · Severe
- Hot days now (above 108°F)
- 7 days/yr
- Hot days in 30 yrs
- 20 days/yr
Wind risk 9/10 · Severe
- Chance of severe wind over 30 yrs
- 99.0%
Air-quality risk 2/10 · Minimal
- Unhealthy air days now
- 2 days/yr
- Unhealthy air days in 30 yrs
- 2 days/yr
Risk factors via First Street. Map © Google.
Why this score? — see what drove the B grade
The composite is a weighted blend of 9 inputs, each scored 0–100. Each bar is that input's sub-score; the figure is the points it added to the 100-point composite (weight × sub-score).
- Cash flow +26.5/30.0
- ARV discount +15.0/15.0
- DSCR +9.0/10.0
- 1% rule +7.9/10.0
- Schools +4.6/10.0
- Livability +3.6/5.0
- Rent growth +2.5/5.0
- Condition / age +2.5/5.0
- Appreciation +0.0/10.0
$145,000
🖨 Deal sheet 📄 Offer letter ✓ Due diligence
Listing remarks
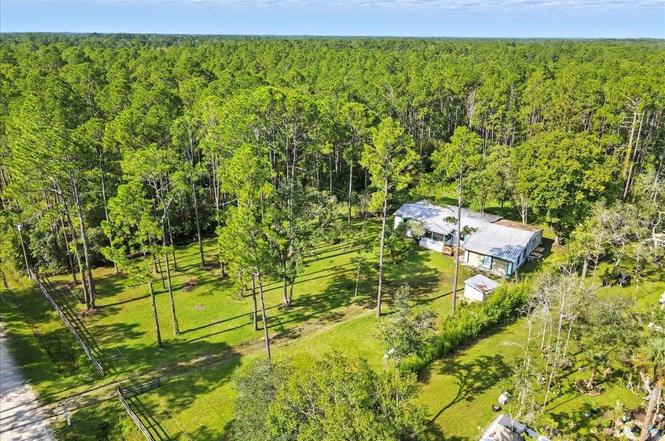
Bring your vision to this spacious property on a beautiful cleared lot in Bunnell! This home offers plenty of room to renovate and customize to your taste, with flexible living areas that could allow for in-law or multi-generational arrangements. A detached 2-car garage provides extra storage or workshop potential, and the large lot offers ample outdoor space for recreation, gardening, or future improvements. With some updates, this property could become a fantastic homestead or investment opportunity. HUD Owned, Equal Housing Opportunity, CASE# 091-674485
Key facts
- Ample outdoor space
- 1.14 acre lot
- 2 garage spots
Tags
Neighborhood map
What this means for you Summary
Snapshot
- This is a 3-bed/3.0-bath manufactured listed at $145k.
Deal economics
- At list price, monthly cash flow is $382 ($5k/yr) — positive.
- The deal already cash-flows at list — no discount required.
- Meets the 1% rule at list price ($2k rent vs $145k).
- Recommended offer: $132k (9.0% below list) — sets the bar for market timing.
- Cap rate 9.5% vs local median 3.5% in Bunnell — top-decile yield for the area; either an underpriced asset or a hidden risk that comps aren't pricing in. Stress-test before assuming the spread holds.
Location & tenants
- Location reads 71/100 on livability (#378 in FL) — a middle-class / working-renter tenant base. Strengths: crime A+, cost of living A+, health & safety A+; Watch: amenities F, commute F, employment F.
- Flagler (rural): math 53% / reading 56% proficiency, ranked #20 of 73 in FL (top 27%) — acceptable for families but not a draw, mixed tenant base, ~2y average lease.
- Zoned schools: Bunnell Elementary School (math 42% / reading 44%, grade F, #1,366 of 2,144 statewide, top 64%, 1,080 students, 73% FRL); Flagler-Palm Coast High School (math 36% / reading 51%, grade F, #248 of 667 statewide, top 38%, 2,523 students, 52% FRL).
- Market conditions: 277 active listings in the ZIP; 2,588 units permitted in Flagler County in 2024 (0 in 5+ unit buildings).
Forward outlook
- Local home prices are declining (-3.0%/yr); year-one equity from $1k of loan paydown is wiped out by about $4k of value loss. Plan a longer hold.
- Flagler County population projected at +28% by 2050 — long-run rental-demand tailwind backs the buy-and-hold thesis.
- At projected returns (-3.0% appreciation + 3.0% rent growth), your $41k cash investment doubles in ~10 years — after that, you're playing with house money.
Negotiation context
- It's been on market 97 days — a 9% lower offer ($132k) is reasonable based on typical stale-listing flexibility.
- 7 sale attempts since 10y ago; this cycle's ask has dropped $15k (9%) from the opening price — seller is motivated, your offer sets the floor, not the list.
Risks & watch-outs
- Climate carrying-cost: severe wind risk, 99% chance of damaging wind over 30y; major wildfire risk; extreme-heat days projected 7→20/yr by 2055 (HVAC capex compounding) — expect insurance premiums to compound above CPI over the hold.
Questions for the listing agent
- It's been on market 97 days. Have you received any prior offers? Is the seller open to a 9% concession, seller financing, or rate buy-down credit?
- Why hasn't it sold? Are there any deal-killer items the seller is aware of (foundation, flood, title, zoning, code violations)?
- Is there a deadline driving the sale (1031 exchange, divorce, estate, relocation)? That informs how much negotiation room exists.
- What's the average days-on-market for RENTAL listings here right now (not sales)? A rising rental-DOM trend means longer vacancies and softer asking-rent achievability than the comps imply.
- What's the recent tenant-quality profile in this submarket — average credit score on applications, eviction rate, late-payment / NSF rate, and stable-employment percentage? A property-management company in the area should have these aggregated.
- How much new for-sale + rental construction is in the pipeline within 1–3 miles? Heavy new supply typically softens prices + rents 12–24 months out; constrained supply supports both.
Investment metrics
- 1% rule
- 1.29% ✓
- Cap rate
- 9.45%
- Cash-on-cash
- 11.29%
- DSCR
- 1.50
- GRM
- 6.5
CMA / ARV
- ARV (on-the-fly)
- $212,952
- Comps found
- 5
Show comp detail 5 sales within ~0.75 mi
| Address | Dist | Beds/Ba | Sqft | Sold | Price | $/sf | Match |
|---|---|---|---|---|---|---|---|
| 1391 Beech Blvd | 0.41mi | 4/2.0 (+1) | 1,813 (-3%) | 4mo | $245,500 | $135 | 64 |
| 5636 Cherry Ln | 0.46mi | 4/2.0 (+1) | 1,782 (-5%) | 9mo | $155,000 | $87 | 54 |
| 1103 Rosewood St | 0.64mi | 4/2.0 (+1) | 1,800 (-4%) | 11mo | $267,900 | $149 | 46 |
| 1101 Hazelnut St | 0.51mi | 4/2.0 (+1) | 1,620 (-13%) | 3mo | $100,000 | $62 | 43 |
| 1590 Candleberry St | 0.58mi | 3/2.0 | 1,620 (-13%) | 14mo | $185,000 | $114 | 35 |
Match score weights: distance 35% · size 25% · config 20% · recency 20%. Top-matched comps best support the ARV.
Projected returns pro-forma
-3.0% appreciation · 3.0% rent growth · sell at horizon
- IRR
- 0.6%
- Equity multiple
- 1.02×
- Total profit
- $911
- Equity at exit
- $21,620
- IRR
- 10.3%
- Equity multiple
- 1.80×
- Total profit
- $32,454
- Equity at exit
- $12,537
Cash invested: $40,600 (down + closing). Projections, not guarantees.
Landlord ↔ Tenant lean methodology
- Overall (STATE)
- 87 Strongly Landlord-Friendly
- State Florida
- 87 Strongly Landlord-Friendly · R+3
- County
- — inherits STATE
- City
- — inherits STATE
ZIP-level market 32110
- Home prices YoY
- -22.4%
- Active inventory
- 277
- Price-to-rent
- 6.5×
Monthly cashflow live
- Estimated rent
- $1,866 medium interval (Pro) →
- Mortgage (P&I)
- −$760
- Tax from tax record
- −$271 /mo · $3,256/yr
- Insurance
- −$60
- HOA
- −$0
- Vacancy / Maint / Mgmt
- −$392
- Net cashflow
- $382
Break-even live
UW: 25.0% down · 7.5% · 30yr · 1.5% tax · 5.0% vac · 8.0% maint · 8.0% mgmt
Financing live
Cash to close
- Down payment
- $36,250
- Closing costs
- $4,350
- Reserves months
- —
- Total cash needed
- —
Loan-product check · same deal, 3 products live
Conventional
25% down · 7.5% · 30yr
- Down + closing
- —
- Monthly P&I
- —
- Monthly cashflow
- —
- DSCR
- —
- Eligible?
- —
Personal DTI + credit; lowest rate.
DSCR
20% down · 8.5% · 30yr
- Down + closing
- —
- Monthly P&I
- —
- Monthly cashflow
- —
- DSCR
- —
- Eligible?
- —
No personal income docs; deal must DSCR.
Hard money
10% down · 12.0% · 12mo
- Down + closing
- —
- Monthly P&I
- —
- Monthly cashflow
- —
- DSCR
- —
- Eligible?
- —
Short-term bridge; refi at stabilization.
Listing history 19 events
-
2026-03-30status Pending
-
2026-03-25price $145,000
-
2026-03-24status Active
-
2026-03-23historical
-
2026-03-20status Active
-
2026-01-03status Pending
-
2025-12-29$160,000 Active
-
2025-12-23historical
-
2025-11-25price $160,000
-
2025-09-23$185,000 Active
-
2025-08-11historical
-
2024-08-26price $171,000
-
2024-05-23$121,260 Active
-
2019-07-26soldstatus $167,000
-
2019-07-16soldstatus $167,000
-
2019-03-21$163,900
-
2016-12-21soldstatus $60,000
-
2016-12-14soldstatus $60,000
-
2016-10-05$69,900
ⓘ Source: listings_history table (triggers on properties + properties_extension) + one-shot
backfill from property_details.listing_events for pre-trigger history.
Tax reassessment forecast FL · Resets to sale price
- Current annual tax
- $3,256 · $271/mo
- Projected year-2 tax
- $3,256 · $271/mo
- Expected delta
- $0/yr ($0/mo · 0.0%)
ⓘ Screening estimate from a state-policy table — verify with the county assessor before closing.
Climate risk First Street
- Flood 1/10 Low FEMA zone X (unshaded) · 0% chance over 30 yrs
- Wildfire 7/10 Severe
- Heat 9/10 Extreme 7 d/yr ≥108°F today · 20 d/yr by 30 yrs out
- Wind 9/10 Extreme 99% chance of damaging wind over 30 yrs
- Air quality 2/10 Low 2 unhealthy d/yr today · 2 by 30 yrs out
Nearby sold comps map
Loading sold comps map…
Walkable amenities ~0.75 mi
Loading nearby amenities…
Taxation est. · year 1
- Rental income
- $22,391
- − Mortgage interest
- −$8,122
- − Property taxes
- −$3,256
- − Insurance
- −$725
- − Repairs & maintenance
- −$1,791
- − Management
- −$1,791
- − Depreciation
- −$4,218
- Taxable income
- $2,487
- Est. tax owed @ 24.0%
- −$597
- After-tax cash flow
- $3,986/yr
For passive investors: Depreciation is non-cash, so a rental often shows a tax loss while cash-flowing — sheltering income. Rental losses are passive: they offset passive income freely, and up to $25,000/yr can offset ordinary (W-2) income if you actively participate and your MAGI is under $100k (phasing out to $0 by $150k); unused losses carry forward. On sale, claimed depreciation is recaptured at up to 25%, and gains may owe capital-gains tax (a 1031 exchange can defer both). Figures are a year-1 estimate at your 24.0% rate — not tax advice; consult a CPA.
Schools (NCES district)
- District
- Flagler
- NCES district ID
- 1200540
- Math proficiency
- 53% ▼ -9.00%
- Reading proficiency
- 56% ▼ -4.00%
- Median HH income
- $48,354
- Composite
- 46.35/100
- National rank
- #2464
- State rank
- #20 of 73 in FL
Livability — Bunnell
- Score
- 71/100
- State rank
- #378
- US rank
- #6714
Category grades
Schools grade is shown separately in the Schools card above.
Census & demographics
- Population (ZIP)
- 9,877
Population outlook (Flagler County) Hauer SSP2
- Today (2025)
- 123,474 people
- By 2030
- 131,864 · +6.8%
- By 2040
- 146,176 · +18.4%
- By 2050
- 157,398 · +27.5%
- By 2075
- 177,990 · +44.2%
- By 2100
- 183,381 · +48.5%
Race, ethnicity, and origin ACS 2023
- Neighborhood character
- Predominantly White (81%)
- Race & ethnicity
- White 81% Black 11% Two or more races 6% Hispanic / Latino 3%
- Common ancestry
- Romanian 6% Lithuanian 2% Slovak 2%
- Foreign-born
- 2% · Canada
- Languages at home
- 97% English-only · Spanish 2%
Political lean MEDSL · Flagler
- 2024 margin
- Strong R (+28.2) · D 35.6% · R 63.8%
- 2008→2024 swing
- -29.8pp toward R · 2008: 1.6pp · 2024: -28.2pp
- All cycles
- 2024: R+28.2 2020: R+20.8 2016: R+20.6 2012: R+7.4 2008: D+1.6
Not yet ingested
- Civics
- —
Market trends
- HPI YoY
- ▼ -78.28%
- Current HPI
- 271.446
- Rent YoY
- —
- Metro
- —
- State GDP YoY
- ▲ 3.28%
- F500 in state
- 36
Industry mix (Fortune 500 HQ in FL)
| Industry | F500 HQs | Revenue |
|---|---|---|
| Industrial Technology | 2 | $29B |
|
||
| Insurance | 2 | $17B |
|
||
| Retail | 1 | $60B |
|
||
| Technology Distribution | 1 | $58B |
|
||
| Homebuilding | 1 | $35B |
|
||
| Technology Manufacturing | 1 | $35B |
|
||
Price history
+107.4% since first listed19 events — show timeline
- 2026-03-30 Pending — Stellar MLS as Distributed by MLS Grid
- 2026-03-25 Price Changed $145,000 Stellar MLS as Distributed by MLS Grid
- 2026-03-24 Relisted — Stellar MLS as Distributed by MLS Grid
- 2026-03-23 Listing Removed — Stellar MLS as Distributed by MLS Grid
- 2026-03-20 Relisted — Stellar MLS as Distributed by MLS Grid
- 2026-01-03 Pending — Stellar MLS as Distributed by MLS Grid
- 2025-12-29 Listed $160,000 Stellar MLS as Distributed by MLS Grid
- 2025-12-23 Listing Removed — Stellar MLS as Distributed by MLS Grid
- 2025-11-25 Price Changed $160,000 Stellar MLS as Distributed by MLS Grid
- 2025-09-23 Listed $185,000 Stellar MLS as Distributed by MLS Grid
- 2025-08-11 Listing Removed — Stellar MLS as Distributed by MLS Grid
- 2024-08-26 Price Changed $171,000 Stellar MLS as Distributed by MLS Grid
- 2024-05-23 Listed $121,260 Stellar MLS as Distributed by MLS Grid
- 2019-07-26 Sold (Public Records) $167,000 Public Records
- 2019-07-16 Sold (MLS) $167,000 Stellar MLS as Distributed by MLS Grid
- 2019-03-21 Listed $163,900 Stellar MLS as Distributed by MLS Grid
- 2016-12-21 Sold (Public Records) $60,000 Public Records
- 2016-12-14 Sold (MLS) $60,000 Stellar MLS as Distributed by MLS Grid
- 2016-10-05 Listed $69,900 Stellar MLS as Distributed by MLS Grid
Property tax history
+13.2%/yrLatest (2025): $3,256 · +1.3% YoY. Source: county tax records.
Cash-flow waterfall
monthlySold comps — $/sqft
last 12 mo · ≤1 miLoading sold comps…