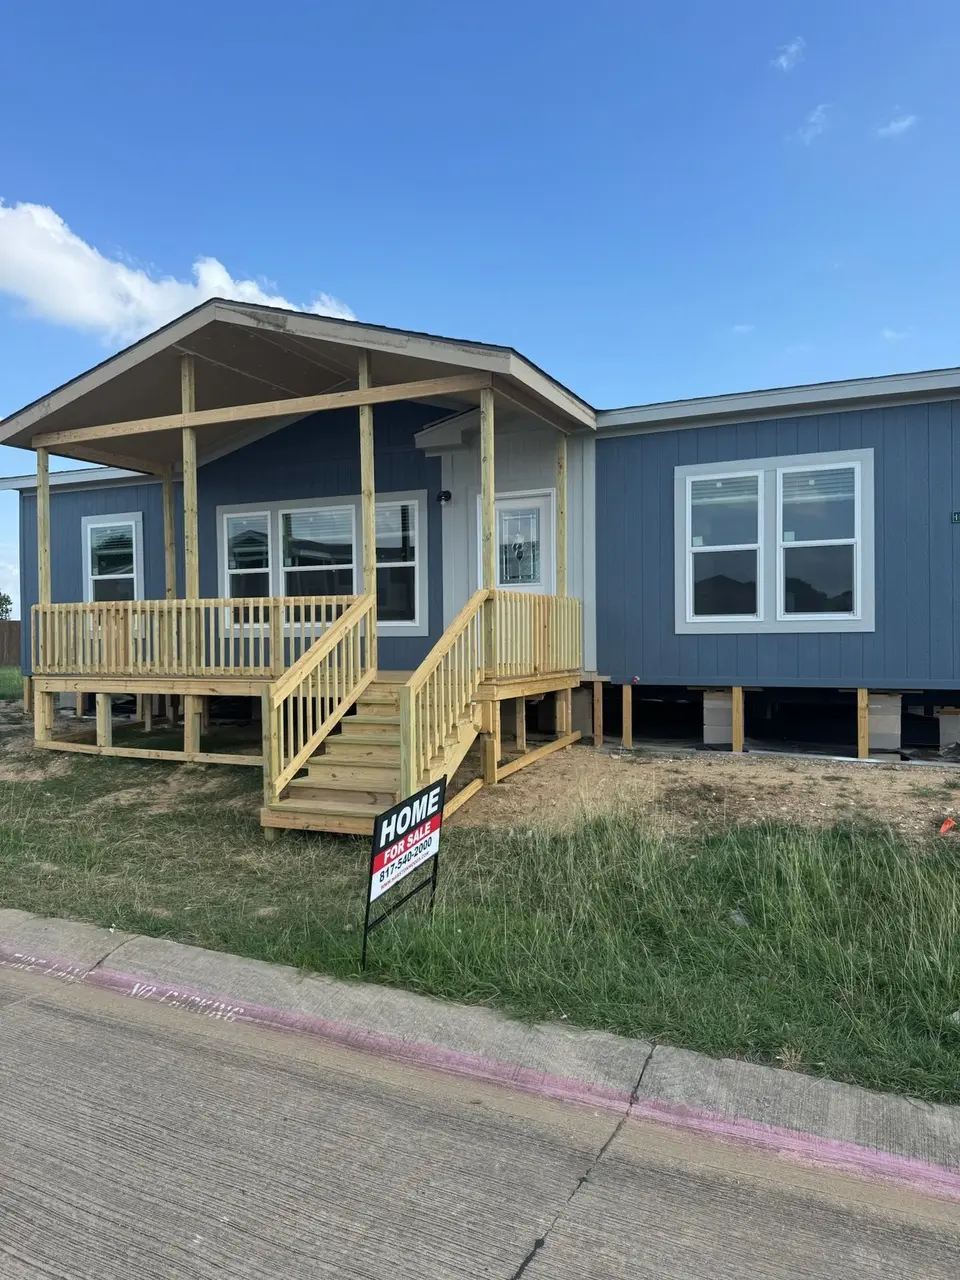
11212 Harston Wood Dr · Fort Worth, TX
Flood risk 1/10 · Minimal
- FEMA flood zone
- X (unshaded)
- Chance of flooding over 30 yrs
- 0.0%
- Est. flood insurance / yr
- $507 – $1,088
Fire risk 3/10 · Minor
- Est. fire insurance / yr
- $1,222 – $2,270
Heat risk 8/10 · Major
- Hot days now (above 109°F)
- 7 days/yr
- Hot days in 30 yrs
- 25 days/yr
Wind risk 6/10 · Moderate
- Chance of severe wind over 30 yrs
- 27.0%
Air-quality risk 3/10 · Minor
- Unhealthy air days now
- 2 days/yr
- Unhealthy air days in 30 yrs
- 3 days/yr
Risk factors via First Street. Map © Google.
Why this score? — see what drove the C grade
The composite is a weighted blend of 9 inputs, each scored 0–100. Each bar is that input's sub-score; the figure is the points it added to the 100-point composite (weight × sub-score).
- Cash flow +16.3/30.0
- ARV discount +15.0/15.0
- DSCR +5.0/10.0
- Condition / age +5.0/5.0
- 1% rule +4.4/10.0
- Schools +4.2/10.0
- Livability +4.0/5.0
- Rent growth +2.9/5.0
- Appreciation +0.0/10.0
$165,000
🖨 Deal sheet (PDF) 📄 Offer letter ✓ Due diligence
Listing remarks MLS
Desirable Harston Woods neighborhood with exemplary schools. Very tranquil neighborhood with lots of amenities. This home features a fireplace, built-ins and amazing kitchen which is the heart of the home. Home also has a pampered bath. Welcome home!
Key facts
- Exemplary schools
- Amazing kitchen
- Fireplace
Tags
Neighborhood map
What this means for you Summary
Snapshot
- This is a 2-bed/2.0-bath single-family listed at $165k. Condition is rated excellent.
Deal economics
- At list price, monthly cash flow is $90 ($1k/yr) — positive.
- The deal already cash-flows at list — no discount required.
- To meet the 1% rule (rent ≥ 1% of price), the offer needs to be $156k (5.6% below list).
- Recommended offer: $145k (12.0% below list) — sets the bar for market timing.
- Cap rate 6.9% vs local median 3.9% in Fort Worth — top-decile yield for the area; either an underpriced asset or a hidden risk that comps aren't pricing in. Stress-test before assuming the spread holds.
Location & tenants
- Location reads 80/100 on livability (#49 in TX, #1,954 nationally) — a professional / high-income tenant draw. Strengths: amenities A+, cost of living A+, housing A+; Watch: schools D+, crime F.
- Hurst-Euless-Bedford ISD (suburban): math 47% / reading 50% proficiency, ranked #193 of 826 in TX (top 23%) — families likely to look elsewhere, expect single-tenant / working-renter base with shorter leases.
- Market conditions: Rents rising (+1.6%/yr); 85 active listings in the ZIP; 26 comparable units currently listed for rent nearby; rentals at typical pace (median 23d on market — plan ~3-4 weeks tenant-placement turnaround); 18,938 units permitted in Tarrant County in 2024 (8,336 in 5+ unit buildings).
Forward outlook
- Local home prices are declining (-3.0%/yr); year-one equity from $1k of loan paydown is wiped out by about $5k of value loss. Plan a longer hold.
- Tarrant County population projected at +41% by 2050 — long-run rental-demand tailwind backs the buy-and-hold thesis.
Negotiation context
- It's been on market 362 days — a 12% lower offer ($145k) is reasonable based on typical stale-listing flexibility.
Risks & watch-outs
- Climate carrying-cost: major wind risk, 27% chance of damaging wind over 30y; extreme-heat days projected 7→25/yr by 2055 (HVAC capex compounding) — expect insurance premiums to compound above CPI over the hold.
Questions for the listing agent
- It's been on market 362 days. Have you received any prior offers? Is the seller open to a 12% concession, seller financing, or rate buy-down credit?
- Why hasn't it sold? Are there any deal-killer items the seller is aware of (foundation, flood, title, zoning, code violations)?
- Is there a deadline driving the sale (1031 exchange, divorce, estate, relocation)? That informs how much negotiation room exists.
- Schools are D-rated, which usually means shorter tenancies and higher turnover. Who's the typical renter profile here, and what's been the actual vacancy rate?
- Crime grade is F in this area — have there been break-ins, vandalism, or insurance claims at this property in the last 3 years? What carrier currently insures it and at what premium?
- What's the average days-on-market for RENTAL listings here right now (not sales)? A rising rental-DOM trend means longer vacancies and softer asking-rent achievability than the comps imply.
- What's the recent tenant-quality profile in this submarket — average credit score on applications, eviction rate, late-payment / NSF rate, and stable-employment percentage? A property-management company in the area should have these aggregated.
- How much new for-sale + rental construction is in the pipeline within 1–3 miles? Heavy new supply typically softens prices + rents 12–24 months out; constrained supply supports both.
Investment metrics
- 1% rule
- 0.94% ✗
- Cap rate
- 6.95%
- Cash-on-cash
- 2.34%
- DSCR
- 1.10
- GRM
- 8.8
CMA / ARV
- ARV (median comp)
- $250,794
- List price
- $165,000
- Delta
- -34.21%
- Verdict
- UNDERPRICED
- Comps
- 3 within 1.0 mi
Show comp detail 1 sale within ~0.75 mi
| Address | Dist | Beds/Ba | Sqft | Sold | Price | $/sf | Match |
|---|---|---|---|---|---|---|---|
| 3515 Garrett Rd | 0.56mi | 3/1.5 (+1) | 1,144 (-2%) | 14mo | $242,500 | $212 | 52 |
Match score weights: distance 35% · size 25% · config 20% · recency 20%. Top-matched comps best support the ARV.
Projected returns pro-forma
-3.0% appreciation · 1.62% rent growth · sell at horizon
- IRR
- -14.1%
- Equity multiple
- 0.50×
- Total profit
- $-23,102
- Equity at exit
- $24,602
- IRR
- -7.7%
- Equity multiple
- 0.54×
- Total profit
- $-21,137
- Equity at exit
- $14,266
Cash invested: $46,200 (down + closing). Projections, not guarantees.
Landlord ↔ Tenant lean methodology
- Overall (STATE)
- 87 Strongly Landlord-Friendly
- State Texas
- 87 Strongly Landlord-Friendly · R+5
- County
- — inherits STATE
- City
- — inherits STATE
ZIP-level market 76040
- Home prices YoY
- -23.6%
- Rents YoY
- 1.6%
- Active inventory
- 85
- Price-to-rent
- 8.8×
Monthly cashflow live
- Estimated rent
- $1,558 high interval (Pro) →
- Mortgage (P&I)
- −$865
- Tax est. 1.5%
- −$206 /mo · $2,475/yr
- Insurance
- −$69
- HOA
- −$0
- Vacancy / Maint / Mgmt
- −$327
- Net cashflow
- $90
Break-even live
Sensitivity live
| Price | -10% $204 | -5% $147 | +0% $90 | +5% $33 | +10% $-24 |
|---|---|---|---|---|---|
| Rent | -10% $-33 | -5% $29 | +0% $90 | +5% $152 | +10% $213 |
| Rate | -1.0pp $173 | -0.5pp $132 | base $90 | +0.5pp $47 | +1.0pp $4 |
UW: 25.0% down · 7.5% · 30yr · 1.5% tax · 5.0% vac · 8.0% maint · 8.0% mgmt
Financing live
Cash to close
- Down payment
- $41,250
- Closing costs
- $4,950
- Reserves months
- —
- Total cash needed
- —
Loan-product check · same deal, 3 products live
Conventional
25% down · 7.5% · 30yr
- Down + closing
- —
- Monthly P&I
- —
- Monthly cashflow
- —
- DSCR
- —
- Eligible?
- —
Personal DTI + credit; lowest rate.
DSCR
20% down · 8.5% · 30yr
- Down + closing
- —
- Monthly P&I
- —
- Monthly cashflow
- —
- DSCR
- —
- Eligible?
- —
No personal income docs; deal must DSCR.
Hard money
10% down · 12.0% · 12mo
- Down + closing
- —
- Monthly P&I
- —
- Monthly cashflow
- —
- DSCR
- —
- Eligible?
- —
Short-term bridge; refi at stabilization.
Rent comps 26 comps
| Address | Beds | Baths | Sqft | Rent | $/sqft | DOM | Units | Dist |
|---|---|---|---|---|---|---|---|---|
| 11450 Trinity Blvd Euless, TX | 1.0–2.0 | 1.0–2.0 | 1032 | $2,480 | $2.40 | 2d | 98 | 0.59mi |
| 3475 Valley Vista Dr Fort Worth, TX | 3.0 | 2.0 | 1500 | $2,095 | $1.40 | 44d | 1 | 0.91mi |
| 3475 Valley Vista Dr Fort Worth, TX | 3.0 | 2.0 | 1500 | $1,995 | $1.33 | 25d | 1 | 0.91mi |
| 3601 Valley Vista Dr Unit 3625-601 Hurst, TX | 2.0 | 2.5 | 1350 | $1,650 | $1.22 | 25d | 1 | 1.02mi |
| 3625 Valley Vista Dr Unit 601 Hurst, TX | 2.0 | 2.5 | 1350 | $1,650 | $1.22 | 25d | 1 | 1.02mi |
| 1601 Sotogrande Blvd Hurst, TX | 3.0 | 1.0–2.0 | 1061 | $1,717 | $1.62 | 2d | 227 | 1.03mi |
| 1304 Raider Dr Euless, TX | 1.0–3.0 | 1.0–2.0 | 835 | $1,382 | $1.65 | 2d | 16 | 1.10mi |
| 1700 Sotogrande Blvd Hurst, TX | 3.0 | 2.0 | 1321 | $2,229 | $1.69 | 8d | 1 | 1.14mi |
| 1700 Sotogrande Blvd Hurst, TX | 2.0 | 2.0 | 1080 | $1,580 | $1.46 | 5d | 1 | 1.14mi |
| 1700 Sotogrande Blvd Hurst, TX | 2.0 | 2.0 | 1080 | $1,339 | $1.24 | 25d | 1 | 1.14mi |
| 1700 Sotogrande Blvd Hurst, TX | 1.0 | 1.0 | 997 | $1,415 | $1.42 | 22d | 1 | 1.14mi |
| 1700 Sotogrande Blvd Hurst, TX | 1.0 | 2.0 | 1008 | $1,267 | $1.26 | 3d | 1 | 1.14mi |
| 1736 Sotogrande Blvd Unit 3121 Hurst, TX | 3.0 | 2.0 | 1286 | $1,657 | $1.29 | 3d | 1 | 1.21mi |
| 1736 Sotogrande Blvd Unit 1757 Hurst, TX | 1.0 | 1.0 | 888 | $785 | $0.88 | 3d | 1 | 1.21mi |
| 1736 Sotogrande Blvd Unit 1769 Hurst, TX | 3.0 | 2.0 | 1248 | $1,718 | $1.38 | 44d | 1 | 1.21mi |
| 1736 Sotogrande Blvd Unit 511 Hurst, TX | 2.0 | 2.0 | 1050 | $1,075 | $1.02 | 44d | 1 | 1.21mi |
| 1736 Sotogrande Blvd Unit 1787 Hurst, TX | 1.0 | 1.0 | 751 | $900 | $1.20 | 44d | 1 | 1.21mi |
| 1736 Sotogrande Blvd Unit 2121 Hurst, TX | 2.0 | 2.0 | 934 | $1,016 | $1.09 | 17d | 1 | 1.21mi |
| 1736 Sotogrande Blvd Unit 1793 Hurst, TX | 2.0 | 2.0 | 810 | $1,073 | $1.32 | 3d | 1 | 1.21mi |
| 1736 Sotogrande Blvd Hurst, TX | 1.0 | 1.0 | 888 | $777 | $0.88 | 13d | 1 | 1.21mi |
| 1401 Sotogrande Blvd Euless, TX | 3.0 | 2.0 | 1286 | $2,089 | $1.62 | 4d | 1 | 1.29mi |
| 1401 Sotogrande Blvd Euless, TX | 2.0 | 2.0 | 1180 | $1,711 | $1.45 | 44d | 1 | 1.29mi |
| 1401 Sotogrande Blvd Euless, TX | 3.0 | 2.0 | 1248 | $2,246 | $1.80 | 25d | 1 | 1.29mi |
| 1401 Sotogrande Blvd Euless, TX | 1.0 | 1.0 | 913 | $1,397 | $1.53 | 21d | 1 | 1.29mi |
| 805 Central Dr Bedford, TX | 1.0–2.0 | 1.0–2.0 | 795 | $1,420 | $1.79 | 44d | 6 | 1.37mi |
| 10150 E Hurst Blvd Hurst, TX | 3.0 | 1.0–2.0 | 917 | $1,849 | $2.02 | 44d | 9 | 1.46mi |
Listing history 4 events
-
2026-06-01days on market $165,000 Active 362 DOM
-
2026-05-31days on market $165,000 Active 361 DOM
-
2025-10-02price $165,000 250-char remark
Show marketing remark (250 chars)
Desirable Harston Woods neighborhood with exemplary schools. Very tranquil neighborhood with lots of amenities. This home features a fireplace, built-ins and amazing kitchen which is the heart of the home. Home also has a pampered bath. Welcome home!
-
2025-06-04$175,000 Active 250-char remark
Show marketing remark (250 chars)
Desirable Harston Woods neighborhood with exemplary schools. Very tranquil neighborhood with lots of amenities. This home features a fireplace, built-ins and amazing kitchen which is the heart of the home. Home also has a pampered bath. Welcome home!
ⓘ Source: listings_history table (triggers on properties + properties_extension) + one-shot
backfill from property_details.listing_events for pre-trigger history.
Climate risk First Street
- Flood 1/10 Low FEMA zone X (unshaded) · 0% chance over 30 yrs
- Wildfire 3/10 Moderate
- Heat 8/10 Severe 7 d/yr ≥109°F today · 25 d/yr by 30 yrs out
- Wind 6/10 Major 27% chance of damaging wind over 30 yrs
- Air quality 3/10 Moderate 2 unhealthy d/yr today · 3 by 30 yrs out
Nearby sold comps map
Loading sold comps map…
Walkable amenities ~0.75 mi
Loading nearby amenities…
Taxation est. · year 1
- Rental income
- $18,691
- − Mortgage interest
- −$9,243
- − Property taxes
- −$2,475
- − Insurance
- −$825
- − Repairs & maintenance
- −$1,495
- − Management
- −$1,495
- − Depreciation
- −$4,800
- Taxable loss
- −$1,642
- Est. tax savings @ 24.0%
- +$394
- After-tax cash flow
- $1,477/yr
For passive investors: Depreciation is non-cash, so a rental often shows a tax loss while cash-flowing — sheltering income. Rental losses are passive: they offset passive income freely, and up to $25,000/yr can offset ordinary (W-2) income if you actively participate and your MAGI is under $100k (phasing out to $0 by $150k); unused losses carry forward. On sale, claimed depreciation is recaptured at up to 25%, and gains may owe capital-gains tax (a 1031 exchange can defer both). Figures are a year-1 estimate at your 24.0% rate — not tax advice; consult a CPA.
Condition & rehab AI · 9 photos
This home is in excellent condition with modern finishes and a desirable location. It is move-in ready and would benefit from minor updates to enhance its curb appeal and attract potential buyers/tenants.
Value-add opportunities
- Both Painting the exterior and interior walls — Fresh paint can enhance curb appeal and interior aesthetics.
- Both Landscaping the front yard — A well-maintained front yard can improve curb appeal and attract potential buyers/tenants.
- Both Adding a small outdoor seating area — This can increase the home's appeal for both buyers and renters, especially in a desirable neighborhood like Harston Woods.
Renovation cost estimate screening
Value-add ROI direction
- Both Painting the exterior and interior walls — Fresh paint can enhance curb appeal and interior aesthetics. ↑
- Both Landscaping the front yard — A well-maintained front yard can improve curb appeal and attract potential buyers/tenants. ↑
- Both Adding a small outdoor seating area — This can increase the home's appeal for both buyers and renters, especially in a desirable neighborhood like Harston Woods. ↑
ⓘ Cost ranges are severity-bucket heuristics (US national rule-of-thumb). Get contractor quotes + a written scope before underwriting a rehab budget.
Schools (NCES district)
- District
- Hurst-Euless-Bedford ISD
- NCES district ID
- 4824060
- Math proficiency
- 47% ▼ -15.00%
- Reading proficiency
- 50% ▼ -5.00%
- Median HH income
- $56,086
- Composite
- 42.12/100
- National rank
- #3316
- State rank
- #193 of 826 in TX
Livability — Fort Worth
- Score
- 80/100
- State rank
- #49
- US rank
- #1954
Category grades
Schools grade is shown separately in the Schools card above.
Census & demographics
- Census place
- Fort Worth, TX
- County
- Tarrant County · 2,033,669 people
- City population
- 911,619
- Metro
- Dallas-Fort Worth-Arlington, TX
- Population (ZIP)
- 31,677
- Household income
- $72,661
- Rent vs Own
- Severe rent burden
- 1361.0
Population outlook (Tarrant County) Hauer SSP2
- Today (2025)
- 2,380,417 people
- By 2030
- 2,578,900 · +8.3%
- By 2040
- 2,974,995 · +25.0%
- By 2050
- 3,350,489 · +40.8%
- By 2075
- 4,216,909 · +77.2%
- By 2100
- 4,741,527 · +99.2%
Race, ethnicity, and origin ACS 2023
- Neighborhood character
- Highly diverse neighborhood (Simpson 0.78)
- Race & ethnicity
- White 31% Black 24% Hispanic / Latino 22% Two or more races 16% Asian 14% Pacific Islander 2%
- Hispanic origin (detail)
- Mexican 16% Puerto Rican 2%
- Common ancestry
- Italian 1% Serbian 1% Lithuanian 1%
- Foreign-born
- 27% · Canada, Vietnam, China
- Languages at home
- 59% English-only · Spanish 16% Other Indo-European 8% Other Asian/Pacific 4%
Political lean MEDSL · Tarrant
- 2024 margin
- Lean R (+5.1) · D 46.7% · R 51.9% · Other 1.4%
- 2008→2024 swing
- +6.6pp toward D · 2008: -11.7pp · 2024: -5.1pp
- All cycles
- 2024: R+5.1 2020: D+0.2 2016: R+8.7 2012: R+15.7 2008: R+11.7
Not yet ingested
- Civics
- —
Market trends
- HPI YoY
- ▼ -83.82%
- Current HPI
- 271.7474
- Rent YoY
- ▲ 1.62%
- Metro
- Dallas-Fort Worth-Arlington, TX
- State GDP YoY
- ▲ 3.95%
- F500 in state
- 110
Industry mix (Fortune 500 HQ in TX)
| Industry | F500 HQs | Revenue |
|---|---|---|
| Energy | 16 | $1,198B |
|
||
| Technology | 5 | $198B |
|
||
| Engineering / Construction | 4 | $72B |
|
||
| Energy Services | 3 | $60B |
|
||
| Utilities | 3 | $41B |
|
||
| Healthcare | 2 | $330B |
|
||
Price history
-5.7% since first listed2 events — show timeline
- 2025-10-02 Price Changed $165,000 Zillow
- 2025-06-04 Listed $175,000 Zillow
Cash-flow waterfall
monthlySold comps — $/sqft
last 12 mo · ≤1 miLoading sold comps…