1043 St. Martin St · Georgetown, SC
Flood risk No data
- FEMA flood zone
- —
- Chance of flooding over 30 yrs
- —
- Est. flood insurance / yr
- —
Fire risk No data
- Est. fire insurance / yr
- —
Heat risk No data
- Hot days now (above threshold)
- —
- Hot days in 30 yrs
- —
Wind risk No data
- Chance of severe wind over 30 yrs
- —
Air-quality risk No data
- Unhealthy air days now
- —
- Unhealthy air days in 30 yrs
- —
Risk factors via First Street. Map © Google.
Why this score? — see what drove the B- grade
The composite is a weighted blend of 9 inputs, each scored 0–100. Each bar is that input's sub-score; the figure is the points it added to the 100-point composite (weight × sub-score).
- Cash flow +25.0/30.0
- ARV discount +15.0/15.0
- DSCR +8.1/10.0
- 1% rule +6.8/10.0
- Condition / age +4.0/5.0
- Livability +3.2/5.0
- Schools +2.7/10.0
- Rent growth +2.5/5.0
- Appreciation +0.0/10.0
$339,498
🖨 Deal sheet 📄 Offer letter ✓ Due diligence
Listing remarks
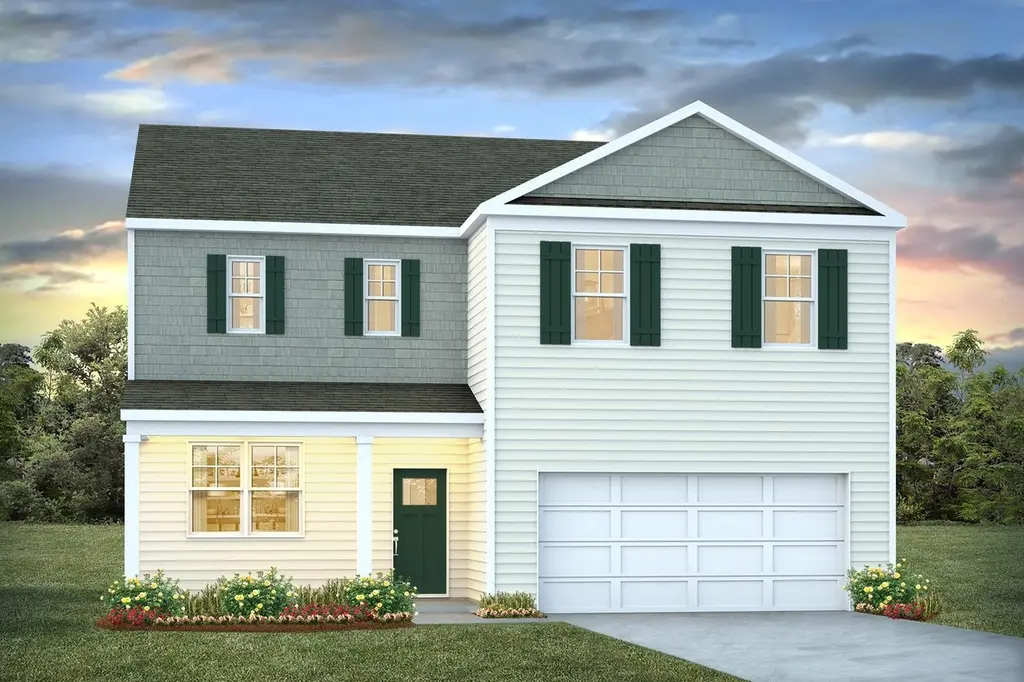
The Galen floor plan, a spacious and stylish two story home perfect for modern living. The first floor features a bright and airy, open concept layout that seamlessly connects the great room, dining area, and gourmet kitchen which is perfect for entertaining or everyday living. The kitchen comes complete with a center island, granite countertops, a tile backsplash, a corner walk in pantry, 36" cabinets and stainless steel appliances with refrigerator and a gas range! A large flex room at the entry offers versatile space ideal for a home office or formal dining room. A second floor owner's suite is grand with massive closets and a private bathroom that features double sinks, a 5' walk-
Key facts
- Gourmet kitchen
- Granite countertops
- Open concept layout
Tags
Property features AI
Finance
- Financial info: List price $339,498
Exterior
- Parking: 2 total parking spaces; 2-car garage
- Home design: Single-family residence (spec-built); Plan name: GALEN
- Exterior features: Living area approximately 2340
Interior
- Bedrooms: 4 bedrooms
- Bathrooms: 2 full bathrooms, 1 half bathroom
- Interior features: Spec home (GALEN plan); Active listing
Neighborhood map
What this means for you Summary
Snapshot
- This is a 4-bed/2.5-bath single-family listed at $339k. Condition is rated good.
Deal economics
- At list price, monthly cash flow is $737 ($9k/yr) — positive.
- The deal already cash-flows at list — no discount required.
- Meets the 1% rule at list price ($4k rent vs $339k).
- Recommended offer: $334k (1.5% below list) — sets the bar for market timing.
- Cap rate 8.9% vs local median 4.7% in Georgetown — top-decile yield for the area; either an underpriced asset or a hidden risk that comps aren't pricing in. Stress-test before assuming the spread holds.
Location & tenants
- Location reads 65/100 on livability (#141 in SC) — a middle-class / working-renter tenant base. Strengths: cost of living A+, housing A+, health & safety A+; Watch: amenities D, schools F, crime F.
- Georgetown 01 (town): math 26% / reading 38% proficiency, ranked #51 of 80 in SC (top 64%) — families likely to look elsewhere, expect single-tenant / working-renter base with shorter leases.
- Market conditions: 409 active listings in the ZIP; 1 comparable units currently listed for rent nearby; 323 units permitted in Georgetown County in 2024 (0 in 5+ unit buildings).
Forward outlook
- Local home prices are declining (-3.0%/yr); year-one equity from $2k of loan paydown is wiped out by about $10k of value loss. Plan a longer hold.
Negotiation context
- It's been on market 23 days — a 2% lower offer ($334k) is reasonable based on typical stale-listing flexibility.
Questions for the listing agent
- What does the HOA fee cover, when was the last increase, and are there any pending special assessments or reserve-fund shortfalls?
- Is there a deadline driving the sale (1031 exchange, divorce, estate, relocation)? That informs how much negotiation room exists.
- Schools are F-rated, which usually means shorter tenancies and higher turnover. Who's the typical renter profile here, and what's been the actual vacancy rate?
- Crime grade is F in this area — have there been break-ins, vandalism, or insurance claims at this property in the last 3 years? What carrier currently insures it and at what premium?
- What's the average days-on-market for RENTAL listings here right now (not sales)? A rising rental-DOM trend means longer vacancies and softer asking-rent achievability than the comps imply.
- What's the recent tenant-quality profile in this submarket — average credit score on applications, eviction rate, late-payment / NSF rate, and stable-employment percentage? A property-management company in the area should have these aggregated.
- How much new for-sale + rental construction is in the pipeline within 1–3 miles? Heavy new supply typically softens prices + rents 12–24 months out; constrained supply supports both.
Investment metrics
- 1% rule
- 1.18% ✓
- Cap rate
- 8.90%
- Cash-on-cash
- 9.30%
- DSCR
- 1.41
- GRM
- 7.1
CMA / ARV
- ARV (on-the-fly)
- $439,920
- Comps found
- 5
Show comp detail 5 sales within ~0.75 mi
| Address | Dist | Beds/Ba | Sqft | Sold | Price | $/sf | Match |
|---|---|---|---|---|---|---|---|
| 1015 St. Martin St | 0.14mi | 4/2.5 | 2,203 (-6%) | 2mo | $325,990 | $148 | 82 |
| 2612 Lot 1 Poplar Plan Old Charleston Rd | 0.56mi | 4/3.0 | 2,155 (-8%) | 10mo | $421,500 | $196 | 50 |
| 3011 Harbor Club On Winyah Bay South Bay St | 0.70mi | 4/3.0 | 2,206 (-6%) | 20mo | $415,000 | $188 | 39 |
| 2622 Lot 4 Sullivan Plan Old Charleston Rd | 0.57mi | 3/2.0 (-1) | 2,154 (-8%) | 20mo | $421,840 | $196 | 36 |
| 620 Winnow Way | 0.73mi | 4/3.0 | 2,110 (-10%) | 23mo | $369,000 | $175 | 28 |
Match score weights: distance 35% · size 25% · config 20% · recency 20%. Top-matched comps best support the ARV.
Projected returns pro-forma
-3.0% appreciation · 3.0% rent growth · sell at horizon
- IRR
- -2.2%
- Equity multiple
- 0.92×
- Total profit
- $-7,978
- Equity at exit
- $50,620
- IRR
- 7.5%
- Equity multiple
- 1.57×
- Total profit
- $53,917
- Equity at exit
- $29,354
Cash invested: $95,059 (down + closing). Projections, not guarantees.
Landlord ↔ Tenant lean methodology
- Overall (STATE)
- 90 Strongly Landlord-Friendly
- State South Carolina
- 90 Strongly Landlord-Friendly · R+6
- County
- — inherits STATE
- City
- — inherits STATE
ZIP-level market 29440
- Home prices YoY
- -34.9%
- Active inventory
- 409
- Price-to-rent
- 7.1×
Monthly cashflow live
- Estimated rent
- $4,000 medium interval (Pro) →
- Mortgage (P&I)
- −$1,780
- Tax est. 1.5%
- −$424 /mo · $5,092/yr
- Insurance
- −$141
- HOA
- −$77
- Vacancy / Maint / Mgmt
- −$840
- Net cashflow
- $737
Break-even live
UW: 25.0% down · 7.5% · 30yr · 1.5% tax · 5.0% vac · 8.0% maint · 8.0% mgmt
Financing live
Cash to close
- Down payment
- $84,874
- Closing costs
- $10,185
- Reserves months
- —
- Total cash needed
- —
Loan-product check · same deal, 3 products live
Conventional
25% down · 7.5% · 30yr
- Down + closing
- —
- Monthly P&I
- —
- Monthly cashflow
- —
- DSCR
- —
- Eligible?
- —
Personal DTI + credit; lowest rate.
DSCR
20% down · 8.5% · 30yr
- Down + closing
- —
- Monthly P&I
- —
- Monthly cashflow
- —
- DSCR
- —
- Eligible?
- —
No personal income docs; deal must DSCR.
Hard money
10% down · 12.0% · 12mo
- Down + closing
- —
- Monthly P&I
- —
- Monthly cashflow
- —
- DSCR
- —
- Eligible?
- —
Short-term bridge; refi at stabilization.
Rent comps 1 comps
| Address | Beds | Baths | Sqft | Rent | $/sqft | DOM | Units | Dist |
|---|---|---|---|---|---|---|---|---|
| 409 Rosebank Rd Georgetown, SC | 4.0 | 3.5 | 2300 | $4,000 | $1.74 | 23d | 1 | 1.33mi |
HOA detail
- Monthly dues
- $77 · $924/yr
- Likely covers
- gas
Listing history 14 events
-
2026-06-18days on market $339,498 Active 23 DOM
-
2026-06-17days on market $339,498 Active 22 DOM
-
2026-06-16days on market $339,498 Active 21 DOM
-
2026-06-15days on market $339,498 Active 20 DOM
-
2026-06-14days on market $339,498 Active 18 DOM
-
2026-06-10days on market $339,498 Active 15 DOM
-
2026-06-09days on market $339,498 Active 14 DOM
-
2026-06-08days on market $339,498 Active 13 DOM
-
2026-06-07days on market $339,498 Active 12 DOM
-
2026-06-03days on market $339,498 Active 8 DOM
-
2026-06-02days on market $339,498 Active 7 DOM
-
2026-06-01days on market $339,498 Active 6 DOM
-
2026-05-31days on market $339,498 Active 5 DOM
-
2026-05-30days on market $339,498 Active 4 DOM
ⓘ Source: listings_history table (triggers on properties + properties_extension) + one-shot
backfill from property_details.listing_events for pre-trigger history.
Nearby sold comps map
Loading sold comps map…
Walkable amenities ~0.75 mi
Loading nearby amenities…
Taxation est. · year 1
- Rental income
- $48,000
- − Mortgage interest
- −$19,017
- − Property taxes
- −$5,092
- − Insurance
- −$1,697
- − Repairs & maintenance
- −$3,840
- − Management
- −$3,840
- − HOA
- −$924
- − Depreciation
- −$9,876
- Taxable income
- $3,713
- Est. tax owed @ 24.0%
- −$891
- After-tax cash flow
- $7,951/yr
For passive investors: Depreciation is non-cash, so a rental often shows a tax loss while cash-flowing — sheltering income. Rental losses are passive: they offset passive income freely, and up to $25,000/yr can offset ordinary (W-2) income if you actively participate and your MAGI is under $100k (phasing out to $0 by $150k); unused losses carry forward. On sale, claimed depreciation is recaptured at up to 25%, and gains may owe capital-gains tax (a 1031 exchange can defer both). Figures are a year-1 estimate at your 24.0% rate — not tax advice; consult a CPA.
Condition & rehab AI · 12 photos
This home is in excellent condition with a good condition score of 80. It is move-in ready with no visible repairs or maintenance needed. The highest-ROI updates would be painting the exterior siding and landscaping the front yard to enhance curb appeal and increase its resale value.
Value-add opportunities
- Resale Painting exterior siding — Enhances curb appeal
- Resale Landscaping front yard — Improves curb appeal
- Both Replace light fixtures — Enhances curb appeal and interior ambiance
Renovation cost estimate screening
Value-add ROI direction
- Resale Painting exterior siding — Enhances curb appeal ↑
- Resale Landscaping front yard — Improves curb appeal ↑
- Both Replace light fixtures — Enhances curb appeal and interior ambiance ↑
ⓘ Cost ranges are severity-bucket heuristics (US national rule-of-thumb). Get contractor quotes + a written scope before underwriting a rehab budget.
Schools (NCES district)
- District
- Georgetown 01
- NCES district ID
- 4502280
- Math proficiency
- 26% ▼ -11.00%
- Reading proficiency
- 38% ▼ -5.00%
- Median HH income
- $43,045
- Composite
- 27.15/100
- National rank
- #7030
- State rank
- #51 of 80 in SC
Livability — Georgetown
- Score
- 65/100
- State rank
- #141
- US rank
- #13446
Category grades
Schools grade is shown separately in the Schools card above.
Census & demographics
- Census place
- Georgetown, SC
- Population (ZIP)
- 26,419
Population outlook (Georgetown County) Hauer SSP2
- Today (2025)
- 63,275 people
- By 2030
- 63,630 · +0.6%
- By 2040
- 63,130 · -0.2%
- By 2050
- 61,904 · -2.2%
- By 2075
- 59,305 · -6.3%
- By 2100
- 53,852 · -14.9%
Race, ethnicity, and origin ACS 2023
- Neighborhood character
- Majority White (52%)
- Race & ethnicity
- White 52% Black 45% Hispanic / Latino 2%
- Common ancestry
- Italian 3% Lithuanian 2% Slovak 1%
- Foreign-born
- 3% · Canada
- Languages at home
- 97% English-only · Spanish 2%
Political lean MEDSL · Georgetown
- 2024 margin
- R (+19.5) · D 39.6% · R 59.1% · Other 1.2%
- 2008→2024 swing
- -14.2pp toward R · 2008: -5.2pp · 2024: -19.5pp
- All cycles
- 2024: R+19.5 2020: R+12.7 2016: R+13.0 2012: R+7.6 2008: R+5.2
Not yet ingested
- Civics
- —
Market trends
- HPI YoY
- ▼ -111.84%
- Current HPI
- 208.6792
- Rent YoY
- —
- Metro
- —
- State GDP YoY
- ▲ 4.51%
- F500 in state
- 2
Industry mix (Fortune 500 HQ in SC)
| Industry | F500 HQs | Revenue |
|---|---|---|
| Packaging | 1 | $7B |
|
||
Cash-flow waterfall
monthlySold comps — $/sqft
last 12 mo · ≤1 miLoading sold comps…