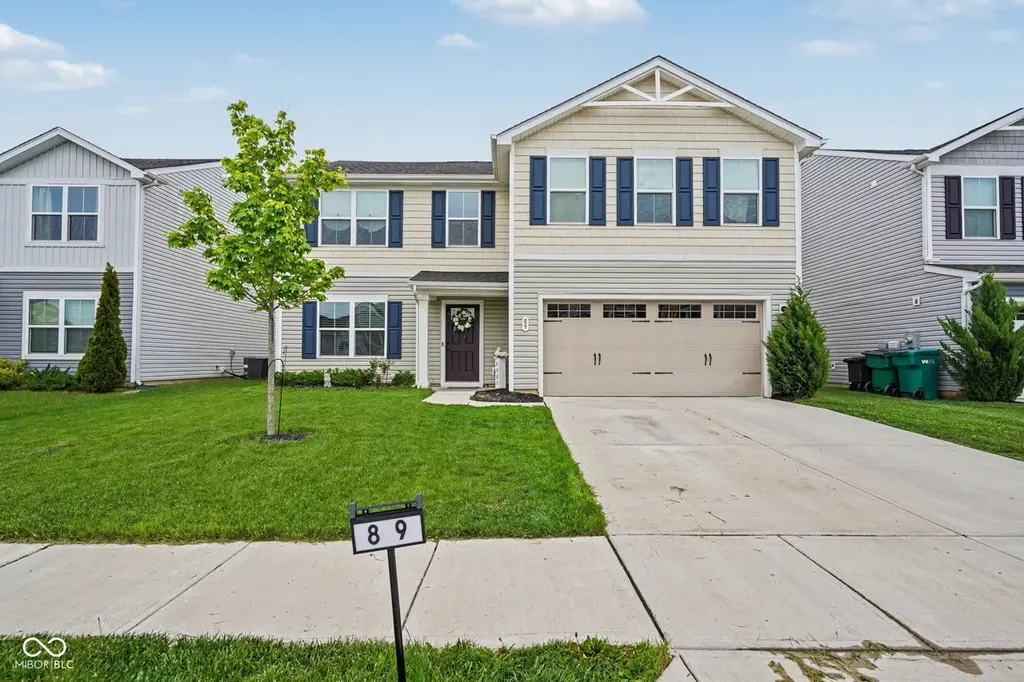
89 N Murray St · Danville, IN
Flood risk 1/10 · Minimal
- FEMA flood zone
- X (unshaded)
- Chance of flooding over 30 yrs
- 0.0%
- Est. flood insurance / yr
- $473 – $860
Fire risk 2/10 · Minimal
- Est. fire insurance / yr
- $717 – $1,331
Heat risk 3/10 · Minor
- Hot days now (above 101°F)
- 7 days/yr
- Hot days in 30 yrs
- 19 days/yr
Wind risk 2/10 · Minimal
- Chance of severe wind over 30 yrs
- 1.0%
Air-quality risk 3/10 · Minor
- Unhealthy air days now
- 2 days/yr
- Unhealthy air days in 30 yrs
- 3 days/yr
Risk factors via First Street. Map © Google.
Why this score? — see what drove the D- grade
The composite is a weighted blend of 9 inputs, each scored 0–100. Each bar is that input's sub-score; the figure is the points it added to the 100-point composite (weight × sub-score).
- Cash flow +11.4/30.0
- ARV discount +7.3/15.0
- Schools +4.8/10.0
- DSCR +3.4/10.0
- Livability +3.2/5.0
- 1% rule +2.7/10.0
- Rent growth +2.5/5.0
- Condition / age +2.5/5.0
- Appreciation +0.0/10.0
$324,000
🖨 Deal sheet 📄 Offer letter ✓ Due diligence
Listing remarks
Welcome home to 89 N Murray St in Danville! Built in 2022 and still feeling just like new, this beautifully maintained home offers the perfect blend of modern style, comfort, and everyday functionality. With over 2,200 square feet of living space, this two-story home features four spacious bedrooms, two full bathrooms, and a convenient half bath, giving everyone room to spread out and feel at home. Whether you're buying your very first home or looking for more space to grow into, this home checks all the boxes. The kitchen is truly the heart of the home, complete with stainless steel appliances, a large center island, and an open layout that makes cooking, gathering, and entertaining easy a
Key facts
- 5,184 sq ft lot
- 2 garage spots
- Built 2022
Property features AI
Finance
- HOA & community: Homeowners association with annual fee ($500/year); HOA amenities include a park, playground, and snow removal
Exterior
- Parking: Attached 2-car garage (approx. 400 sq ft)
- Utilities: Community sewer; Private water
- Home design: Single family residence; Two levels
- Construction: Vinyl siding; Slab foundation
- Exterior features: No fence; Lot under 1/4 acre (0.12 acre)
Interior
- Kitchen: Electric cooktop; Electric oven; Microwave; Dishwasher; Refrigerator; Eat-in kitchen with pantry
- Bedrooms: Four bedrooms on the upper level; Primary bedroom with walk-in closet
- Bathrooms: Two full bathrooms; One half bathroom; Primary bathroom with double sinks
- Heating & cooling: Forced air heating; Central air conditioning
- Interior features: Attic access; Eat-in kitchen; Pantry; Walk-in closet(s)
- Laundry & utility: Washer; Dryer; Laundry located on upper level; Water heater
Neighborhood map
What this means for you Summary
Snapshot
- This is a 4-bed/2.5-bath single-family listed at $324k.
Deal economics
- At list price, monthly cash flow is $-110 ($-1k/yr) — negative.
- To cash-flow at today's rent, offer at most $305k (6.0% below list).
- To meet the 1% rule (rent ≥ 1% of price), the offer needs to be $250k (22.9% below list).
- Recommended offer: $250k (22.9% below list) — sets the bar for 1% rule.
- Cap rate 5.9% vs local median 4.1% in Danville — top-decile yield for the area; either an underpriced asset or a hidden risk that comps aren't pricing in. Stress-test before assuming the spread holds.
Location & tenants
- Location reads 65/100 on livability (#325 in IN) — a middle-class / working-renter tenant base. Strengths: crime A+, employment A+, cost of living A+; Watch: amenities F, commute F, health & safety F.
- Danville Community School Corporation (suburban): math 52% / reading 57% proficiency, ranked #27 of 301 in IN (top 9%) — acceptable for families but not a draw, mixed tenant base, ~2y average lease.
- Zoned schools: Danville Community High School (math 42% / reading 67%, grade C-, #79 of 369 statewide, top 26%, 788 students, 27% FRL).
- Market conditions: 196 active listings in the ZIP; 2 comparable units currently listed for rent nearby; solid renter incomes; 1,294 units permitted in Hendricks County in 2024 (18 in 5+ unit buildings).
- This rent runs 30% of the median local income ($100k/yr) — at the standard rent-burdened threshold; future hikes will face affordability resistance.
Forward outlook
- Local home prices are declining (-3.0%/yr); year-one equity from $2k of loan paydown is wiped out by about $10k of value loss. Plan a longer hold.
- Hendricks County population projected at +35% by 2050 — long-run rental-demand tailwind backs the buy-and-hold thesis.
Negotiation context
- It's been on market 40 days — a 3% lower offer ($314k) is reasonable based on typical stale-listing flexibility.
- Current owner paid $59k; list at $324k implies a 449% gain — meaningful room to come down on a strong offer.
Questions for the listing agent
- What do current leases actually rent for vs. the listed asking? Can we see a recent rent roll and the last 12 months of T-12 income?
- It's been on market 40 days. Have you received any prior offers? Is the seller open to a 23% concession, seller financing, or rate buy-down credit?
- What does the HOA fee cover, when was the last increase, and are there any pending special assessments or reserve-fund shortfalls?
- Is there a deadline driving the sale (1031 exchange, divorce, estate, relocation)? That informs how much negotiation room exists.
- Schools are B-rated — typically a magnet for longer-tenancy family renters. What's the average tenant stay here, and is there a school-zone premium baked into asking?
- The area grade is low — what's the realistic commute time and amenity access for the typical tenant pool here? Any planned neighborhood developments (good or bad) we should know about?
- What's the average days-on-market for RENTAL listings here right now (not sales)? A rising rental-DOM trend means longer vacancies and softer asking-rent achievability than the comps imply.
- What's the recent tenant-quality profile in this submarket — average credit score on applications, eviction rate, late-payment / NSF rate, and stable-employment percentage? A property-management company in the area should have these aggregated.
- How much new for-sale + rental construction is in the pipeline within 1–3 miles? Heavy new supply typically softens prices + rents 12–24 months out; constrained supply supports both.
Investment metrics
- 1% rule
- 0.77% ✗
- Cap rate
- 5.88%
- Cash-on-cash
- -1.46%
- DSCR
- 0.94
- GRM
- 10.8
CMA / ARV
- ARV (median comp)
- $322,640
- List price
- $324,000
- Delta
- 0.42%
- Verdict
- FAIR
- Comps
- 20 within 1.0 mi
Show comp detail 12 sales within ~0.75 mi
| Address | Dist | Beds/Ba | Sqft | Sold | Price | $/sf | Match |
|---|---|---|---|---|---|---|---|
| 197 N Fairfield Dr | 0.24mi | 4/2.5 | 1,900 (-14%) | 1mo | $308,000 | $162 | 66 |
| 3672 Wetherby Pl | 0.43mi | 4/2.5 | 2,024 (-8%) | 2mo | $330,000 | $163 | 65 |
| 3651 Wetherby Pl | 0.40mi | 4/2.5 | 2,011 (-9%) | 3mo | $323,000 | $161 | 65 |
| 3068 E Thorpe St | 0.32mi | 4/2.5 | 1,900 (-14%) | 2mo | $326,000 | $172 | 60 |
| 796 Scarsdale Ln | 0.60mi | 4/2.5 | 2,056 (-6%) | 2mo | $335,000 | $163 | 60 |
| 4235 Pecan Dr | 0.43mi | 3/2.5 (-1) | 2,457 (+12%) | 4mo | $385,000 | $157 | 52 |
| 726 Oxford Ln | 0.50mi | 5/3.0 (+1) | 2,460 (+12%) | 0mo | $333,000 | $135 | 50 |
| 3576 Cosmic Ct | 0.66mi | 5/3.5 (+1) | 2,054 (-7%) | 4mo | $375,000 | $183 | 46 |
| 3022 Essex Dr | 0.63mi | 5/3.0 (+1) | 2,465 (+12%) | 2mo | $355,000 | $144 | 42 |
| 3694 Locust Dr | 0.62mi | 5/3.0 (+1) | 2,484 (+13%) | 1mo | $365,000 | $147 | 42 |
| 3616 Cosmic Ct | 0.66mi | 5/3.0 (+1) | 2,460 (+12%) | 3mo | $360,000 | $146 | 40 |
| 3656 Cosmic Ct | 0.65mi | 5/3.0 (+1) | 2,465 (+12%) | 4mo | $359,185 | $146 | 39 |
Match score weights: distance 35% · size 25% · config 20% · recency 20%. Top-matched comps best support the ARV.
Projected returns pro-forma
-3.0% appreciation · 3.0% rent growth · sell at horizon
- IRR
- -18.7%
- Equity multiple
- 0.34×
- Total profit
- $-59,578
- Equity at exit
- $48,309
- IRR
- -11.2%
- Equity multiple
- 0.33×
- Total profit
- $-61,153
- Equity at exit
- $28,014
Cash invested: $90,720 (down + closing). Projections, not guarantees.
Landlord ↔ Tenant lean methodology
- Overall (STATE)
- 90 Strongly Landlord-Friendly
- State Indiana
- 90 Strongly Landlord-Friendly · R+11
- County
- — inherits STATE
- City
- — inherits STATE
ZIP-level market 46122
- Home prices YoY
- -32.1%
- Active inventory
- 196
- Price-to-rent
- 10.8×
Monthly cashflow live
- Estimated rent
- $2,498 medium interval (Pro) →
- Mortgage (P&I)
- −$1,699
- Tax from tax record
- −$207 /mo · $2,489/yr
- Insurance
- −$135
- HOA
- −$42
- Vacancy / Maint / Mgmt
- −$525
- Net cashflow
- $-110
Break-even live
UW: 25.0% down · 7.5% · 30yr · 1.5% tax · 5.0% vac · 8.0% maint · 8.0% mgmt
Financing live
Cash to close
- Down payment
- $81,000
- Closing costs
- $9,720
- Reserves months
- —
- Total cash needed
- —
Loan-product check · same deal, 3 products live
Conventional
25% down · 7.5% · 30yr
- Down + closing
- —
- Monthly P&I
- —
- Monthly cashflow
- —
- DSCR
- —
- Eligible?
- —
Personal DTI + credit; lowest rate.
DSCR
20% down · 8.5% · 30yr
- Down + closing
- —
- Monthly P&I
- —
- Monthly cashflow
- —
- DSCR
- —
- Eligible?
- —
No personal income docs; deal must DSCR.
Hard money
10% down · 12.0% · 12mo
- Down + closing
- —
- Monthly P&I
- —
- Monthly cashflow
- —
- DSCR
- —
- Eligible?
- —
Short-term bridge; refi at stabilization.
Rent comps 2 comps
| Address | Beds | Baths | Sqft | Rent | $/sqft | DOM | Units | Dist |
|---|---|---|---|---|---|---|---|---|
| 204 Myers Rd Danville, IN | 3.0 | 2.0 | 1627 | $1,889 | $1.16 | 43d | 1 | 0.49mi |
| 2068 Quail West Dr Danville, IN | 5.0 | 3.0 | 2850 | $2,395 | $0.84 | 17d | 1 | 1.27mi |
HOA detail
- Monthly dues
- $42 · $504/yr
Listing history 15 events
-
2026-06-17status $324,000 Pending 40 DOM
-
2026-06-17days on market $324,000 Active 40 DOM
-
2026-06-16days on market $324,000 Active 39 DOM
-
2026-06-15days on market $324,000 Active 38 DOM
-
2026-06-13days on market $324,000 Active 36 DOM
-
2026-06-13days on market $324,000 Active 35 DOM
-
2026-06-09days on market $324,000 Active 32 DOM
-
2026-06-08days on market $324,000 Active 31 DOM
-
2026-06-07days on market $324,000 Active 30 DOM
-
2026-06-03days on market $324,000 Active 26 DOM
-
2026-06-02days on market $324,000 Active 25 DOM
-
2026-06-01days on market $324,000 Active 24 DOM
-
2026-05-31days on market $324,000 Active 23 DOM
-
2026-05-07$324,000 Active 1276-char remark
-
2021-10-18soldstatus $59,000
ⓘ Source: listings_history table (triggers on properties + properties_extension) + one-shot
backfill from property_details.listing_events for pre-trigger history.
Tax reassessment forecast IN · Partial reset (capped growth)
- Current annual tax
- $2,489 · $207/mo
- Projected year-2 tax
- $2,622 · $218/mo
- Expected delta
- +$132/yr (+$11/mo · 5.3%)
ⓘ Screening estimate from a state-policy table — verify with the county assessor before closing.
Climate risk First Street
- Flood 1/10 Low FEMA zone X (unshaded) · 0% chance over 30 yrs
- Wildfire 2/10 Low
- Heat 3/10 Moderate 7 d/yr ≥101°F today · 19 d/yr by 30 yrs out
- Wind 2/10 Low 100% chance of damaging wind over 30 yrs
- Air quality 3/10 Moderate 2 unhealthy d/yr today · 3 by 30 yrs out
Nearby sold comps map
Loading sold comps map…
Walkable amenities ~0.75 mi
Loading nearby amenities…
Taxation est. · year 1
- Rental income
- $29,974
- − Mortgage interest
- −$18,149
- − Property taxes
- −$2,489
- − Insurance
- −$1,620
- − Repairs & maintenance
- −$2,398
- − Management
- −$2,398
- − HOA
- −$504
- − Depreciation
- −$9,425
- Taxable loss
- −$7,009
- Est. tax savings @ 24.0%
- +$1,682
- After-tax cash flow
- $360/yr
For passive investors: Depreciation is non-cash, so a rental often shows a tax loss while cash-flowing — sheltering income. Rental losses are passive: they offset passive income freely, and up to $25,000/yr can offset ordinary (W-2) income if you actively participate and your MAGI is under $100k (phasing out to $0 by $150k); unused losses carry forward. On sale, claimed depreciation is recaptured at up to 25%, and gains may owe capital-gains tax (a 1031 exchange can defer both). Figures are a year-1 estimate at your 24.0% rate — not tax advice; consult a CPA.
Schools (NCES district)
- District
- Danville Community School Corporation
- NCES district ID
- 1802550
- Math proficiency
- 52% ▼ -10.00%
- Reading proficiency
- 57% ▼ -6.00%
- Median HH income
- $64,913
- Composite
- 47.93/100
- National rank
- #2208
- State rank
- #27 of 301 in IN
Livability — Danville
- Score
- 65/100
- State rank
- #325
- US rank
- #12689
Category grades
Schools grade is shown separately in the Schools card above.
Census & demographics
- County
- Hendricks County · 143,373 people
- City population
- 16,974
- Metro
- Indianapolis-Carmel-Anderson, IN
- Population (ZIP)
- 16,974
- Household income
- $99,531
- Rent vs Own
- Severe rent burden
- 234.0
Population outlook (Hendricks County) Hauer SSP2
- Today (2025)
- 187,418 people
- By 2030
- 201,494 · +7.5%
- By 2040
- 228,487 · +21.9%
- By 2050
- 253,068 · +35.0%
- By 2075
- 308,920 · +64.8%
- By 2100
- 336,510 · +79.6%
Race, ethnicity, and origin ACS 2023
- Neighborhood character
- Predominantly White (93%)
- Race & ethnicity
- White 93% Hispanic / Latino 2% Black 2% Two or more races 2%
- Common ancestry
- Slovak 2% Romanian 2% Lithuanian 1%
- Foreign-born
- 1% · Canada
- Languages at home
- 99% English-only · Spanish 1%
Political lean MEDSL · Hendricks
- 2024 margin
- Strong R (+21.5) · D 38.4% · R 59.9% · Other 1.7%
- 2008→2024 swing
- +1.9pp toward D · 2008: -23.4pp · 2024: -21.5pp
- All cycles
- 2024: R+21.5 2020: R+23.9 2016: R+34.2 2012: R+34.9 2008: R+23.4
Not yet ingested
- Civics
- —
Market trends
- HPI YoY
- ▼ -105.58%
- Current HPI
- 222.8401
- Rent YoY
- —
- Metro
- Indianapolis-Carmel-Anderson, IN
- State GDP YoY
- ▲ 2.90%
- F500 in state
- 18
Industry mix (Fortune 500 HQ in IN)
| Industry | F500 HQs | Revenue |
|---|---|---|
| Industrial Machinery | 2 | $37B |
|
||
| Healthcare | 1 | $177B |
|
||
| Pharmaceuticals | 1 | $45B |
|
||
| Metals / Steel | 1 | $18B |
|
||
| Agriculture | 1 | $17B |
|
||
| Packaging | 1 | $12B |
|
||
Price history
+449.2% since first listed3 events — show timeline
- 2026-06-17 Pending — MIBOR as Distributed by MLS Grid
- 2026-05-07 Listed $324,000 MIBOR as Distributed by MLS Grid
- 2021-10-18 Sold (Public Records) $59,000 Public Records
Property tax history
+302.6%/yrLatest (2025): $2,489 · +20.3% YoY. Source: county tax records.
Cash-flow waterfall
monthlySold comps — $/sqft
last 12 mo · ≤1 miLoading sold comps…