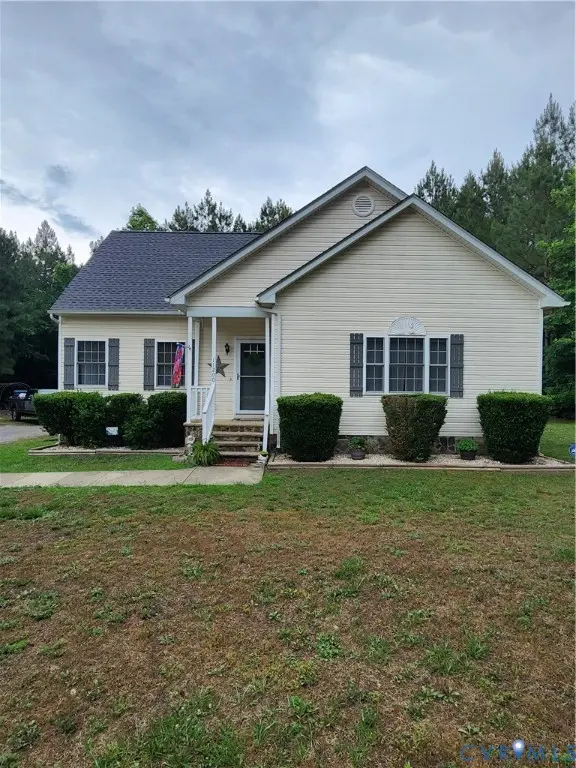
11200 Asbury Rd · McKenney, VA
Flood risk 8/10 · Major
- FEMA flood zone
- X (unshaded)
- Chance of flooding over 30 yrs
- 0.99%
- Est. flood insurance / yr
- $507 – $1,088
Fire risk 4/10 · Minor
- Est. fire insurance / yr
- $666 – $1,236
Heat risk 6/10 · Moderate
- Hot days now (above 106°F)
- 7 days/yr
- Hot days in 30 yrs
- 16 days/yr
Wind risk 6/10 · Moderate
- Chance of severe wind over 30 yrs
- 27.0%
Air-quality risk 2/10 · Minimal
- Unhealthy air days now
- 0 days/yr
- Unhealthy air days in 30 yrs
- 1 days/yr
Risk factors via First Street. Map © Google.
Why this score? — see what drove the C- grade
The composite is a weighted blend of 9 inputs, each scored 0–100. Each bar is that input's sub-score; the figure is the points it added to the 100-point composite (weight × sub-score).
- Cash flow +13.5/30.0
- ARV discount +11.4/15.0
- Appreciation +10.0/10.0
- Schools +4.7/10.0
- DSCR +4.1/10.0
- Livability +3.0/5.0
- 1% rule +2.8/10.0
- Rent growth +2.5/5.0
- Condition / age +2.5/5.0
$314,950
🖨 Deal sheet 📄 Offer letter ✓ Due diligence
Listing remarks MLS
New Construction 3 bedroom 2 bath on a 4.7 acre lot in the country. Eat in kitchen with plenty of cabinets an pantry. Large Master with WIC an private bath. Large 12x12 rear deck. Seller to pay $4000.00 in closing cost
Key facts
- 4.75 acre lot
- Parking
- Built 2009
Property features AI
Exterior
- Parking: Carport; No garage; Shared driveway
- Security: Security system
- Utilities: Well water; Septic tank
- Home design: Single-story home; Resale property; Shingle roof; Vinyl siding; Drywall and frame construction; Facing/entry level: First level
- Construction: Built (actual year reported); Frame construction with vinyl siding; Shingle roof
- Exterior features: Front porch; Stoop; Deck; Shed(s); Storage
Interior
- Kitchen: Electric cooking; Microwave; Dishwasher; Refrigerator; Pantry; Eat-in kitchen
- Bedrooms: Total rooms: 6
- Flooring: Linoleum; Partially carpeted
- Bathrooms: 2 full bathrooms; Tub & shower in at least one bathroom (first level)
- Heating & cooling: Heat pump heating; Electric heating available; Heat pump cooling
- Interior features: Ceiling fans; Eat-in kitchen; High ceilings; Pantry; Walk-in closet(s); Thermal windows; Storm door(s)
- Laundry & utility: Washer; Dryer; Electric water heater
Neighborhood map
What this means for you Summary
Snapshot
- This is a 3-bed/2.0-bath single-family listed at $315k.
Deal economics
- At list price, monthly cash flow is $-54 ($-644/yr) — negative.
- To cash-flow at today's rent, offer at most $305k (3.0% below list).
- To meet the 1% rule (rent ≥ 1% of price), the offer needs to be $247k (21.7% below list).
- Recommended offer: $247k (21.7% below list) — sets the bar for 1% rule.
Location & tenants
- Location reads 60/100 on livability (#441 in VA) — a middle-class / working-renter tenant base. Strengths: cost of living A+, housing A+, schools B+; Watch: crime C-, amenities F, commute F.
- Dinwiddie County Public School District (rural): math 45% / reading 64% proficiency, ranked #81 of 131 in VA (top 62%) — acceptable for families but not a draw, mixed tenant base, ~2y average lease.
- Market conditions: 11 active listings in the ZIP; 82 units permitted in Dinwiddie County in 2024 (0 in 5+ unit buildings).
Forward outlook
- In year one you build about $34k of equity ($2k loan paydown + $31k appreciation (10.0% local appreciation)).
- Dinwiddie County population projected at -12% by 2050 — secular population decline; favor cash flow + early exit over multi-decade hold.
- At projected returns (10.0% appreciation + 3.0% rent growth), your $88k cash investment doubles in ~3 years — after that, you're playing with house money.
- By year 2, paydown + projected appreciation supports a ~$54k cash-out refi (75% LTV) — recoverable capital for the next deal without selling this one.
Negotiation context
- It's been on market 17 days — a 2% lower offer ($310k) is reasonable based on typical stale-listing flexibility.
- 2 sale attempts since 17y ago; this cycle's ask is 80% above the opening price — seller raised mid-cycle; expect resistance to lowballs.
- Current owner paid $169k; list at $315k implies a 86% gain — meaningful room to come down on a strong offer.
Risks & watch-outs
- Watch-outs: flood insurance adds $66/mo.
- Climate carrying-cost: severe flood risk; major wind risk, 27% chance of damaging wind over 30y; extreme-heat days projected 7→16/yr by 2055 (HVAC capex compounding) — expect insurance premiums to compound above CPI over the hold.
Questions for the listing agent
- What do current leases actually rent for vs. the listed asking? Can we see a recent rent roll and the last 12 months of T-12 income?
- What's the actual annual flood-insurance premium (NFIP or private), and is the property in a SFHA with mandatory coverage?
- Is there a deadline driving the sale (1031 exchange, divorce, estate, relocation)? That informs how much negotiation room exists.
- Schools are B-rated — typically a magnet for longer-tenancy family renters. What's the average tenant stay here, and is there a school-zone premium baked into asking?
- What's the average days-on-market for RENTAL listings here right now (not sales)? A rising rental-DOM trend means longer vacancies and softer asking-rent achievability than the comps imply.
- What's the recent tenant-quality profile in this submarket — average credit score on applications, eviction rate, late-payment / NSF rate, and stable-employment percentage? A property-management company in the area should have these aggregated.
- How much new for-sale + rental construction is in the pipeline within 1–3 miles? Heavy new supply typically softens prices + rents 12–24 months out; constrained supply supports both.
Investment metrics
- 1% rule
- 0.78% ✗
- Cap rate
- 6.34%
- Cash-on-cash
- 0.17%
- DSCR
- 1.01
- GRM
- 10.6
CMA / ARV
- ARV (on-the-fly)
- $344,880
- Comps found
- 1
Show comp detail 1 sale within ~0.75 mi
| Address | Dist | Beds/Ba | Sqft | Sold | Price | $/sf | Match |
|---|---|---|---|---|---|---|---|
| 10895 Asbury Rd | 0.60mi | 3/2.0 | 1,248 (-13%) | 9mo | $300,000 | $240 | 42 |
Match score weights: distance 35% · size 25% · config 20% · recency 20%. Top-matched comps best support the ARV.
Projected returns pro-forma
10.0% appreciation · 3.0% rent growth · sell at horizon
- IRR
- 23.7%
- Equity multiple
- 2.91×
- Total profit
- $168,042
- Equity at exit
- $283,732
- IRR
- 21.1%
- Equity multiple
- 6.64×
- Total profit
- $497,405
- Equity at exit
- $611,879
Cash invested: $88,186 (down + closing). Projections, not guarantees.
Landlord ↔ Tenant lean methodology
- Overall (STATE)
- 55 Moderately Landlord-Leaning
- State Virginia
- 55 Moderately Landlord-Leaning · D+2
- County
- — inherits STATE
- City
- — inherits STATE
ZIP-level market 23872
- Active inventory
- 11
- Price-to-rent
- 10.6×
Monthly cashflow live
- Estimated rent
- $2,467 medium interval (Pro) →
- Mortgage (P&I)
- −$1,652
- Tax from tax record
- −$153 /mo · $1,835/yr
- Insurance
- −$131
- Flood insurance flood zone
- −$66 /mo · $798/yr
- HOA
- −$0
- Vacancy / Maint / Mgmt
- −$518
- Net cashflow
- $-54
Break-even live
UW: 25.0% down · 7.5% · 30yr · 1.5% tax · 5.0% vac · 8.0% maint · 8.0% mgmt
Financing live
Cash to close
- Down payment
- $78,738
- Closing costs
- $9,448
- Reserves months
- —
- Total cash needed
- —
Loan-product check · same deal, 3 products live
Conventional
25% down · 7.5% · 30yr
- Down + closing
- —
- Monthly P&I
- —
- Monthly cashflow
- —
- DSCR
- —
- Eligible?
- —
Personal DTI + credit; lowest rate.
DSCR
20% down · 8.5% · 30yr
- Down + closing
- —
- Monthly P&I
- —
- Monthly cashflow
- —
- DSCR
- —
- Eligible?
- —
No personal income docs; deal must DSCR.
Hard money
10% down · 12.0% · 12mo
- Down + closing
- —
- Monthly P&I
- —
- Monthly cashflow
- —
- DSCR
- —
- Eligible?
- —
Short-term bridge; refi at stabilization.
Listing history 13 events
-
2026-06-18days on market $314,950 Coming Soon 17 DOM
-
2026-06-17days on market $314,950 Coming Soon 16 DOM
-
2026-06-16days on market $314,950 Coming Soon 15 DOM
-
2026-06-15days on market $314,950 Coming Soon 14 DOM
-
2026-06-13days on market $314,950 Coming Soon 12 DOM
-
2026-06-13days on market $314,950 Coming Soon 11 DOM
-
2026-06-09days on market $314,950 Coming Soon 8 DOM
-
2026-06-08days on market $314,950 Coming Soon 7 DOM
-
2026-06-07days on market $314,950 Coming Soon 6 DOM
-
2026-06-05days on market $314,950 Coming Soon 3 DOM
-
2026-06-03days on market $314,950 Coming Soon 2 DOM
-
2026-06-02remarks 693-char remark
-
2026-06-02$314,950 Coming Soon 1 DOM
ⓘ Source: listings_history table (triggers on properties + properties_extension) + one-shot
backfill from property_details.listing_events for pre-trigger history.
Tax reassessment forecast VA · Resets to sale price
- Current annual tax
- $1,835 · $153/mo
- Projected year-2 tax
- $2,583 · $215/mo
- Expected delta
- +$748/yr (+$62/mo · 40.7%)
ⓘ Screening estimate from a state-policy table — verify with the county assessor before closing.
Climate risk First Street
- Flood 8/10 Severe FEMA zone X (unshaded) · 99% chance over 30 yrs
- Wildfire 4/10 Moderate
- Heat 6/10 Major 7 d/yr ≥106°F today · 16 d/yr by 30 yrs out
- Wind 6/10 Major 27% chance of damaging wind over 30 yrs
- Air quality 2/10 Low 0 unhealthy d/yr today · 1 by 30 yrs out
Nearby sold comps map
Loading sold comps map…
Walkable amenities ~0.75 mi
Loading nearby amenities…
Taxation est. · year 1
- Rental income
- $29,598
- − Mortgage interest
- −$17,642
- − Property taxes
- −$1,835
- − Insurance
- −$2,372
- − Repairs & maintenance
- −$2,368
- − Management
- −$2,368
- − Depreciation
- −$9,162
- Taxable loss
- −$6,149
- Est. tax savings @ 24.0%
- +$1,476
- After-tax cash flow
- $832/yr
For passive investors: Depreciation is non-cash, so a rental often shows a tax loss while cash-flowing — sheltering income. Rental losses are passive: they offset passive income freely, and up to $25,000/yr can offset ordinary (W-2) income if you actively participate and your MAGI is under $100k (phasing out to $0 by $150k); unused losses carry forward. On sale, claimed depreciation is recaptured at up to 25%, and gains may owe capital-gains tax (a 1031 exchange can defer both). Figures are a year-1 estimate at your 24.0% rate — not tax advice; consult a CPA.
Schools (NCES district)
- District
- Dinwiddie County Public School District
- NCES district ID
- 5101170
- Math proficiency
- 45% ▼ -36.00%
- Reading proficiency
- 64% ▼ -13.00%
- Median HH income
- $51,857
- Composite
- 46.62/100
- National rank
- #2413
- State rank
- #81 of 131 in VA
Livability — McKenney
- Score
- 60/100
- State rank
- #441
- US rank
- #18946
Category grades
Schools grade is shown separately in the Schools card above.
Census & demographics
- City population
- 2,511
- Population (ZIP)
- 2,511
Population outlook (Dinwiddie County) Hauer SSP2
- Today (2025)
- 27,876 people
- By 2030
- 27,480 · -1.4%
- By 2040
- 26,285 · -5.7%
- By 2050
- 24,617 · -11.7%
- By 2075
- 21,647 · -22.3%
- By 2100
- 18,485 · -33.7%
Race, ethnicity, and origin ACS 2023
- Neighborhood character
- Majority White (62%)
- Race & ethnicity
- White 62% Black 35% Two or more races 2% Hispanic / Latino 1%
- Common ancestry
- Serbian 2% Scandinavian 1% Slovak 1%
- Foreign-born
- 1% · South Korea
- Languages at home
- 98% English-only · Spanish 1% Korean 0%
Political lean MEDSL · Dinwiddie
- 2024 margin
- Strong R (+23.1) · D 38.1% · R 61.2%
- 2008→2024 swing
- -21.0pp toward R · 2008: -2.2pp · 2024: -23.1pp
- All cycles
- 2024: R+23.1 2020: R+16.4 2016: R+12.4 2012: R+2.6 2008: R+2.2
Not yet ingested
- Civics
- —
Market trends
- HPI YoY
- ▲ 80.66%
- Current HPI
- 295.8892
- Rent YoY
- —
- Metro
- —
- State GDP YoY
- ▲ 2.40%
- F500 in state
- 50
Industry mix (Fortune 500 HQ in VA)
| Industry | F500 HQs | Revenue |
|---|---|---|
| Aerospace / Defense | 4 | $236B |
|
||
| Technology / Defense | 3 | $32B |
|
||
| Financial Services | 2 | $176B |
|
||
| Utilities | 2 | $27B |
|
||
| Insurance | 2 | $25B |
|
||
| Technology | 2 | $15B |
|
||
Price history
+319.9% since first listed8 events — show timeline
- 2026-06-02 Coming Soon $314,950 CVRMLS
- 2009-08-17 Sold (Public Records) $169,000 Public Records
- 2009-08-14 Sold (MLS) $169,000 CVRMLS
- 2009-08-14 Sold (MLS) $169,000 CVRMLS
- 2009-02-25 Listed $174,500 CVRMLS
- 2009-02-25 Listed $174,500 CVRMLS
- 2008-11-03 Sold (Public Records) $169,000 Public Records
- 2008-01-15 Sold (Public Records) $75,000 Public Records
Property tax history
+3.4%/yrLatest (2025): $1,835 · +25.1% YoY. Source: county tax records.
Cash-flow waterfall
monthlySold comps — $/sqft
last 12 mo · ≤1 miLoading sold comps…