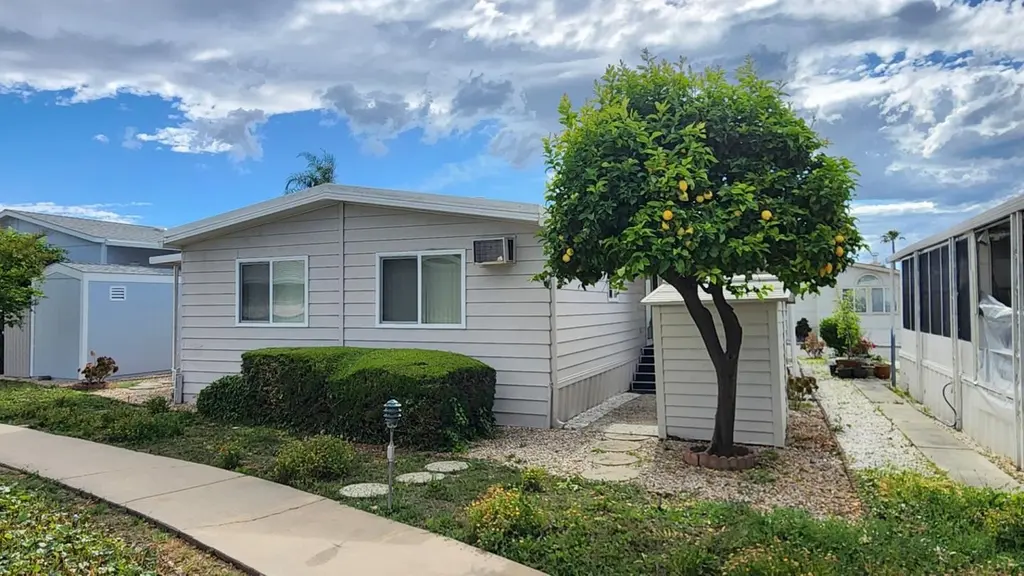
5450 Monterey Rd #77 · San Jose, CA
Flood risk 1/10 · Minimal
- FEMA flood zone
- D
- Chance of flooding over 30 yrs
- 0.0%
- Est. flood insurance / yr
- $544 – $1,084
Fire risk 5/10 · Moderate
- Est. fire insurance / yr
- $659 – $1,223
Heat risk 4/10 · Minor
- Hot days now (above 96°F)
- 7 days/yr
- Hot days in 30 yrs
- 14 days/yr
Wind risk 1/10 · Minimal
- Chance of severe wind over 30 yrs
- —
Air-quality risk 9/10 · Severe
- Unhealthy air days now
- 19 days/yr
- Unhealthy air days in 30 yrs
- 19 days/yr
Risk factors via First Street. Map © Google.
Why this score? — see what drove the B- grade
The composite is a weighted blend of 9 inputs, each scored 0–100. Each bar is that input's sub-score; the figure is the points it added to the 100-point composite (weight × sub-score).
- Cash flow +25.5/30.0
- ARV discount +13.5/15.0
- DSCR +8.4/10.0
- 1% rule +6.7/10.0
- Schools +4.9/10.0
- Livability +3.9/5.0
- Rent growth +2.8/5.0
- Condition / age +2.5/5.0
- Appreciation +0.0/10.0
$329,000
🖨 Deal sheet 📄 Offer letter ✓ Due diligence
Listing remarks MLS
Step into this well-maintained 1,440 sq. ft. family mobile home, offering comfort, space, and convenience. Located in a desirable community with low space rent of only $1,277 per month, this home provides an affordable lifestyle without compromising quality. Enjoy a bright, open layout, generous living areas with separate a living room, family room, and dining area. Convenient neighborhood, close to shopping, schools, and major routes. A perfect opportunity for anyone seeking a move in ready home in a great location. Dont miss this chance to own a beautifully maintained mobile home offering unbeatable value.
Key facts
- Built 1975
- Listed 58 days
Neighborhood map
What this means for you Summary
Snapshot
- This is a 2-bed/2.0-bath manufactured listed at $329k.
Deal economics
- At list price, monthly cash flow is $765 ($9k/yr) — positive.
- The deal already cash-flows at list — no discount required.
- Meets the 1% rule at list price ($4k rent vs $329k).
- Recommended offer: $319k (3.0% below list) — sets the bar for market timing.
- Cap rate 9.1% vs local median 1.6% in San Jose — top-decile yield for the area; either an underpriced asset or a hidden risk that comps aren't pricing in. Stress-test before assuming the spread holds.
Location & tenants
- Location reads 78/100 on livability (#68 in CA, #2,559 nationally) — a middle-class / working-renter tenant base. Strengths: amenities A+, commute A+, employment A+; Watch: crime F, cost of living F.
- Oak Grove Elementary (urban): math 47% / reading 54% proficiency, ranked #339 of 1,400 in CA (top 24%) — acceptable for families but not a draw, mixed tenant base, ~2y average lease.
- Market conditions: Rents rising (+1.0%/yr); 65 active listings in the ZIP; 19 comparable units currently listed for rent nearby; rentals leasing fast (median 2d on market — plan ~1-2 weeks tenant-placement turnaround); solid renter incomes; 3,838 units permitted in Santa Clara County in 2024 (1,886 in 5+ unit buildings).
- At $3,847/mo this rent would consume 46% of the median local household income ($101k/yr) (locally 1808% of renters already pay >50% of income on rent) — very limited rent-growth headroom before tenants either downsize or default.
Forward outlook
- Local home prices are declining (-3.0%/yr); year-one equity from $2k of loan paydown is wiped out by about $10k of value loss. Plan a longer hold.
- Santa Clara County population projected at +24% by 2050 — long-run rental-demand tailwind backs the buy-and-hold thesis.
Negotiation context
- It's been on market 58 days — a 3% lower offer ($319k) is reasonable based on typical stale-listing flexibility.
- 2 sale attempts with the ask held roughly flat each time — persistent listings suggest the price (not the market) is what's stuck; bring a comps-based counter.
Risks & watch-outs
- Climate carrying-cost: moderate wildfire risk — expect insurance premiums to compound above CPI over the hold.
Questions for the listing agent
- It's been on market 58 days. Have you received any prior offers? Is the seller open to a 3% concession, seller financing, or rate buy-down credit?
- Built in 1975 — when were the roof, HVAC, electrical panel, plumbing, and water heater last replaced?
- Is there a deadline driving the sale (1031 exchange, divorce, estate, relocation)? That informs how much negotiation room exists.
- Crime grade is F in this area — have there been break-ins, vandalism, or insurance claims at this property in the last 3 years? What carrier currently insures it and at what premium?
- What's the average days-on-market for RENTAL listings here right now (not sales)? A rising rental-DOM trend means longer vacancies and softer asking-rent achievability than the comps imply.
- What's the recent tenant-quality profile in this submarket — average credit score on applications, eviction rate, late-payment / NSF rate, and stable-employment percentage? A property-management company in the area should have these aggregated.
- How much new for-sale + rental construction is in the pipeline within 1–3 miles? Heavy new supply typically softens prices + rents 12–24 months out; constrained supply supports both.
Investment metrics
- 1% rule
- 1.17% ✓
- Cap rate
- 9.08%
- Cash-on-cash
- 9.97%
- DSCR
- 1.44
- GRM
- 7.1
CMA / ARV
- ARV (median comp)
- $379,616
- List price
- $329,000
- Delta
- -13.33%
- Verdict
- UNDERPRICED
- Comps
- 20 within 1.0 mi
Show comp detail 12 sales within ~0.75 mi
| Address | Dist | Beds/Ba | Sqft | Sold | Price | $/sf | Match |
|---|---|---|---|---|---|---|---|
| 5450 Monterey Rd #87 | 0.00mi | 2/2.0 | 1,440 (0%) | 6mo | $225,000 | $156 | 95 |
| 5450 Monterey Rd #145 | 0.06mi | 2/2.0 | 1,464 (+2%) | 7mo | $215,000 | $147 | 89 |
| 5450 Monterey Rd #15 | 0.07mi | 3/2.0 (+1) | 1,469 (+2%) | 2mo | $375,000 | $255 | 87 |
| 5450 Monterey Unit 54A | 0.06mi | 3/2.0 (+1) | 1,410 (-2%) | 4mo | $355,000 | $252 | 85 |
| 5450 Monterey Rd #143 | 0.16mi | 3/2.0 (+1) | 1,536 (+7%) | 2mo | $270,000 | $176 | 74 |
| 200 Ford Rd #7 | 0.53mi | 3/2.0 (+1) | 1,440 (0%) | 10mo | $390,000 | $271 | 62 |
| 165 Blossom Hill Rd #145 | 0.58mi | 3/2.0 (+1) | 1,500 (+4%) | 1mo | $445,000 | $297 | 60 |
| 200 Ford Rd #227 | 0.53mi | 3/2.0 (+1) | 1,344 (-7%) | 2mo | $339,000 | $252 | 57 |
| 200 Ford Rd #160 | 0.53mi | 3/2.0 (+1) | 1,344 (-7%) | 6mo | $345,000 | $257 | 54 |
| 200 Ford Rd #200 | 0.53mi | 3/2.0 (+1) | 1,368 (-5%) | 10mo | $390,000 | $285 | 54 |
| 165 Blossom Hill Rd #113 | 0.62mi | 3/2.0 (+1) | 1,500 (+4%) | 7mo | $415,000 | $277 | 53 |
| 200 Ford Rd #168 | 0.53mi | 3/2.0 (+1) | 1,568 (+9%) | 6mo | $412,000 | $263 | 50 |
Match score weights: distance 35% · size 25% · config 20% · recency 20%. Top-matched comps best support the ARV.
Projected returns pro-forma
-3.0% appreciation · 1.0% rent growth · sell at horizon
- IRR
- -3.6%
- Equity multiple
- 0.87×
- Total profit
- $-12,093
- Equity at exit
- $49,055
- IRR
- 3.7%
- Equity multiple
- 1.24×
- Total profit
- $22,561
- Equity at exit
- $28,446
Cash invested: $92,120 (down + closing). Projections, not guarantees.
Landlord ↔ Tenant lean methodology
- Overall (CITY)
- 0 Strongly Tenant-Friendly
- State California
- 18 Strongly Tenant-Friendly · D+13
- County
- — inherits STATE
- City San Jose
- 0 Strongly Tenant-Friendly · D+24
ZIP-level market 95111
- Rents YoY
- 1.0%
- Active inventory
- 65
- Price-to-rent
- 7.1×
Monthly cashflow live
- Estimated rent
- $3,847 high interval (Pro) →
- Mortgage (P&I)
- −$1,725
- Tax est. 1.5%
- −$411 /mo · $4,935/yr
- Insurance
- −$137
- HOA
- −$0
- Vacancy / Maint / Mgmt
- −$808
- Net cashflow
- $765
Break-even live
UW: 25.0% down · 7.5% · 30yr · 1.5% tax · 5.0% vac · 8.0% maint · 8.0% mgmt
Financing live
Cash to close
- Down payment
- $82,250
- Closing costs
- $9,870
- Reserves months
- —
- Total cash needed
- —
Loan-product check · same deal, 3 products live
Conventional
25% down · 7.5% · 30yr
- Down + closing
- —
- Monthly P&I
- —
- Monthly cashflow
- —
- DSCR
- —
- Eligible?
- —
Personal DTI + credit; lowest rate.
DSCR
20% down · 8.5% · 30yr
- Down + closing
- —
- Monthly P&I
- —
- Monthly cashflow
- —
- DSCR
- —
- Eligible?
- —
No personal income docs; deal must DSCR.
Hard money
10% down · 12.0% · 12mo
- Down + closing
- —
- Monthly P&I
- —
- Monthly cashflow
- —
- DSCR
- —
- Eligible?
- —
Short-term bridge; refi at stabilization.
Rent comps 19 comps
| Address | Beds | Baths | Sqft | Rent | $/sqft | DOM | Units | Dist |
|---|---|---|---|---|---|---|---|---|
| 5491 Demerest Ln San Jose, CA | 3.0 | 2.5 | 1335 | $4,800 | $3.60 | 2d | 1 | 0.37mi |
| 5560 Lexington Ave San Jose, CA | 2.0 | 1.0–2.0 | 846 | $3,530 | $4.17 | 2d | 14 | 0.39mi |
| 5590 Makati Cir San Jose, CA | 2.0 | 2.0 | 1233 | $3,395 | $2.75 | 2d | 1 | 0.76mi |
| 5683 Beswick Dr San Jose, CA | 2.0 | 1.0 | 1100 | $3,200 | $2.91 | 3d | 1 | 0.77mi |
| 5480 Lean Ave San Jose, CA | 2.0 | 1.0 | 880 | $2,910 | $3.31 | 2d | 3 | 0.90mi |
| 5805 Charlotte Dr San Jose, CA | 1.0–3.0 | 1.0–2.0 | 1050 | $3,966 | $3.78 | 2d | 18 | 0.90mi |
| 56 Cherry Crest Ln San Jose, CA | 2.0 | 2.0 | 986 | $3,200 | $3.25 | 2d | 1 | 0.93mi |
| 5925 Charlotte Dr San Jose, CA | 2.0 | 2.0 | 1261 | $3,900 | $3.09 | 2d | 2 | 1.04mi |
| 5959 Charlotte Dr San Jose, CA | 3.0 | 4.0 | 1700 | $4,000 | $2.35 | 3d | 1 | 1.08mi |
| 150 Palm Valley Blvd San Jose, CA | 1.0–3.0 | 1.0–2.0 | 1028 | $4,028 | $3.92 | 2d | 26 | 1.19mi |
| 6809 Canine Ct San Jose, CA | 3.0 | 3.0 | 1822 | $4,375 | $2.40 | 2d | 1 | 1.20mi |
| 250 Palm Valley Blvd San Jose, CA | 1.0–3.0 | 1.0–2.0 | 1014 | $3,643 | $3.59 | 2d | 7 | 1.21mi |
| 5659 Lathrop Dr San Jose, CA | 3.0 | 2.0 | 1543 | $4,300 | $2.79 | 2d | 1 | 1.22mi |
| 6320 Island Pine Way San Jose, CA | 2.0 | 2.5 | 1293 | $4,200 | $3.25 | 2d | 1 | 1.28mi |
| 6320 Island Pine Way San Jose, CA | 2.0 | 2.5 | 1293 | $4,200 | $3.25 | 3d | 1 | 1.28mi |
| 6818 Chroma Ct San Jose, CA | 3.0 | 3.0 | 1563 | $4,295 | $2.75 | 10d | 1 | 1.31mi |
| 6568 Vision Ct San Jose, CA | 2.0 | 2.0 | 1096 | $4,200 | $3.83 | 2d | 1 | 1.32mi |
| 6670 Emergent Way San Jose, CA | 1.0–3.0 | 1.0–2.0 | 1024 | $4,193 | $4.09 | 2d | 4 | 1.37mi |
| 282 Tradewinds Dr San Jose, CA | 2.0 | 1.0 | 959 | $3,100 | $3.23 | 2d | 1 | 1.48mi |
Listing history 18 events
-
2026-06-18days on market $329,000 Active 58 DOM
-
2026-06-17days on market $329,000 Active 57 DOM
-
2026-06-16days on market $329,000 Active 56 DOM
-
2026-06-15days on market $329,000 Active 55 DOM
-
2026-06-13days on market $329,000 Active 53 DOM
-
2026-06-13days on market $329,000 Active 52 DOM
-
2026-06-09days on market $329,000 Active 49 DOM
-
2026-06-08days on market $329,000 Active 48 DOM
-
2026-06-07days on market $329,000 Active 47 DOM
-
2026-06-05days on market $329,000 Active 44 DOM
-
2026-06-03days on market $329,000 Active 43 DOM
-
2026-06-02days on market $329,000 Active 42 DOM
-
2026-06-01days on market $329,000 Active 41 DOM
-
2026-05-31remarks 699-char remark
-
2026-05-31days on market $329,000 Active 40 DOM
-
2026-04-21historical
Show marketing remark (615 chars)
Step into this well-maintained 1,440 sq. ft. family mobile home, offering comfort, space, and convenience. Located in a desirable community with low space rent of only $1,277 per month, this home provides an affordable lifestyle without compromising quality. Enjoy a bright, open layout, generous living areas with separate a living room, family room, and dining area. Convenient neighborhood, close to shopping, schools, and major routes. A perfect opportunity for anyone seeking a move in ready home in a great location. Dont miss this chance to own a beautifully maintained mobile home offering unbeatable value.
-
2026-04-21$329,000 Active 615-char remark
Show marketing remark (615 chars)
Step into this well-maintained 1,440 sq. ft. family mobile home, offering comfort, space, and convenience. Located in a desirable community with low space rent of only $1,277 per month, this home provides an affordable lifestyle without compromising quality. Enjoy a bright, open layout, generous living areas with separate a living room, family room, and dining area. Convenient neighborhood, close to shopping, schools, and major routes. A perfect opportunity for anyone seeking a move in ready home in a great location. Dont miss this chance to own a beautifully maintained mobile home offering unbeatable value.
ⓘ Source: listings_history table (triggers on properties + properties_extension) + one-shot
backfill from property_details.listing_events for pre-trigger history.
Climate risk First Street
- Flood 1/10 Low FEMA zone D · 0% chance over 30 yrs
- Wildfire 5/10 Major
- Heat 4/10 Moderate 7 d/yr ≥96°F today · 14 d/yr by 30 yrs out
- Wind 1/10 Low
- Air quality 9/10 Extreme 19 unhealthy d/yr today · 19 by 30 yrs out
Nearby sold comps map
Loading sold comps map…
Walkable amenities ~0.75 mi
Loading nearby amenities…
Taxation est. · year 1
- Rental income
- $46,163
- − Mortgage interest
- −$18,429
- − Property taxes
- −$4,935
- − Insurance
- −$1,645
- − Repairs & maintenance
- −$3,693
- − Management
- −$3,693
- − Depreciation
- −$9,571
- Taxable income
- $4,197
- Est. tax owed @ 24.0%
- −$1,007
- After-tax cash flow
- $8,178/yr
For passive investors: Depreciation is non-cash, so a rental often shows a tax loss while cash-flowing — sheltering income. Rental losses are passive: they offset passive income freely, and up to $25,000/yr can offset ordinary (W-2) income if you actively participate and your MAGI is under $100k (phasing out to $0 by $150k); unused losses carry forward. On sale, claimed depreciation is recaptured at up to 25%, and gains may owe capital-gains tax (a 1031 exchange can defer both). Figures are a year-1 estimate at your 24.0% rate — not tax advice; consult a CPA.
Schools (NCES district)
- District
- Oak Grove Elementary
- NCES district ID
- 0627810
- Math proficiency
- 47% ▲ 1.00%
- Reading proficiency
- 54% ▬ 0.00%
- Median HH income
- $92,404
- Composite
- 49.23/100
- National rank
- #4382
- State rank
- #339 of 1400 in CA
Livability — San Jose
- Score
- 78/100
- State rank
- #68
- US rank
- #2559
Category grades
Schools grade is shown separately in the Schools card above.
Census & demographics
- Census place
- San Jose, CA
- County
- Santa Clara County · 1,806,974 people
- City population
- 954,479
- Metro
- San Jose-Sunnyvale-Santa Clara, CA
- Population (ZIP)
- 57,202
- Household income
- $101,435
- Rent vs Own
- Severe rent burden
- 1808.0
Population outlook (Santa Clara County) Hauer SSP2
- Today (2025)
- 2,179,074 people
- By 2030
- 2,301,297 · +5.6%
- By 2040
- 2,528,195 · +16.0%
- By 2050
- 2,712,135 · +24.5%
- By 2075
- 2,998,701 · +37.6%
- By 2100
- 2,931,429 · +34.5%
Race, ethnicity, and origin ACS 2023
- Neighborhood character
- Diverse neighborhood (Simpson 0.60)
- Race & ethnicity
- Hispanic / Latino 51% Asian 36% Two or more races 22% White 7% Native American 2% Black 2%
- Hispanic origin (detail)
- Mexican 46%
- Foreign-born
- 45% · Canada, Vietnam, China
- Languages at home
- 27% English-only · Spanish 40% Vietnamese 24% Chinese 3%
Political lean MEDSL · Santa Clara
- 2024 margin
- Solid D (+40.0) · D 68.1% · R 28.1% · Other 3.8%
- 2008→2024 swing
- -0.9pp no change · 2008: 40.9pp · 2024: 40.0pp
- All cycles
- 2024: D+40.0 2020: D+47.4 2016: D+52.5 2012: D+42.1 2008: D+40.9
Not yet ingested
- Civics
- —
Market trends
- HPI YoY
- ▼ -1144.74%
- Current HPI
- 339.7949
- Rent YoY
- ▲ 1.00%
- Metro
- San Jose-Sunnyvale-Santa Clara, CA
- State GDP YoY
- ▲ 3.21%
- F500 in state
- 116
Industry mix (Fortune 500 HQ in CA)
| Industry | F500 HQs | Revenue |
|---|---|---|
| Technology | 27 | $1,492B |
|
||
| Financial Services | 3 | $174B |
|
||
| Retail | 3 | $44B |
|
||
| Insurance | 3 | $26B |
|
||
| Media / Entertainment | 2 | $115B |
|
||
| Pharmaceuticals / Biotech | 2 | $62B |
|
||
Price history
+0.0% since first listed3 events — show timeline
- 2026-04-21 Listing Removed — bridgeMLS, Bay East AOR, or Contra Costa AOR
- 2026-04-21 Listed $329,000 MLSListings
- 2026-04-21 Listed $329,000 bridgeMLS, Bay East AOR, or Contra Costa AOR
Property tax history
-11.0%/yrLatest (2011): $262 · -13.9% YoY. Source: county tax records.
Cash-flow waterfall
monthlySold comps — $/sqft
last 12 mo · ≤1 miLoading sold comps…