 Duplex
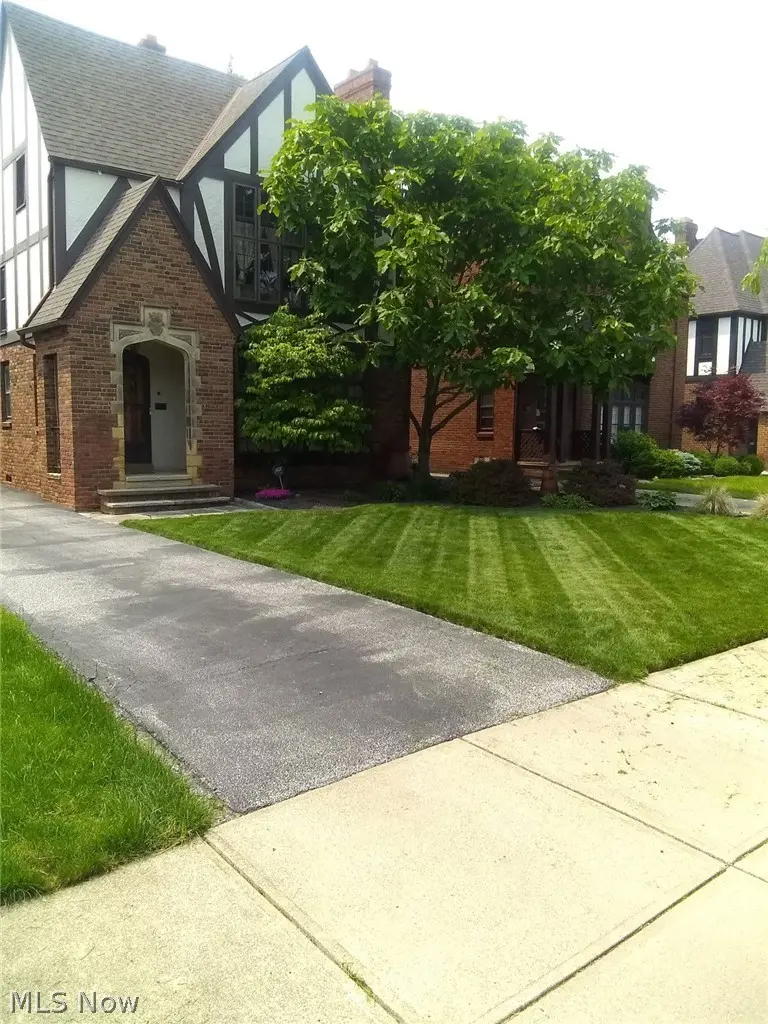
3646 Lynnfield Rd · Shaker Heights, OH
Flood risk 1/10 · Minimal
- FEMA flood zone
- X (unshaded)
- Chance of flooding over 30 yrs
- 0.0%
- Est. flood insurance / yr
- $507 – $1,088
Fire risk 1/10 · Minimal
- Est. fire insurance / yr
- $713 – $1,323
Heat risk 3/10 · Minor
- Hot days now (above 95°F)
- 7 days/yr
- Hot days in 30 yrs
- 17 days/yr
Wind risk 1/10 · Minimal
- Chance of severe wind over 30 yrs
- —
Air-quality risk 3/10 · Minor
- Unhealthy air days now
- 2 days/yr
- Unhealthy air days in 30 yrs
- 5 days/yr
Risk factors via First Street. Map © Google.
Why this score? — see what drove the D grade
The composite is a weighted blend of 9 inputs, each scored 0–100. Each bar is that input's sub-score; the figure is the points it added to the 100-point composite (weight × sub-score).
- Cash flow +16.4/30.0
- DSCR +5.1/10.0
- Schools +5.0/10.0
- Livability +4.5/5.0
- 1% rule +4.4/10.0
- Rent growth +2.8/5.0
- Condition / age +2.5/5.0
- ARV discount +0.0/15.0
- Appreciation +0.0/10.0
$389,500
🖨 Deal sheet (PDF) 📄 Offer letter ✓ Due diligence
Multi-family units
County records classify this as Multi-Family (2-4 Unit). Listing-text estimate: 2 units. confirmed
Listing remarks
What a fantastic opportunity to own a beautiful two-family property that exudes character throughout and has been lovingly maintained by the owner-occupied for many years. An excellent opportunity for an occupant owner looking to offset their mortgage with rental income or for an investor with interest in a strong rental market. First-floor unit is rented to a wonderful tenant who has lived there 3+ years with beautiful hardwood floors, decorative fireplace, large window, formal dining room with built-in cabinets. Second floor living room has a soaring vaulted beam ceiling, large window, decorative fireplace, and a Juliet loft area adding architectural charm, formal dining with built-in cab
Key facts
- Decorative fireplace
- Formal dining room
- Two family property
Tags
Property features AI
Exterior
- Parking: Detached garage; Three-car garage
- Utilities: Public water; Public sewer
- Home design: Shake siding exterior; Asphalt roof; Home warranty included
- Construction: Shake siding construction; Asphalt roof
- Exterior features: Lot approximately 0.1286 acres
Interior
- Bathrooms: Three full bathrooms
- Heating & cooling: Forced air heating; Ceiling fans for cooling
- Interior features: Unfinished basement
Neighborhood map
What this means for you Summary
Snapshot
- This is a 2 × 3-bed/1.5-bath units multifamily listed at $390k.
Deal economics
- At list price, monthly cash flow is $220 ($3k/yr) — positive. Per door: $110/mo.
- The deal already cash-flows at list — no discount required.
- To meet the 1% rule (rent ≥ 1% of price), the offer needs to be $366k (6.0% below list).
- Recommended offer: $366k (6.0% below list) — sets the bar for 1% rule.
- Cap rate 7.0% vs local median 2.5% in Shaker Heights — top-decile yield for the area; either an underpriced asset or a hidden risk that comps aren't pricing in. Stress-test before assuming the spread holds.
Location & tenants
- Location reads 89/100 on livability (#15 in OH, #134 nationally) — a professional / high-income tenant draw. Strengths: crime A+, commute A+, employment A+; Watch: amenities F.
- Shaker Heights City (suburban): math 50% / reading 63% proficiency, ranked #309 of 656 in OH (top 47%) — acceptable for families but not a draw, mixed tenant base, ~2y average lease.
- Zoned schools: Lomond Elementary School (math 47% / reading 42%, grade F, #991 of 1,584 statewide, top 64%, 372 students, 34% FRL); Shaker Hts Middle School (math 49% / reading 56%, grade C+, #378 of 654 statewide, top 59%, 651 students, 30% FRL); Shaker Hts High School (math 34% / reading 70%, grade D+, #343 of 781 statewide, top 47%, 1,498 students, 24% FRL) — zoned schools at 29% FRL track the district average.
- Market conditions: Rents rising (+1.1%/yr); 183 active listings in the ZIP; 3 comparable units currently listed for rent nearby; rentals at typical pace (median 18d on market — plan ~3-4 weeks tenant-placement turnaround); solid renter incomes; 1,441 units permitted in Cuyahoga County in 2024 (700 in 5+ unit buildings).
- This rent runs 43% of the median local income ($101k/yr) — at the standard rent-burdened threshold; future hikes will face affordability resistance.
Forward outlook
- Local home prices are declining (-3.0%/yr); year-one equity from $3k of loan paydown is wiped out by about $12k of value loss. Plan a longer hold.
- Cuyahoga County population projected to shrink 8% by 2050 — rents likely to lag national; underwrite the cash flow, not the appreciation.
Negotiation context
- It's been on market 26 days — a 2% lower offer ($384k) is reasonable based on typical stale-listing flexibility.
- 2 sale attempts since 27y ago with the ask held roughly flat each time — persistent listings suggest the price (not the market) is what's stuck; bring a comps-based counter.
- Current owner paid $153k; list at $390k implies a 155% gain — meaningful room to come down on a strong offer.
Risks & watch-outs
- Watch-outs: built in 1920 — expect roof / HVAC / electrical / plumbing capex.
Questions for the listing agent
- Can we see the unit-by-unit rent roll, current vacancy, and any below-market leases? What's the average tenancy length?
- What capital expenditures (roof, boiler, parking lot, exteriors) have been made in the last 5 years, and what's planned in the next 2?
- Built in 1920 — when were the roof, HVAC, electrical panel, plumbing, and water heater last replaced?
- Is there a deadline driving the sale (1031 exchange, divorce, estate, relocation)? That informs how much negotiation room exists.
- Schools are A-rated — typically a magnet for longer-tenancy family renters. What's the average tenant stay here, and is there a school-zone premium baked into asking?
- The area grade is low — what's the realistic commute time and amenity access for the typical tenant pool here? Any planned neighborhood developments (good or bad) we should know about?
- What's the average days-on-market for RENTAL listings here right now (not sales)? A rising rental-DOM trend means longer vacancies and softer asking-rent achievability than the comps imply.
- What's the recent tenant-quality profile in this submarket — average credit score on applications, eviction rate, late-payment / NSF rate, and stable-employment percentage? A property-management company in the area should have these aggregated.
- How much new apartment / multifamily construction is in the pipeline within 1–3 miles? Heavy new supply (>2% of stock underway) typically softens rents 12–24 months out; light construction supports rent growth.
Investment metrics
- 1% rule
- 0.94% ✗
- Cap rate
- 6.97%
- Cash-on-cash
- 2.43%
- DSCR
- 1.11
- GRM
- 8.9
CMA / ARV
- ARV (on-the-fly)
- $332,040
- Comps found
- 12
Show comp detail 12 sales within ~0.75 mi
| Address | Dist | Beds/Ba | Sqft | Sold | Price | $/sf | Match |
|---|---|---|---|---|---|---|---|
| 18424 Newell Rd | 0.23mi | 6/3.0 (+1) | 2,688 (-3%) | 9mo | $310,000 | $115 | 72 |
| 19406 Chagrin Blvd | 0.35mi | 6/4.0 (+1) | 2,942 (+6%) | 2mo | $352,000 | $120 | 63 |
| 3604 Normandy Rd | 0.51mi | 6/3.0 (+1) | 2,776 (+0%) | 10mo | $253,000 | $91 | 62 |
| 19829 Winslow Rd | 0.52mi | 6/4.0 (+1) | 2,846 (+3%) | 1mo | $319,000 | $112 | 61 |
| 19239 Winslow Rd | 0.42mi | 6/2.0 (+1) | 2,656 (-4%) | 5mo | $217,000 | $82 | 60 |
| 18520 Winslow Rd | 0.34mi | 6/2.0 (+1) | 2,542 (-8%) | 2mo | $331,600 | $130 | 60 |
| 3560 Avalon Rd | 0.65mi | 5/3.0 | 2,618 (-5%) | 6mo | $194,587 | $74 | 56 |
| 18427 Winslow Rd | 0.39mi | 6/3.0 (+1) | 2,424 (-12%) | 1mo | $334,000 | $138 | 55 |
| 3553 Ingleside Rd | 0.45mi | 6/4.0 (+1) | 2,923 (+6%) | 7mo | $375,000 | $128 | 55 |
| 3528 Daleford Rd | 0.61mi | 6/2.0 (+1) | 2,768 (0%) | 10mo | $233,000 | $84 | 54 |
| 19229 Winslow Rd | 0.41mi | 6/3.0 (+1) | 3,037 (+10%) | 7mo | $390,000 | $128 | 53 |
| 17424 Winslow Rd | 0.61mi | 6/3.0 (+1) | 2,498 (-10%) | 2mo | $365,000 | $146 | 48 |
Match score weights: distance 35% · size 25% · config 20% · recency 20%. Top-matched comps best support the ARV.
Projected returns pro-forma
-3.0% appreciation · 1.15% rent growth · sell at horizon
- IRR
- -14.5%
- Equity multiple
- 0.49×
- Total profit
- $-55,729
- Equity at exit
- $58,076
- IRR
- -9.2%
- Equity multiple
- 0.48×
- Total profit
- $-56,744
- Equity at exit
- $33,677
Cash invested: $109,060 (down + closing). Projections, not guarantees.
Landlord ↔ Tenant lean methodology
- Overall (STATE)
- 73 Landlord-Friendly
- State Ohio
- 73 Landlord-Friendly · R+6
- County
- — inherits STATE
- City
- — inherits STATE
ZIP-level market 44122
- Rents YoY
- 1.1%
- Active inventory
- 183
- Price-to-rent
- 17.7×
Monthly cashflow live
- Estimated rent
- $3,663 high interval (Pro) →
- Mortgage (P&I)
- −$2,043
- Tax from tax record
- −$468 /mo · $5,622/yr
- Insurance
- −$162
- HOA
- −$0
- Vacancy / Maint / Mgmt
- −$769
- Net cashflow
- $220
Break-even live
Sensitivity live
| Price | -10% $441 | -5% $331 | +0% $220 | +5% $110 | +10% $0 |
|---|---|---|---|---|---|
| Rent | -10% $-69 | -5% $76 | +0% $220 | +5% $365 | +10% $510 |
| Rate | -1.0pp $417 | -0.5pp $319 | base $220 | +0.5pp $119 | +1.0pp $17 |
2-unit breakdown (identical units grouped — click to expand)
| Units | Beds | Baths | Est. rent |
|---|---|---|---|
| 2× units | 3 | 1.5 | $3,662 |
| #1 | 3 | 1.5 | $1,831 |
| #2 | 3 | 1.5 | $1,831 |
| Total (2 units) | $3,663 | ||
UW: 25.0% down · 7.5% · 30yr · 1.5% tax · 5.0% vac · 8.0% maint · 8.0% mgmt
Financing live
Cash to close
- Down payment
- $97,375
- Closing costs
- $11,685
- Reserves months
- —
- Total cash needed
- —
Loan-product check · same deal, 3 products live
Conventional
25% down · 7.5% · 30yr
- Down + closing
- —
- Monthly P&I
- —
- Monthly cashflow
- —
- DSCR
- —
- Eligible?
- —
Personal DTI + credit; lowest rate.
DSCR
20% down · 8.5% · 30yr
- Down + closing
- —
- Monthly P&I
- —
- Monthly cashflow
- —
- DSCR
- —
- Eligible?
- —
No personal income docs; deal must DSCR.
Hard money
10% down · 12.0% · 12mo
- Down + closing
- —
- Monthly P&I
- —
- Monthly cashflow
- —
- DSCR
- —
- Eligible?
- —
Short-term bridge; refi at stabilization.
Rent comps 3 comps
| Address | Beds | Baths | Sqft | Rent | $/sqft | DOM | Units | Dist |
|---|---|---|---|---|---|---|---|---|
| 19601 Van Aken Blvd Shaker Heights, OH | 1.0–4.0 | 1.0–4.0 | 1977 | $4,400 | $2.23 | 23d | 1 | 0.58mi |
| 17424 Winslow Rd Cleveland, OH | 4.0 | 2.0 | 1995 | $2,200 | $1.10 | 18d | 1 | 0.64mi |
| 2975 Claremont Rd Shaker Heights, OH | 5.0 | 3.0 | 3241 | $3,200 | $0.99 | 13d | 1 | 1.06mi |
Listing history 20 events
-
2026-06-21days on market $389,500 Active 26 DOM
-
2026-06-18days on market $389,500 Active 23 DOM
-
2026-06-17days on market $389,500 Active 22 DOM
-
2026-06-16days on market $389,500 Active 21 DOM
-
2026-06-15days on market $389,500 Active 20 DOM
-
2026-06-13days on market $389,500 Active 18 DOM
-
2026-06-13days on market $389,500 Active 17 DOM
-
2026-06-09days on market $389,500 Active 14 DOM
-
2026-06-08days on market $389,500 Active 13 DOM
-
2026-06-07days on market $389,500 Active 12 DOM
-
2026-06-03days on market $389,500 Active 8 DOM
-
2026-06-02days on market $389,500 Active 7 DOM
-
2026-06-01days on market $389,500 Active 6 DOM
-
2026-05-31days on market $389,500 Active 5 DOM
-
2026-05-26$389,500 Active
-
1999-07-29soldstatus $153,000
-
1999-07-29soldstatus $153,000
-
1999-06-12$159,750
-
1987-06-29soldstatus $98,000
-
1978-02-01soldstatus $68,500
ⓘ Source: listings_history table (triggers on properties + properties_extension) + one-shot
backfill from property_details.listing_events for pre-trigger history.
Tax reassessment forecast OH · Partial reset (capped growth)
- Current annual tax
- $5,622 · $468/mo
- Projected year-2 tax
- $5,849 · $487/mo
- Expected delta
- +$227/yr (+$19/mo · 4.0%)
ⓘ Screening estimate from a state-policy table — verify with the county assessor before closing.
Climate risk First Street
- Flood 1/10 Low FEMA zone X (unshaded) · 0% chance over 30 yrs
- Wildfire 1/10 Low
- Heat 3/10 Moderate 7 d/yr ≥95°F today · 17 d/yr by 30 yrs out
- Wind 1/10 Low
- Air quality 3/10 Moderate 2 unhealthy d/yr today · 5 by 30 yrs out
Nearby sold comps map
Loading sold comps map…
Walkable amenities ~0.75 mi
Loading nearby amenities…
Taxation est. · year 1
- Rental income
- $43,956
- − Mortgage interest
- −$21,818
- − Property taxes
- −$5,622
- − Insurance
- −$1,948
- − Repairs & maintenance
- −$3,516
- − Management
- −$3,516
- − Depreciation
- −$11,331
- Taxable loss
- −$3,795
- Est. tax savings @ 24.0%
- +$911
- After-tax cash flow
- $3,556/yr
For passive investors: Depreciation is non-cash, so a rental often shows a tax loss while cash-flowing — sheltering income. Rental losses are passive: they offset passive income freely, and up to $25,000/yr can offset ordinary (W-2) income if you actively participate and your MAGI is under $100k (phasing out to $0 by $150k); unused losses carry forward. On sale, claimed depreciation is recaptured at up to 25%, and gains may owe capital-gains tax (a 1031 exchange can defer both). Figures are a year-1 estimate at your 24.0% rate — not tax advice; consult a CPA.
Schools (NCES district)
- District
- Shaker Heights City
- NCES district ID
- 3904475
- Math proficiency
- 50% ▼ -16.00%
- Reading proficiency
- 63% ▼ -6.00%
- Median HH income
- $69,421
- Composite
- 49.98/100
- National rank
- #1928
- State rank
- #309 of 656 in OH
Livability — Shaker Heights
- Score
- 89/100
- State rank
- #15
- US rank
- #134
Category grades
Schools grade is shown separately in the Schools card above.
Census & demographics
- Census place
- Shaker Heights, OH
- County
- Cuyahoga County · 1,090,369 people
- City population
- 69,880
- Metro
- Cleveland-Elyria, OH
- Population (ZIP)
- 36,678
- Household income
- $101,230
- Rent vs Own
- Severe rent burden
- 1294.0
Population outlook (Cuyahoga County) Hauer SSP2
- Today (2025)
- 1,244,621 people
- By 2030
- 1,230,093 · -1.2%
- By 2040
- 1,189,108 · -4.5%
- By 2050
- 1,145,706 · -7.9%
- By 2075
- 1,076,557 · -13.5%
- By 2100
- 978,987 · -21.3%
Race, ethnicity, and origin ACS 2023
- Neighborhood character
- Diverse neighborhood (Simpson 0.59)
- Race & ethnicity
- White 56% Black 29% Asian 6% Two or more races 6% Hispanic / Latino 3%
- Common ancestry
- Romanian 6% Scotch-Irish 5% Italian 2%
- Foreign-born
- 12% · Canada, China
- Languages at home
- 85% English-only · Spanish 3% Other Indo-European 3% Chinese 2%
Political lean MEDSL · Cuyahoga
- 2024 margin
- Solid D (+31.5) · D 65.4% · R 33.9%
- 2008→2024 swing
- -7.4pp toward R · 2008: 38.9pp · 2024: 31.5pp
- All cycles
- 2024: D+31.5 2020: D+34.1 2016: D+35.0 2012: D+38.7 2008: D+38.9
Not yet ingested
- Civics
- —
Market trends
- HPI YoY
- ▼ -268.81%
- Current HPI
- 200.5087
- Rent YoY
- ▲ 1.15%
- Metro
- Cleveland-Elyria, OH
- State GDP YoY
- ▲ 1.98%
- F500 in state
- 48
Industry mix (Fortune 500 HQ in OH)
| Industry | F500 HQs | Revenue |
|---|---|---|
| Insurance | 3 | $145B |
|
||
| Industrial Machinery | 3 | $49B |
|
||
| Financial Services | 3 | $24B |
|
||
| Consumer Goods | 2 | $93B |
|
||
| Aerospace / Defense | 2 | $47B |
|
||
| Utilities | 2 | $33B |
|
||
Price history
+468.6% since first listed6 events — show timeline
- 2026-05-26 Listed $389,500 MLSNOW
- 1999-07-29 Sold (Public Records) $153,000 Public Records
- 1999-07-29 Sold (MLS) $153,000 MLSNOW
- 1999-06-12 Listed $159,750 MLSNOW
- 1987-06-29 Sold (Public Records) $98,000 Public Records
- 1978-02-01 Sold (Public Records) $68,500 Public Records
Property tax history
+0.6%/yrLatest (2025): $5,622 · +12.6% YoY. Source: county tax records.
Cash-flow waterfall
monthlySold comps — $/sqft
last 12 mo · ≤1 miLoading sold comps…