70200 10th St · Abita Springs, LA
Flood risk 1/10 · Minimal
- FEMA flood zone
- X
- Chance of flooding over 30 yrs
- 0.0%
- Est. flood insurance / yr
- $507 – $1,088
Fire risk 4/10 · Minor
- Est. fire insurance / yr
- $1,269 – $2,357
Heat risk 9/10 · Severe
- Hot days now (above 109°F)
- 7 days/yr
- Hot days in 30 yrs
- 21 days/yr
Wind risk 9/10 · Severe
- Chance of severe wind over 30 yrs
- 99.0%
Air-quality risk 2/10 · Minimal
- Unhealthy air days now
- 0 days/yr
- Unhealthy air days in 30 yrs
- 1 days/yr
Risk factors via First Street. Map © Google.
Why this score? — see what drove the D grade
The composite is a weighted blend of 9 inputs, each scored 0–100. Each bar is that input's sub-score; the figure is the points it added to the 100-point composite (weight × sub-score).
- Cash flow +13.6/30.0
- ARV discount +5.6/15.0
- Schools +4.3/10.0
- DSCR +4.1/10.0
- Livability +3.9/5.0
- Rent growth +3.6/5.0
- 1% rule +2.7/10.0
- Condition / age +2.5/5.0
- Appreciation +0.0/10.0
$230,000
🖨 Deal sheet (PDF) 📄 Offer letter ✓ Due diligence
Listing remarks MLS
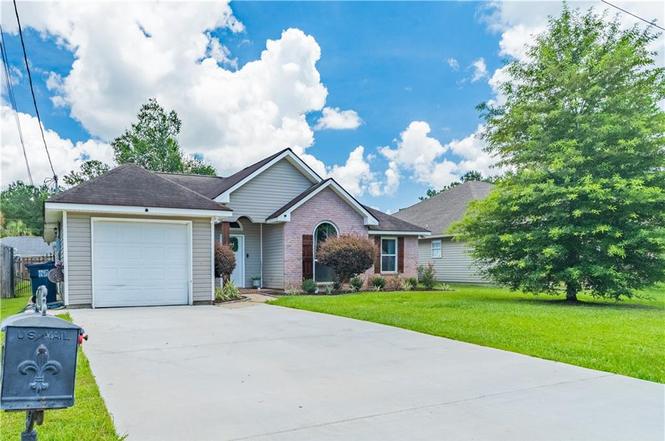
Welcome to this inviting 3-bedroom, 2-bathroom home on a quiet street in Covington. Brand new windows with a lifetime transferable warranty. Paint and flooring allowance! Filled with natural light, the open living area offers comfortable everyday living and an easy flow for entertaining. The thoughtfully updated kitchen features ample counter space and a functional layout, while the bedrooms provide a calm retreat with generous storage. The main bedroom offers a sitting area and relaxing yard views. The guest bath features a farmhouse-style bathroom complete with wainscotting, new vanity and fixtures. Step outside to a spacious backyard with a covered patio and room to garden, play, or relax. Located just minutes from downtown Covington, shopping, dining, and local parks, this home combines convenience with the charm of the Northshore. A great opportunity to enjoy comfortable living in a well-loved community. BRING ALL OFFERS!
Key facts
- Spacious backyard
- Generous storage
- Covered patio
Tags
Property features AI
Exterior
- Parking: Attached garage with one space and garage door opener
- Utilities: Public water; Public sewer; Central heating; Central air conditioning
- Home design: Single-story; Very good condition
- Construction: Brick and vinyl siding exterior; Shingle roof; Slab foundation; Built with traditional construction materials
- Exterior features: Fenced yard; Concrete covered patio
Interior
- Kitchen: Dishwasher; Microwave; Oven; Range; Stainless steel appliances
- Bedrooms: Total of 5 rooms (bedroom count not specified separately)
- Bathrooms: 2 full bathrooms
- Interior features: Attic; Ceiling fans; Pantry; Pull-down attic stairs; Stainless steel appliances; Wood-burning fireplace
- Laundry & utility: Washer hookup; Dryer hookup
Neighborhood map
What this means for you Summary
Snapshot
- This is a 3-bed/2.0-bath single-family listed at $230k.
Deal economics
- At list price, monthly cash flow is $14 ($162/yr) — positive.
- The deal already cash-flows at list — no discount required.
- To meet the 1% rule (rent ≥ 1% of price), the offer needs to be $177k (22.9% below list).
- Recommended offer: $177k (22.9% below list) — sets the bar for 1% rule.
- Cap rate 6.4% vs local median 3.6% in Abita Springs — top-decile yield for the area; either an underpriced asset or a hidden risk that comps aren't pricing in. Stress-test before assuming the spread holds.
Location & tenants
- Location reads 77/100 on livability (#11 in LA, #3,024 nationally) — a middle-class / working-renter tenant base. Strengths: crime A+, cost of living A+, housing A+; Watch: amenities F, commute F.
- St. Tammany Parish (suburban): math 43% / reading 55% proficiency, ranked #11 of 98 in LA (top 11%) — families likely to look elsewhere, expect single-tenant / working-renter base with shorter leases.
- Zoned schools: E. E. Lyon Elementary School (math 57% / reading 57%, grade C+, #79 of 646 statewide, top 13%, 662 students, 63% FRL); Fontainebleau Junior High School (math 38% / reading 62%, grade C, #26 of 218 statewide, top 12%, 877 students, 37% FRL); Fontainebleau High School (math 56% / reading 61%, grade C, #23 of 265 statewide, top 9%, 1,677 students, 33% FRL) — zoned schools at 44% FRL track the district average.
- Market conditions: Rents rising fast (+4.3%/yr); 530 active listings in the ZIP; 21 comparable units currently listed for rent nearby; rentals at typical pace (median 26d on market — plan ~3-4 weeks tenant-placement turnaround); solid renter incomes; 1,064 units permitted in St. Tammany Parish in 2024 (0 in 5+ unit buildings).
Forward outlook
- Local home prices are declining (-3.0%/yr); year-one equity from $2k of loan paydown is wiped out by about $7k of value loss. Plan a longer hold.
- St. Tammany County population projected at +27% by 2050 — long-run rental-demand tailwind backs the buy-and-hold thesis.
Negotiation context
- Only 10 days on market — expect competitive offers; lowballing is unlikely to land.
- 12 sale attempts since 21y ago with the ask held roughly flat each time — persistent listings suggest the price (not the market) is what's stuck; bring a comps-based counter.
- Current owner paid $148k; list at $230k implies a 55% gain — meaningful room to come down on a strong offer.
Risks & watch-outs
- Climate carrying-cost: severe wind risk, 99% chance of damaging wind over 30y; extreme-heat days projected 7→21/yr by 2055 (HVAC capex compounding) — expect insurance premiums to compound above CPI over the hold.
Questions for the listing agent
- Is there a deadline driving the sale (1031 exchange, divorce, estate, relocation)? That informs how much negotiation room exists.
- Schools are A-rated — typically a magnet for longer-tenancy family renters. What's the average tenant stay here, and is there a school-zone premium baked into asking?
- The area grade is low — what's the realistic commute time and amenity access for the typical tenant pool here? Any planned neighborhood developments (good or bad) we should know about?
- What's the average days-on-market for RENTAL listings here right now (not sales)? A rising rental-DOM trend means longer vacancies and softer asking-rent achievability than the comps imply.
- What's the recent tenant-quality profile in this submarket — average credit score on applications, eviction rate, late-payment / NSF rate, and stable-employment percentage? A property-management company in the area should have these aggregated.
- How much new for-sale + rental construction is in the pipeline within 1–3 miles? Heavy new supply typically softens prices + rents 12–24 months out; constrained supply supports both.
Investment metrics
- 1% rule
- 0.77% ✗
- Cap rate
- 6.36%
- Cash-on-cash
- 0.25%
- DSCR
- 1.01
- GRM
- 10.8
CMA / ARV
- ARV (on-the-fly)
- $220,545
- Comps found
- 12
Show comp detail 12 sales within ~0.75 mi
| Address | Dist | Beds/Ba | Sqft | Sold | Price | $/sf | Match |
|---|---|---|---|---|---|---|---|
| 70311 11th St | 0.21mi | 3/2.0 | 1,335 (+2%) | 3mo | $235,000 | $176 | 84 |
| 70151 4th St | 0.33mi | 3/2.0 | 1,325 (+2%) | 3mo | $244,500 | $185 | 79 |
| 70323 10th St | 0.37mi | 3/2.0 | 1,368 (+5%) | 3mo | $215,000 | $157 | 72 |
| 70312 7th St | 0.32mi | 3/2.0 | 1,410 (+8%) | 2mo | $224,000 | $159 | 70 |
| 70076 6th St | 0.26mi | 3/2.0 | 1,151 (-12%) | 3mo | $163,250 | $142 | 66 |
| 70371 10th St | 0.46mi | 3/2.0 | 1,212 (-7%) | 2mo | $192,500 | $159 | 65 |
| 711 Lionel Ct | 0.22mi | 3/2.0 | 1,497 (+15%) | 2mo | $270,000 | $180 | 64 |
| 70432 2nd St | 0.63mi | 3/2.0 | 1,347 (+3%) | 2mo | $227,500 | $169 | 64 |
| 21473 Soell Dr | 0.73mi | 3/2.0 | 1,250 (-4%) | 1mo | $289,000 | $231 | 58 |
| 70408 3rd St | 0.58mi | 3/2.0 | 1,163 (-11%) | 1mo | $205,000 | $176 | 54 |
| 300 Lionel Ct | 0.53mi | 3/2.0 | 1,486 (+14%) | 3mo | $245,000 | $165 | 50 |
| 70281 C St | 0.67mi | 3/2.0 | 1,463 (+12%) | 2mo | $215,000 | $147 | 47 |
Match score weights: distance 35% · size 25% · config 20% · recency 20%. Top-matched comps best support the ARV.
Projected returns pro-forma
-3.0% appreciation · 4.31% rent growth · sell at horizon
- IRR
- -14.7%
- Equity multiple
- 0.47×
- Total profit
- $-34,136
- Equity at exit
- $34,294
- IRR
- -4.3%
- Equity multiple
- 0.70×
- Total profit
- $-19,026
- Equity at exit
- $19,886
Cash invested: $64,400 (down + closing). Projections, not guarantees.
Landlord ↔ Tenant lean methodology
- Overall (STATE)
- 90 Strongly Landlord-Friendly
- State Louisiana
- 90 Strongly Landlord-Friendly · R+12
- County
- — inherits STATE
- City
- — inherits STATE
ZIP-level market 70433
- Rents YoY
- 4.3%
- Active inventory
- 530
- Price-to-rent
- 10.8×
Monthly cashflow live
- Estimated rent
- $1,774 high interval (Pro) →
- Mortgage (P&I)
- −$1,206
- Tax from tax record
- −$86 /mo · $1,033/yr
- Insurance
- −$96
- HOA
- −$0
- Vacancy / Maint / Mgmt
- −$373
- Net cashflow
- $14
Break-even live
Sensitivity live
| Price | -10% $144 | -5% $79 | +0% $14 | +5% $-52 | +10% $-117 |
|---|---|---|---|---|---|
| Rent | -10% $-127 | -5% $-57 | +0% $14 | +5% $84 | +10% $154 |
| Rate | -1.0pp $129 | -0.5pp $72 | base $14 | +0.5pp $-46 | +1.0pp $-107 |
UW: 25.0% down · 7.5% · 30yr · 1.5% tax · 5.0% vac · 8.0% maint · 8.0% mgmt
Financing live
Cash to close
- Down payment
- $57,500
- Closing costs
- $6,900
- Reserves months
- —
- Total cash needed
- —
Loan-product check · same deal, 3 products live
Conventional
25% down · 7.5% · 30yr
- Down + closing
- —
- Monthly P&I
- —
- Monthly cashflow
- —
- DSCR
- —
- Eligible?
- —
Personal DTI + credit; lowest rate.
DSCR
20% down · 8.5% · 30yr
- Down + closing
- —
- Monthly P&I
- —
- Monthly cashflow
- —
- DSCR
- —
- Eligible?
- —
No personal income docs; deal must DSCR.
Hard money
10% down · 12.0% · 12mo
- Down + closing
- —
- Monthly P&I
- —
- Monthly cashflow
- —
- DSCR
- —
- Eligible?
- —
Short-term bridge; refi at stabilization.
Rent comps 21 comps
| Address | Beds | Baths | Sqft | Rent | $/sqft | DOM | Units | Dist |
|---|---|---|---|---|---|---|---|---|
| 70096 10th St Covington, LA | 3.0 | 2.0 | 1391 | $1,950 | $1.40 | 19d | 1 | 0.20mi |
| 70252 8th St Covington, LA | 3.0 | 2.0 | 1230 | $1,650 | $1.34 | 25d | 1 | 0.21mi |
| 711 Lionel Ct Abita Springs, LA | 3.0 | 2.0 | 1497 | $2,000 | $1.34 | 25d | 1 | 0.22mi |
| 21096 Washington Ave Unit B Abita Springs, LA | 2.0 | 1.5 | 900 | $1,050 | $1.17 | 45d | 1 | 0.22mi |
| 70266 7th St Covington, LA | 3.0 | 2.0 | 1736 | $1,575 | $0.91 | 45d | 1 | 0.27mi |
| 70076 6th St Covington, LA | 3.0 | 2.0 | 1151 | $1,600 | $1.39 | 25d | 1 | 0.28mi |
| 70300 7th St Covington, LA | 3.0 | 2.0 | 1448 | $1,750 | $1.21 | 25d | 1 | 0.32mi |
| 70293 7th St Covington, LA | 3.0 | 2.0 | 1450 | $1,695 | $1.17 | 45d | 1 | 0.33mi |
| 70045 3rd St Covington, LA | 3.0 | 2.0 | 1430 | $1,750 | $1.22 | 5d | 1 | 0.47mi |
| 70371 10th St Covington, LA | 3.0 | 2.0 | 1212 | $1,695 | $1.40 | 45d | 1 | 0.47mi |
| 70040 2nd St Covington, LA | 3.0 | 2.0 | 1416 | $2,000 | $1.41 | 5d | 1 | 0.49mi |
| 70439 8th St Covington, LA | 3.0 | 2.0 | 1267 | $1,500 | $1.18 | 25d | 1 | 0.56mi |
| 70330 A St Covington, LA | 3.0 | 2.0 | 1163 | $1,600 | $1.38 | 21d | 1 | 0.62mi |
| 70412 1st St Covington, LA | 3.0 | 2.0 | 1182 | $1,700 | $1.44 | 19d | 1 | 0.68mi |
| 70466 1st St Covington, LA | 3.0 | 2.0 | 1443 | $2,100 | $1.46 | 19d | 1 | 0.75mi |
| 70361 D St Covington, LA | 3.0 | 2.0 | 1409 | $1,750 | $1.24 | 25d | 1 | 0.80mi |
| 114 Lazy Creek Dr Mandeville, LA | 3.0 | 2.0 | 1434 | $2,100 | $1.46 | 45d | 1 | 1.06mi |
| 70403 L St Covington, LA | 3.0 | 2.0 | 1250 | $1,695 | $1.36 | 45d | 1 | 1.17mi |
| 4025 Monarch Ln Covington, LA | 3.0 | 2.0 | 1853 | $2,800 | $1.51 | 45d | 1 | 1.20mi |
| 350 Emerald Forest Blvd Covington, LA | 1.0–2.0 | 1.0–2.0 | 845 | $1,600 | $1.89 | 13d | 2 | 1.22mi |
| 28 Park Place Dr Covington, LA | 1.0–3.0 | 1.0–2.0 | 963 | $1,407 | $1.46 | 3d | 9 | 1.23mi |
Listing history 7 events
-
2026-06-21days on market $230,000 Active 10 DOM
-
2026-06-18days on market $230,000 Active 7 DOM
-
2026-06-17days on market $230,000 Active 6 DOM
-
2026-06-16days on market $230,000 Active 5 DOM
-
2026-06-15days on market $230,000 Active 4 DOM
-
2026-06-13remarks 699-char remark
-
2026-06-13$230,000 Active 2 DOM
ⓘ Source: listings_history table (triggers on properties + properties_extension) + one-shot
backfill from property_details.listing_events for pre-trigger history.
Tax reassessment forecast LA · Resets to sale price
- Current annual tax
- $1,033 · $86/mo
- Projected year-2 tax
- $1,265 · $105/mo
- Expected delta
- +$232/yr (+$19/mo · 22.5%)
ⓘ Screening estimate from a state-policy table — verify with the county assessor before closing.
Climate risk First Street
- Flood 1/10 Low FEMA zone X · 0% chance over 30 yrs
- Wildfire 4/10 Moderate
- Heat 9/10 Extreme 7 d/yr ≥109°F today · 21 d/yr by 30 yrs out
- Wind 9/10 Extreme 99% chance of damaging wind over 30 yrs
- Air quality 2/10 Low 0 unhealthy d/yr today · 1 by 30 yrs out
Nearby sold comps map
Loading sold comps map…
Walkable amenities ~0.75 mi
Loading nearby amenities…
Taxation est. · year 1
- Rental income
- $21,289
- − Mortgage interest
- −$12,884
- − Property taxes
- −$1,033
- − Insurance
- −$1,150
- − Repairs & maintenance
- −$1,703
- − Management
- −$1,703
- − Depreciation
- −$6,691
- Taxable loss
- −$3,874
- Est. tax savings @ 24.0%
- +$930
- After-tax cash flow
- $1,092/yr
For passive investors: Depreciation is non-cash, so a rental often shows a tax loss while cash-flowing — sheltering income. Rental losses are passive: they offset passive income freely, and up to $25,000/yr can offset ordinary (W-2) income if you actively participate and your MAGI is under $100k (phasing out to $0 by $150k); unused losses carry forward. On sale, claimed depreciation is recaptured at up to 25%, and gains may owe capital-gains tax (a 1031 exchange can defer both). Figures are a year-1 estimate at your 24.0% rate — not tax advice; consult a CPA.
Schools (NCES district)
- District
- St. Tammany Parish
- NCES district ID
- 2201650
- Math proficiency
- 43% ▼ -32.00%
- Reading proficiency
- 55% ▼ -26.00%
- Median HH income
- $61,752
- Composite
- 43.04/100
- National rank
- #3098
- State rank
- #11 of 98 in LA
Livability — Abita Springs
- Score
- 77/100
- State rank
- #11
- US rank
- #3024
Category grades
Schools grade is shown separately in the Schools card above.
Census & demographics
- County
- Saint Tammany Parish · 228,296 people
- Metro
- New Orleans-Metairie, LA
- Population (ZIP)
- 41,876
- Household income
- $81,241
- Rent vs Own
- Severe rent burden
- 1287.0
Population outlook (St. Tammany County) Hauer SSP2
- Today (2025)
- 286,725 people
- By 2030
- 304,175 · +6.1%
- By 2040
- 336,203 · +17.3%
- By 2050
- 364,590 · +27.2%
- By 2075
- 433,362 · +51.1%
- By 2100
- 470,333 · +64.0%
Race, ethnicity, and origin ACS 2023
- Neighborhood character
- Predominantly White (78%)
- Race & ethnicity
- White 78% Black 9% Hispanic / Latino 7% Two or more races 7% Native American 1% Asian 1%
- Hispanic origin (detail)
- Mexican 2%
- Common ancestry
- Lithuanian 17% Italian 2% Slovak 2%
- Foreign-born
- 5% · Canada, Vietnam
- Languages at home
- 92% English-only · Spanish 5% French/Haitian/Cajun 1% Vietnamese 1%
Political lean MEDSL · St. Tammany
- 2024 margin
- Solid R (+43.8) · D 27.3% · R 71.1% · Other 1.6%
- 2008→2024 swing
- +9.6pp toward D · 2008: -53.4pp · 2024: -43.8pp
- All cycles
- 2024: R+43.8 2020: R+44.2 2016: R+50.8 2012: R+52.2 2008: R+53.4
Not yet ingested
- Civics
- —
Market trends
- HPI YoY
- ▼ -112.14%
- Current HPI
- 181.8348
- Rent YoY
- ▲ 4.31%
- Metro
- New Orleans-Metairie, LA
- State GDP YoY
- ▲ 3.29%
- F500 in state
- 10
Industry mix (Fortune 500 HQ in LA)
| Industry | F500 HQs | Revenue |
|---|---|---|
| Telecommunications | 2 | $23B |
|
||
| Utilities | 1 | $12B |
|
||
| Wholesale / Distribution | 1 | $5B |
|
||
| Advertising | 1 | $2B |
|
||
Price history
+142.1% since first listed19 events — show timeline
- 2026-06-11 Listed $230,000 GSREIN
- 2026-06-11 Listed $230,000 AcadianaMLS
- 2015-03-09 Sold (Public Records) $148,000 Public Records
- 2015-03-05 Sold (MLS) $148,000 GSREIN
- 2013-06-20 Listed $150,000 AcadianaMLS
- 2013-06-20 Listed $150,000 GSREIN
- 2012-09-12 Listed $163,500 GSREIN
- 2012-09-12 Listed $163,500 AcadianaMLS
- 2011-08-22 Listed $189,000 GSREIN
- 2011-08-22 Listed $189,000 AcadianaMLS
- 2006-09-25 Sold (Public Records) $168,900 Public Records
- 2006-09-15 Sold (MLS) $168,900 GSREIN
- 2006-08-21 Listed $168,900 AcadianaMLS
- 2006-08-21 Listed $168,900 GSREIN
- 2005-07-14 Sold (Public Records) $126,000 Public Records
- 2005-06-29 Sold (MLS) $126,000 GSREIN
- 2005-04-23 Listed $124,900 AcadianaMLS
- 2005-04-23 Listed $124,900 GSREIN
- 2000-08-09 Sold (Public Records) $95,000 Public Records
Property tax history
-4.7%/yrLatest (2025): $1,033 · -3.5% YoY. Source: county tax records.
Cash-flow waterfall
monthlySold comps — $/sqft
last 12 mo · ≤1 miLoading sold comps…