911 Main St · Winthrop, ME
Flood risk 1/10 · Minimal
- FEMA flood zone
- X (unshaded)
- Chance of flooding over 30 yrs
- 0.0%
- Est. flood insurance / yr
- $507 – $1,088
Fire risk 1/10 · Minimal
- Est. fire insurance / yr
- $669 – $1,243
Heat risk 3/10 · Minor
- Hot days now (above 93°F)
- 7 days/yr
- Hot days in 30 yrs
- 16 days/yr
Wind risk 4/10 · Minor
- Chance of severe wind over 30 yrs
- 13.0%
Air-quality risk 2/10 · Minimal
- Unhealthy air days now
- 1 days/yr
- Unhealthy air days in 30 yrs
- 1 days/yr
Risk factors via First Street. Map © Google.
Why this score? — see what drove the F grade
The composite is a weighted blend of 9 inputs, each scored 0–100. Each bar is that input's sub-score; the figure is the points it added to the 100-point composite (weight × sub-score).
- Appreciation +10.0/10.0
- Schools +7.2/10.0
- Cash flow +6.4/30.0
- Livability +3.5/5.0
- Rent growth +2.5/5.0
- Condition / age +2.5/5.0
- 1% rule +0.8/10.0
- DSCR +0.7/10.0
- ARV discount +0.0/15.0
$225,000
🖨 Deal sheet (PDF) 📄 Offer letter ✓ Due diligence
Listing remarks
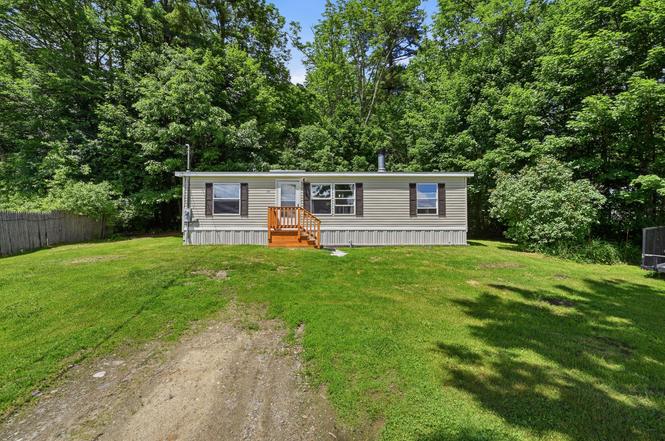
Welcome to this inviting 3-bedroom, 2-bath home nestled on nearly a half-acre of beautifully landscaped land in peaceful Monmouth. Tucked away in a private, wooded setting, this property offers the perfect blend of comfort, charm, and convenience. Step inside to a warm and welcoming family room highlighted by a cozy fireplace, ideal for relaxing evenings at home. The thoughtful layout provides comfortable living spaces, while the well-maintained grounds create a serene outdoor atmosphere you'll appreciate in every season. Enjoy the privacy of the wooded backdrop while still being conveniently located near local amenities, schools, and commuter routes. This home offers the kind of setting th
Key facts
- Private backdrop
- Wooded setting
- Cozy fireplace
Tags
Property features AI
Exterior
- Parking: Gravel parking with space for 1–4 vehicles
- Utilities: Public water; Public sewer
- Home design: Mobile home; Single-story
- Construction: Vinyl siding; Shingle roof; Slab foundation; Built in 2006
- Exterior features: Rural, wooded setting; Paved road access
Interior
- Kitchen: Electric range; Microwave; Refrigerator
- Bedrooms: Three bedrooms, all on the first floor
- Flooring: Carpet; Laminate
- Bathrooms: Two full bathrooms
- Heating & cooling: Forced air heating; Circuit breaker electric service
- Interior features: One-floor living with a first-floor bedroom layout; Family room; Has fireplace
- Laundry & utility: Washer; Dryer; Water heater tied to heating system
Neighborhood map
What this means for you Summary
Snapshot
- This is a 3-bed/2.0-bath manufactured listed at $225k.
Deal economics
- At list price, monthly cash flow is $-390 ($-5k/yr) — negative.
- To cash-flow at today's rent, offer at most $156k (30.6% below list).
- To meet the 1% rule (rent ≥ 1% of price), the offer needs to be $131k (41.8% below list).
- Recommended offer: $131k (41.8% below list) — sets the bar for 1% rule.
- Cap rate 4.2% vs local median 2.2% in Winthrop — top-decile yield for the area; either an underpriced asset or a hidden risk that comps aren't pricing in. Stress-test before assuming the spread holds.
Location & tenants
- Location reads 69/100 on livability (#76 in ME) — a middle-class / working-renter tenant base. Strengths: crime A+, cost of living A, housing A; Watch: health & safety C-, employment D, amenities F.
- RSU 02 (rural): math 83% / reading 87% proficiency, ranked #52 of 112 in ME (top 46%) — strong family-tenant draw, lease renewals of 3-5y typical.
- Zoned schools: Richmond Middle School (math 77% / reading 82%, grade A+, #63 of 85 statewide, top 77%, 107 students, 36% FRL) — zoned schools at 36% FRL track the district average.
- Market conditions: 19 active listings in the ZIP; 460 units permitted in Kennebec County in 2024 (0 in 5+ unit buildings).
Forward outlook
- In year one you build about $24k of equity ($2k loan paydown + $22k appreciation (10.0% local appreciation)).
- Kennebec County population projected at -17% by 2050 — secular population decline; favor cash flow + early exit over multi-decade hold.
- By year 2, paydown + projected appreciation supports a ~$39k cash-out refi (75% LTV) — recoverable capital for the next deal without selling this one.
Negotiation context
- Only 2 days on market — expect competitive offers; lowballing is unlikely to land.
- Current owner paid $20k; list at $225k implies a 1025% gain — meaningful room to come down on a strong offer.
Questions for the listing agent
- What do current leases actually rent for vs. the listed asking? Can we see a recent rent roll and the last 12 months of T-12 income?
- Is there a deadline driving the sale (1031 exchange, divorce, estate, relocation)? That informs how much negotiation room exists.
- The area grade is low — what's the realistic commute time and amenity access for the typical tenant pool here? Any planned neighborhood developments (good or bad) we should know about?
- What's the average days-on-market for RENTAL listings here right now (not sales)? A rising rental-DOM trend means longer vacancies and softer asking-rent achievability than the comps imply.
- What's the recent tenant-quality profile in this submarket — average credit score on applications, eviction rate, late-payment / NSF rate, and stable-employment percentage? A property-management company in the area should have these aggregated.
- How much new for-sale + rental construction is in the pipeline within 1–3 miles? Heavy new supply typically softens prices + rents 12–24 months out; constrained supply supports both.
Investment metrics
- 1% rule
- 0.58% ✗
- Cap rate
- 4.21%
- Cash-on-cash
- -7.42%
- DSCR
- 0.67
- GRM
- 14.3
CMA / ARV
- ARV (on-the-fly)
- $168,000
- Comps found
- 3
Show comp detail 3 sales within ~0.75 mi
| Address | Dist | Beds/Ba | Sqft | Sold | Price | $/sf | Match |
|---|---|---|---|---|---|---|---|
| 962 Main St #10 | 0.26mi | 2/2.0 (-1) | 1,120 (0%) | 1mo | $167,500 | $150 | 82 |
| 962 Main St #1 | 0.26mi | 2/2.0 (-1) | 1,280 (+14%) | 8mo | $140,000 | $109 | 52 |
| 288 Blue Rd | 0.52mi | 2/1.5 (-1) | 1,008 (-10%) | 13mo | $221,000 | $219 | 41 |
Match score weights: distance 35% · size 25% · config 20% · recency 20%. Top-matched comps best support the ARV.
Projected returns pro-forma
10.0% appreciation · 3.0% rent growth · sell at horizon
- IRR
- 19.0%
- Equity multiple
- 2.55×
- Total profit
- $97,657
- Equity at exit
- $202,698
- IRR
- 17.6%
- Equity multiple
- 5.87×
- Total profit
- $306,983
- Equity at exit
- $437,126
Cash invested: $63,000 (down + closing). Projections, not guarantees.
Landlord ↔ Tenant lean methodology
- Overall (STATE)
- 41 Moderately Tenant-Leaning
- State Maine
- 41 Moderately Tenant-Leaning · D+2
- County
- — inherits STATE
- City
- — inherits STATE
ZIP-level market 04259
- Home prices YoY
- 5.7%
- Active inventory
- 19
- Price-to-rent
- 14.3×
Monthly cashflow live
- Estimated rent
- $1,309 medium interval (Pro) →
- Mortgage (P&I)
- −$1,180
- Tax from tax record
- −$150 /mo · $1,806/yr
- Insurance
- −$94
- HOA
- −$0
- Vacancy / Maint / Mgmt
- −$275
- Net cashflow
- $-390
Break-even live
Sensitivity live
| Price | -10% $-262 | -5% $-326 | +0% $-390 | +5% $-453 | +10% $-517 |
|---|---|---|---|---|---|
| Rent | -10% $-493 | -5% $-441 | +0% $-390 | +5% $-338 | +10% $-286 |
| Rate | -1.0pp $-276 | -0.5pp $-333 | base $-390 | +0.5pp $-448 | +1.0pp $-507 |
UW: 25.0% down · 7.5% · 30yr · 1.5% tax · 5.0% vac · 8.0% maint · 8.0% mgmt
Financing live
Cash to close
- Down payment
- $56,250
- Closing costs
- $6,750
- Reserves months
- —
- Total cash needed
- —
Loan-product check · same deal, 3 products live
Conventional
25% down · 7.5% · 30yr
- Down + closing
- —
- Monthly P&I
- —
- Monthly cashflow
- —
- DSCR
- —
- Eligible?
- —
Personal DTI + credit; lowest rate.
DSCR
20% down · 8.5% · 30yr
- Down + closing
- —
- Monthly P&I
- —
- Monthly cashflow
- —
- DSCR
- —
- Eligible?
- —
No personal income docs; deal must DSCR.
Hard money
10% down · 12.0% · 12mo
- Down + closing
- —
- Monthly P&I
- —
- Monthly cashflow
- —
- DSCR
- —
- Eligible?
- —
Short-term bridge; refi at stabilization.
Listing history 3 events
-
2026-06-19days on market $225,000 Active 2 DOM
-
2026-06-18remarks 699-char remark
-
2026-06-18$225,000 Active 1 DOM
ⓘ Source: listings_history table (triggers on properties + properties_extension) + one-shot
backfill from property_details.listing_events for pre-trigger history.
Tax reassessment forecast ME · Partial reset (capped growth)
- Current annual tax
- $1,806 · $150/mo
- Projected year-2 tax
- $2,433 · $203/mo
- Expected delta
- +$627/yr (+$52/mo · 34.7%)
ⓘ Screening estimate from a state-policy table — verify with the county assessor before closing.
Climate risk First Street
- Flood 1/10 Low FEMA zone X (unshaded) · 0% chance over 30 yrs
- Wildfire 1/10 Low
- Heat 3/10 Moderate 7 d/yr ≥93°F today · 16 d/yr by 30 yrs out
- Wind 4/10 Moderate 13% chance of damaging wind over 30 yrs
- Air quality 2/10 Low 1 unhealthy d/yr today · 1 by 30 yrs out
Nearby sold comps map
Loading sold comps map…
Walkable amenities ~0.75 mi
Loading nearby amenities…
Taxation est. · year 1
- Rental income
- $15,713
- − Mortgage interest
- −$12,603
- − Property taxes
- −$1,806
- − Insurance
- −$1,125
- − Repairs & maintenance
- −$1,257
- − Management
- −$1,257
- − Depreciation
- −$6,545
- Taxable loss
- −$8,881
- Est. tax savings @ 24.0%
- +$2,132
- After-tax cash flow
- $-2,546/yr
For passive investors: Depreciation is non-cash, so a rental often shows a tax loss while cash-flowing — sheltering income. Rental losses are passive: they offset passive income freely, and up to $25,000/yr can offset ordinary (W-2) income if you actively participate and your MAGI is under $100k (phasing out to $0 by $150k); unused losses carry forward. On sale, claimed depreciation is recaptured at up to 25%, and gains may owe capital-gains tax (a 1031 exchange can defer both). Figures are a year-1 estimate at your 24.0% rate — not tax advice; consult a CPA.
Schools (NCES district)
- District
- RSU 02
- NCES district ID
- 2314776
- Math proficiency
- 83% ▲ 56.00%
- Reading proficiency
- 87% ▲ 34.00%
- Median HH income
- $52,565
- Composite
- 72.04/100
- National rank
- #208
- State rank
- #52 of 112 in ME
Livability — Winthrop
- Score
- 69/100
- State rank
- #76
- US rank
- #8395
Category grades
Schools grade is shown separately in the Schools card above.
Census & demographics
- City population
- 6,153
- Population (ZIP)
- 3,493
Population outlook (Kennebec County) Hauer SSP2
- Today (2025)
- 115,421 people
- By 2030
- 111,852 · -3.1%
- By 2040
- 103,757 · -10.1%
- By 2050
- 95,710 · -17.1%
- By 2075
- 78,172 · -32.3%
- By 2100
- 59,500 · -48.4%
Race, ethnicity, and origin ACS 2023
- Neighborhood character
- Predominantly White (94%)
- Race & ethnicity
- White 94% Two or more races 5% Hispanic / Latino 2%
- Common ancestry
- Lithuanian 23% Iranian 7% Slovak 4%
- Foreign-born
- 2% · Canada
- Languages at home
- 97% English-only · French/Haitian/Cajun 2% Spanish 1% German/W. Germanic 1%
Political lean MEDSL · Kennebec
- 2024 margin
- Toss-up / Even · D 47.5% · R 50.2% · Other 2.4%
- 2008→2024 swing
- -17.5pp toward R · 2008: 14.8pp · 2024: -2.8pp
- All cycles
- 2024: R+2.8 2020: D+0.2 2016: R+3.7 2012: D+13.5 2008: D+14.8
Not yet ingested
- Civics
- —
Market trends
- HPI YoY
- ▲ 21.99%
- Current HPI
- 408.6401
- Rent YoY
- —
- Metro
- —
- State GDP YoY
- —
- F500 in state
- 0
Price history
+1025.0% since first listed2 events — show timeline
- 2026-06-17 Listed $225,000 MREIS
- 2003-11-25 Sold (Public Records) $20,000 Public Records
Property tax history
+2.6%/yrLatest (2024): $1,806 · +13.0% YoY. Source: county tax records.
Cash-flow waterfall
monthlySold comps — $/sqft
last 12 mo · ≤1 miLoading sold comps…