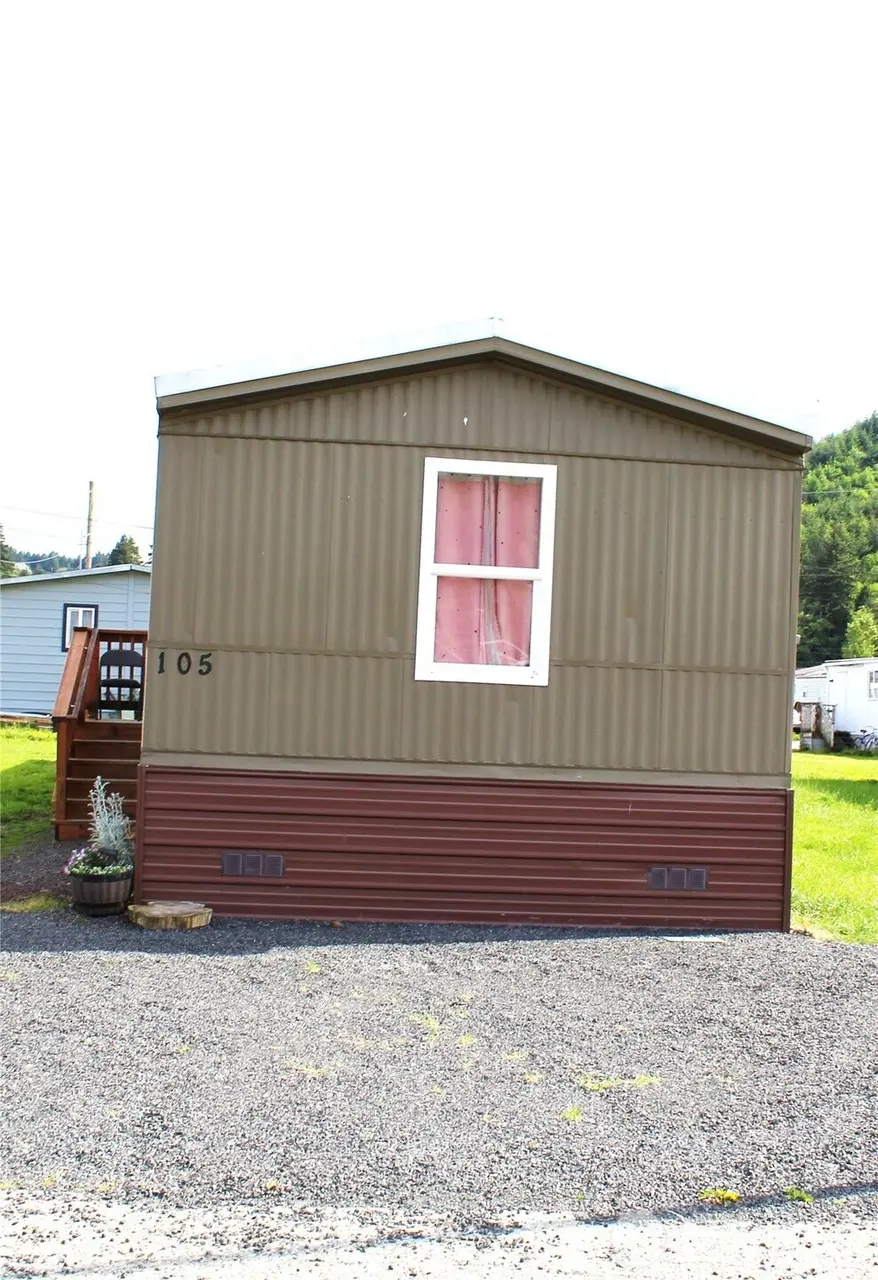
105 Mills Ln · Centralia, WA
Flood risk 5/10 · Moderate
- FEMA flood zone
- X
- Chance of flooding over 30 yrs
- 0.24%
- Est. flood insurance / yr
- $507 – $1,088
Fire risk 3/10 · Minor
- Est. fire insurance / yr
- $604 – $1,122
Heat risk 3/10 · Minor
- Hot days now (above 89°F)
- 8 days/yr
- Hot days in 30 yrs
- 15 days/yr
Wind risk 1/10 · Minimal
- Chance of severe wind over 30 yrs
- —
Air-quality risk 6/10 · Moderate
- Unhealthy air days now
- 8 days/yr
- Unhealthy air days in 30 yrs
- 8 days/yr
Risk factors via First Street. Map © Google.
Why this score? — see what drove the B- grade
The composite is a weighted blend of 9 inputs, each scored 0–100. Each bar is that input's sub-score; the figure is the points it added to the 100-point composite (weight × sub-score).
- Cash flow +30.0/30.0
- 1% rule +10.0/10.0
- DSCR +10.0/10.0
- Schools +4.0/10.0
- Livability +4.0/5.0
- Condition / age +3.8/5.0
- ARV discount +3.3/15.0
- Rent growth +3.2/5.0
- Appreciation +0.0/10.0
$93,000
🖨 Deal sheet (PDF) 📄 Offer letter ✓ Due diligence
Listing remarks
Move-in ready home in a convenient Centralia location at the Country Life Estates park, just minutes from town and all of its amenities. This well-kept 3-bed, 1.75-bath home features a 5-year-old TPO roof, newer porches, upgraded PEX plumbing, and ducting replaced only 3 years ago. Bright kitchen with skylight, laminate/vinyl flooring throughout, and all appliances—refrigerator, dishwasher, range/oven, washer, and dryer—are just 1 year old and stay with the home. A 10x12 storage shed (3 years old) provides additional space. Monthly space rent is $656. Space rent does not include utilities. Park approval required. Two hours’ notice needed for showings. Offered at $93,000. I
Key facts
- Bright kitchen
- Newer porches
- 5 year old tpo roof
Tags
Property features AI
Finance
- Other: Property type: Residential - Manufactured Home; Style: Manufactured single wide; Calculated living area: 925 square feet
- Financial info: Accepts Cash and Conventional financing
- HOA & community: Located in Country Life Estates (manufactured home park approved for sale); Land lease: $656
Exterior
- Parking: 2 open/uncovered parking spaces
- Utilities: Electric energy source; Public water; Public sewer; Electric water heater; Power provided by Centralia PUD
- Home design: Manufactured single-wide home; One level; Model: Liberty; Condition: Good; Mobile home remains on site
- Construction: Metal/vinyl construction materials; Metal roof (see remarks)
- Exterior features: Metal/vinyl exterior; Has a view; Patio/porch/deck
Interior
- Kitchen: Dishwasher; Stove/Range; Refrigerator
- Bedrooms: 3 bedrooms
- Flooring: Laminate; Vinyl
- Bathrooms: 1 full bath; 1 three-quarter bath; 1 bathtub; 2 showers
- Heating & cooling: Forced air heating; No central cooling listed
- Interior features: Water heater; Skylights; Bath off primary; Patio/porch/deck
- Laundry & utility: Washer; Dryer
Neighborhood map
What this means for you Summary
Snapshot
- This is a 3-bed/2.0-bath manufactured listed at $93k. Condition is rated good.
Deal economics
- At list price, monthly cash flow is $726 ($9k/yr) — positive.
- The deal already cash-flows at list — no discount required.
- Meets the 1% rule at list price ($2k rent vs $93k).
- Cap rate 15.7% vs local median 3.0% in Centralia — top-decile yield for the area; either an underpriced asset or a hidden risk that comps aren't pricing in. Stress-test before assuming the spread holds.
Location & tenants
- Location reads 81/100 on livability (#81 in WA, #1,497 nationally) — a professional / high-income tenant draw. Strengths: commute A+, health & safety A+, cost of living A; Watch: schools C-, crime C-, employment F.
- Centralia School District (town): math 39% / reading 52% proficiency, ranked #187 of 291 in WA (top 64%) — families likely to look elsewhere, expect single-tenant / working-renter base with shorter leases; 65% free/reduced lunch — lower-income household profile, screen leases tightly.
- Market conditions: Rents rising (+3.0%/yr); 263 active listings in the ZIP; 1 comparable units currently listed for rent nearby; 265 units permitted in Lewis County in 2024 (44 in 5+ unit buildings).
- This rent runs 33% of the median local income ($63k/yr) — at the standard rent-burdened threshold; future hikes will face affordability resistance.
Forward outlook
- Local home prices are declining (-3.0%/yr); year-one equity from $643 of loan paydown is wiped out by about $3k of value loss. Plan a longer hold.
- Lewis County population projected at -11% by 2050 — secular population decline; favor cash flow + early exit over multi-decade hold.
- At projected returns (-3.0% appreciation + 3.0% rent growth), your $26k cash investment doubles in ~4 years — after that, you're playing with house money.
Negotiation context
- Only 6 days on market — expect competitive offers; lowballing is unlikely to land.
Risks & watch-outs
- Climate carrying-cost: moderate flood risk — expect insurance premiums to compound above CPI over the hold.
Questions for the listing agent
- Is there a deadline driving the sale (1031 exchange, divorce, estate, relocation)? That informs how much negotiation room exists.
- What's the average days-on-market for RENTAL listings here right now (not sales)? A rising rental-DOM trend means longer vacancies and softer asking-rent achievability than the comps imply.
- What's the recent tenant-quality profile in this submarket — average credit score on applications, eviction rate, late-payment / NSF rate, and stable-employment percentage? A property-management company in the area should have these aggregated.
- How much new for-sale + rental construction is in the pipeline within 1–3 miles? Heavy new supply typically softens prices + rents 12–24 months out; constrained supply supports both.
Investment metrics
- 1% rule
- 1.86% ✓
- Cap rate
- 15.67%
- Cash-on-cash
- 33.47%
- DSCR
- 2.49
- GRM
- 4.5
CMA / ARV
- ARV (on-the-fly)
- $85,100
- Comps found
- 1
Show comp detail 1 sale within ~0.75 mi
| Address | Dist | Beds/Ba | Sqft | Sold | Price | $/sf | Match |
|---|---|---|---|---|---|---|---|
| 107 Mills Ln | 0.01mi | 2/2.0 (-1) | 924 (-0%) | 15mo | $85,000 | $92 | 82 |
Match score weights: distance 35% · size 25% · config 20% · recency 20%. Top-matched comps best support the ARV.
Projected returns pro-forma
-3.0% appreciation · 3.0% rent growth · sell at horizon
- IRR
- 28.7%
- Equity multiple
- 2.20×
- Total profit
- $31,220
- Equity at exit
- $13,867
- IRR
- 36.2%
- Equity multiple
- 4.34×
- Total profit
- $86,865
- Equity at exit
- $8,041
Cash invested: $26,040 (down + closing). Projections, not guarantees.
Landlord ↔ Tenant lean methodology
- Overall (STATE)
- 28 Tenant-Leaning
- State Washington
- 28 Tenant-Leaning · D+8
- County
- — inherits STATE
- City
- — inherits STATE
ZIP-level market 98531
- Rents YoY
- 3.0%
- Active inventory
- 263
- Price-to-rent
- 4.5×
Monthly cashflow live
- Estimated rent
- $1,733 medium interval (Pro) →
- Mortgage (P&I)
- −$488
- Tax est. 1.5%
- −$116 /mo · $1,395/yr
- Insurance
- −$39
- HOA
- −$0
- Vacancy / Maint / Mgmt
- −$364
- Net cashflow
- $726
Break-even live
Sensitivity live
| Price | -10% $791 | -5% $759 | +0% $726 | +5% $694 | +10% $662 |
|---|---|---|---|---|---|
| Rent | -10% $589 | -5% $658 | +0% $726 | +5% $795 | +10% $863 |
| Rate | -1.0pp $773 | -0.5pp $750 | base $726 | +0.5pp $702 | +1.0pp $678 |
UW: 25.0% down · 7.5% · 30yr · 1.5% tax · 5.0% vac · 8.0% maint · 8.0% mgmt
Financing live
Cash to close
- Down payment
- $23,250
- Closing costs
- $2,790
- Reserves months
- —
- Total cash needed
- —
Loan-product check · same deal, 3 products live
Conventional
25% down · 7.5% · 30yr
- Down + closing
- —
- Monthly P&I
- —
- Monthly cashflow
- —
- DSCR
- —
- Eligible?
- —
Personal DTI + credit; lowest rate.
DSCR
20% down · 8.5% · 30yr
- Down + closing
- —
- Monthly P&I
- —
- Monthly cashflow
- —
- DSCR
- —
- Eligible?
- —
No personal income docs; deal must DSCR.
Hard money
10% down · 12.0% · 12mo
- Down + closing
- —
- Monthly P&I
- —
- Monthly cashflow
- —
- DSCR
- —
- Eligible?
- —
Short-term bridge; refi at stabilization.
Rent comps 1 comps
| Address | Beds | Baths | Sqft | Rent | $/sqft | DOM | Units | Dist |
|---|---|---|---|---|---|---|---|---|
| 1111 Grand Ave Unit B Centralia, WA | 2.0 | 1.0 | 1050 | $1,495 | $1.42 | 45d | 1 | 1.28mi |
Listing history 1 events
-
2026-05-19$93,000 Active
ⓘ Source: listings_history table (triggers on properties + properties_extension) + one-shot
backfill from property_details.listing_events for pre-trigger history.
Climate risk First Street
- Flood 5/10 Major FEMA zone X · 24% chance over 30 yrs
- Wildfire 3/10 Moderate
- Heat 3/10 Moderate 8 d/yr ≥89°F today · 15 d/yr by 30 yrs out
- Wind 1/10 Low
- Air quality 6/10 Major 8 unhealthy d/yr today · 8 by 30 yrs out
Nearby sold comps map
Loading sold comps map…
Walkable amenities ~0.75 mi
Loading nearby amenities…
Taxation est. · year 1
- Rental income
- $20,796
- − Mortgage interest
- −$5,209
- − Property taxes
- −$1,395
- − Insurance
- −$465
- − Repairs & maintenance
- −$1,664
- − Management
- −$1,664
- − Depreciation
- −$2,705
- Taxable income
- $7,694
- Est. tax owed @ 24.0%
- −$1,847
- After-tax cash flow
- $6,870/yr
For passive investors: Depreciation is non-cash, so a rental often shows a tax loss while cash-flowing — sheltering income. Rental losses are passive: they offset passive income freely, and up to $25,000/yr can offset ordinary (W-2) income if you actively participate and your MAGI is under $100k (phasing out to $0 by $150k); unused losses carry forward. On sale, claimed depreciation is recaptured at up to 25%, and gains may owe capital-gains tax (a 1031 exchange can defer both). Figures are a year-1 estimate at your 24.0% rate — not tax advice; consult a CPA.
Condition & rehab AI · 13 photos
This move-in ready mobile home in a convenient location is in good condition with recent updates and appliances. It offers a good balance of curb appeal and interior updates.
Value-add opportunities
- Both landscaping — improves curb appeal and rental value
- Both interior paint — fresh paint enhances curb appeal and rental value
- Both landscaping — improves curb appeal and rental value
Renovation cost estimate screening
Value-add ROI direction
- Both landscaping — improves curb appeal and rental value ↑
- Both interior paint — fresh paint enhances curb appeal and rental value ↑
- Both landscaping — improves curb appeal and rental value ↑
ⓘ Cost ranges are severity-bucket heuristics (US national rule-of-thumb). Get contractor quotes + a written scope before underwriting a rehab budget.
Schools (NCES district)
- District
- Centralia School District
- NCES district ID
- 5301140
- Math proficiency
- 39% ▼ -2.00%
- Reading proficiency
- 52% ▼ -2.00%
- Median HH income
- $38,851
- Composite
- 40.17/100
- National rank
- #7832
- State rank
- #187 of 291 in WA
Livability — Centralia
- Score
- 81/100
- State rank
- #81
- US rank
- #1497
Category grades
Schools grade is shown separately in the Schools card above.
Census & demographics
- County
- Lewis County · 27,337 people
- City population
- 27,337
- Metro
- Centralia, WA
- Population (ZIP)
- 27,337
- Household income
- $63,406
- Rent vs Own
- Severe rent burden
- 1000.0
Population outlook (Lewis County) Hauer SSP2
- Today (2025)
- 75,749 people
- By 2030
- 74,647 · -1.5%
- By 2040
- 71,310 · -5.9%
- By 2050
- 67,748 · -10.6%
- By 2075
- 59,829 · -21.0%
- By 2100
- 52,293 · -31.0%
Race, ethnicity, and origin ACS 2023
- Neighborhood character
- Predominantly White (74%)
- Race & ethnicity
- White 74% Hispanic / Latino 19% Two or more races 10% Asian 1%
- Hispanic origin (detail)
- Mexican 15% Puerto Rican 1%
- Common ancestry
- Portuguese 3% Slovak 3% Lithuanian 2%
- Foreign-born
- 9% · Canada, Vietnam
- Languages at home
- 83% English-only · Spanish 16% Tagalog/Filipino 1%
Political lean MEDSL · Lewis
- 2024 margin
- Solid R (+33.0) · D 32.0% · R 65.0% · Other 3.0%
- 2008→2024 swing
- -13.8pp toward R · 2008: -19.2pp · 2024: -33.0pp
- All cycles
- 2024: R+33.0 2020: R+32.8 2016: R+36.2 2012: R+23.5 2008: R+19.2
Not yet ingested
- Civics
- —
Market trends
- HPI YoY
- ▼ -249.98%
- Current HPI
- 378.6936
- Rent YoY
- ▲ 3.00%
- Metro
- Centralia, WA
- State GDP YoY
- ▲ 4.65%
- F500 in state
- 22
Industry mix (Fortune 500 HQ in WA)
| Industry | F500 HQs | Revenue |
|---|---|---|
| Retail | 2 | $269B |
|
||
| Technology / Retail | 1 | $638B |
|
||
| Technology | 1 | $245B |
|
||
| Telecommunications | 1 | $38B |
|
||
| Food / Beverage | 1 | $36B |
|
||
| Automotive / Trucks | 1 | $34B |
|
||
Price history
1 event — show timeline
- 2026-05-19 Listed $93,000 NWMLS as Distributed by MLS Grid
Cash-flow waterfall
monthlySold comps — $/sqft
last 12 mo · ≤1 miLoading sold comps…