349 New Hope Vesta Rd · Rayle, GA
Flood risk No data
- FEMA flood zone
- —
- Chance of flooding over 30 yrs
- —
- Est. flood insurance / yr
- —
Fire risk No data
- Est. fire insurance / yr
- —
Heat risk No data
- Hot days now (above threshold)
- —
- Hot days in 30 yrs
- —
Wind risk No data
- Chance of severe wind over 30 yrs
- —
Air-quality risk No data
- Unhealthy air days now
- —
- Unhealthy air days in 30 yrs
- —
Risk factors via First Street. Map © Google.
Why this score? — see what drove the B- grade
The composite is a weighted blend of 9 inputs, each scored 0–100. Each bar is that input's sub-score; the figure is the points it added to the 100-point composite (weight × sub-score).
- Cash flow +30.0/30.0
- 1% rule +10.0/10.0
- DSCR +10.0/10.0
- ARV discount +7.5/15.0
- Appreciation +3.4/10.0
- Schools +3.1/10.0
- Rent growth +2.5/5.0
- Livability +2.2/5.0
- Condition / age +1.0/5.0
$72,900
🖨 Deal sheet 📄 Offer letter ✓ Due diligence
Listing remarks
Welcome to creating your special home in an abundance of land. If you are looking to build a home on several acres of quite semi wooden land then this is the property for you.
Key facts
- Several acres
- Semi wooded land
- 4.75 acre lot
Tags
Property features AI
Finance
- Other: No community features listed
- Financial info: Listing marketed for cash buyers; Sold/Offered as-is; estate-owned
- HOA & community: No HOA
Exterior
- Parking: No parking listed
- Utilities: Well water; Septic tank; Electricity available on property
- Home design: Single-family residence (house); Built in 1945; Fixer condition
- Construction: Wood siding; Tile and wood roof
- Exterior features: Open, private, sloped lot; Lot size about 4.75 acres
Interior
- Kitchen: No appliances listed
- Bedrooms: Three main-level bedrooms
- Flooring: Hardwood floors
- Bathrooms: One full bathroom (main level)
- Heating & cooling: Propane heating; Window air conditioning units
- Interior features: One-level floorplan; Public records list living area as 1,110; Family room
- Laundry & utility: No laundry features listed
Neighborhood map
What this means for you Summary
Snapshot
- This is a 3-bed/1.0-bath single-family listed at $73k. Condition is rated poor.
Deal economics
- At list price, monthly cash flow is $366 ($4k/yr) — positive.
- The deal already cash-flows at list — no discount required.
- Meets the 1% rule at list price ($1k rent vs $73k).
- Recommended offer: $71k (3.0% below list) — sets the bar for market timing.
Location & tenants
- Location reads 45/100 on livability (#602 in GA) — a working-class tenant base; expect higher turnover. Strengths: cost of living A+; Watch: schools F, crime F, amenities F.
- Oglethorpe County (rural): math 40% / reading 33% proficiency, ranked #58 of 174 in GA (top 33%) — families likely to look elsewhere, expect single-tenant / working-renter base with shorter leases.
- Market conditions: 22 active listings in the ZIP; 140 units permitted in Oglethorpe County in 2024 (0 in 5+ unit buildings).
Forward outlook
- Local home prices are declining (-3.0%/yr); year-one equity from $504 of loan paydown is wiped out by about $2k of value loss. Plan a longer hold.
- Oglethorpe County population projected at -13% by 2050 — secular population decline; favor cash flow + early exit over multi-decade hold.
- At projected returns (-3.0% appreciation + 3.0% rent growth), your $20k cash investment doubles in ~6 years — after that, you're playing with house money.
Negotiation context
- It's been on market 47 days — a 3% lower offer ($71k) is reasonable based on typical stale-listing flexibility.
- 2 sale attempts with the ask held roughly flat each time — persistent listings suggest the price (not the market) is what's stuck; bring a comps-based counter.
Risks & watch-outs
- Watch-outs: built in 1945 — expect roof / HVAC / electrical / plumbing capex.
Questions for the listing agent
- It's been on market 47 days. Have you received any prior offers? Is the seller open to a 3% concession, seller financing, or rate buy-down credit?
- Have any recent inspections been done? Can we get a copy of the seller's disclosures and any deferred-maintenance estimates?
- Built in 1945 — when were the roof, HVAC, electrical panel, plumbing, and water heater last replaced?
- Is there a deadline driving the sale (1031 exchange, divorce, estate, relocation)? That informs how much negotiation room exists.
- Schools are F-rated, which usually means shorter tenancies and higher turnover. Who's the typical renter profile here, and what's been the actual vacancy rate?
- Crime grade is F in this area — have there been break-ins, vandalism, or insurance claims at this property in the last 3 years? What carrier currently insures it and at what premium?
- What's the average days-on-market for RENTAL listings here right now (not sales)? A rising rental-DOM trend means longer vacancies and softer asking-rent achievability than the comps imply.
- What's the recent tenant-quality profile in this submarket — average credit score on applications, eviction rate, late-payment / NSF rate, and stable-employment percentage? A property-management company in the area should have these aggregated.
- How much new for-sale + rental construction is in the pipeline within 1–3 miles? Heavy new supply typically softens prices + rents 12–24 months out; constrained supply supports both.
Investment metrics
- 1% rule
- 1.51% ✓
- Cap rate
- 12.31%
- Cash-on-cash
- 21.49%
- DSCR
- 1.96
- GRM
- 5.5
CMA / ARV
No comps found within radius.
Projected returns pro-forma
-3.0% appreciation · 3.0% rent growth · sell at horizon
- IRR
- 14.1%
- Equity multiple
- 1.56×
- Total profit
- $11,485
- Equity at exit
- $10,870
- IRR
- 22.9%
- Equity multiple
- 2.96×
- Total profit
- $40,047
- Equity at exit
- $6,303
Cash invested: $20,412 (down + closing). Projections, not guarantees.
Landlord ↔ Tenant lean methodology
- Overall (STATE)
- 90 Strongly Landlord-Friendly
- State Georgia
- 90 Strongly Landlord-Friendly · R+3
- County
- — inherits STATE
- City
- — inherits STATE
ZIP-level market 30627
- Home prices YoY
- -1.1%
- Active inventory
- 22
- Price-to-rent
- 5.5×
Monthly cashflow live
- Estimated rent
- $1,100 medium interval (Pro) →
- Mortgage (P&I)
- −$382
- Tax est. 1.5%
- −$91 /mo · $1,094/yr
- Insurance
- −$30
- HOA
- −$0
- Vacancy / Maint / Mgmt
- −$231
- Net cashflow
- $366
Break-even live
UW: 25.0% down · 7.5% · 30yr · 1.5% tax · 5.0% vac · 8.0% maint · 8.0% mgmt
Financing live
Cash to close
- Down payment
- $18,225
- Closing costs
- $2,187
- Reserves months
- —
- Total cash needed
- —
Loan-product check · same deal, 3 products live
Conventional
25% down · 7.5% · 30yr
- Down + closing
- —
- Monthly P&I
- —
- Monthly cashflow
- —
- DSCR
- —
- Eligible?
- —
Personal DTI + credit; lowest rate.
DSCR
20% down · 8.5% · 30yr
- Down + closing
- —
- Monthly P&I
- —
- Monthly cashflow
- —
- DSCR
- —
- Eligible?
- —
No personal income docs; deal must DSCR.
Hard money
10% down · 12.0% · 12mo
- Down + closing
- —
- Monthly P&I
- —
- Monthly cashflow
- —
- DSCR
- —
- Eligible?
- —
Short-term bridge; refi at stabilization.
Listing history 18 events
-
2026-06-19days on market $72,900 Active 47 DOM
-
2026-06-18days on market $72,900 Active 46 DOM
-
2026-06-17days on market $72,900 Active 45 DOM
-
2026-06-16days on market $72,900 Active 44 DOM
-
2026-06-15days on market $72,900 Active 43 DOM
-
2026-06-14days on market $72,900 Active 41 DOM
-
2026-06-13days on market $72,900 Active 40 DOM
-
2026-06-10days on market $72,900 Active 38 DOM
-
2026-06-09days on market $72,900 Active 37 DOM
-
2026-06-08days on market $72,900 Active 36 DOM
-
2026-06-07days on market $72,900 Active 35 DOM
-
2026-06-02days on market $72,900 Active 30 DOM
-
2026-06-01days on market $72,900 Active 29 DOM
-
2026-05-31days on market $72,900 Active 28 DOM
-
2026-05-30days on market $72,900 Active 27 DOM
-
2026-04-25$72,900 New 175-char remark
-
2025-09-30historical
-
2025-03-23$110,000 New
ⓘ Source: listings_history table (triggers on properties + properties_extension) + one-shot
backfill from property_details.listing_events for pre-trigger history.
Nearby sold comps map
Loading sold comps map…
Walkable amenities ~0.75 mi
Loading nearby amenities…
Taxation est. · year 1
- Rental income
- $13,205
- − Mortgage interest
- −$4,084
- − Property taxes
- −$1,094
- − Insurance
- −$364
- − Repairs & maintenance
- −$1,056
- − Management
- −$1,056
- − Depreciation
- −$2,121
- Taxable income
- $3,430
- Est. tax owed @ 24.0%
- −$823
- After-tax cash flow
- $3,563/yr
For passive investors: Depreciation is non-cash, so a rental often shows a tax loss while cash-flowing — sheltering income. Rental losses are passive: they offset passive income freely, and up to $25,000/yr can offset ordinary (W-2) income if you actively participate and your MAGI is under $100k (phasing out to $0 by $150k); unused losses carry forward. On sale, claimed depreciation is recaptured at up to 25%, and gains may owe capital-gains tax (a 1031 exchange can defer both). Figures are a year-1 estimate at your 24.0% rate — not tax advice; consult a CPA.
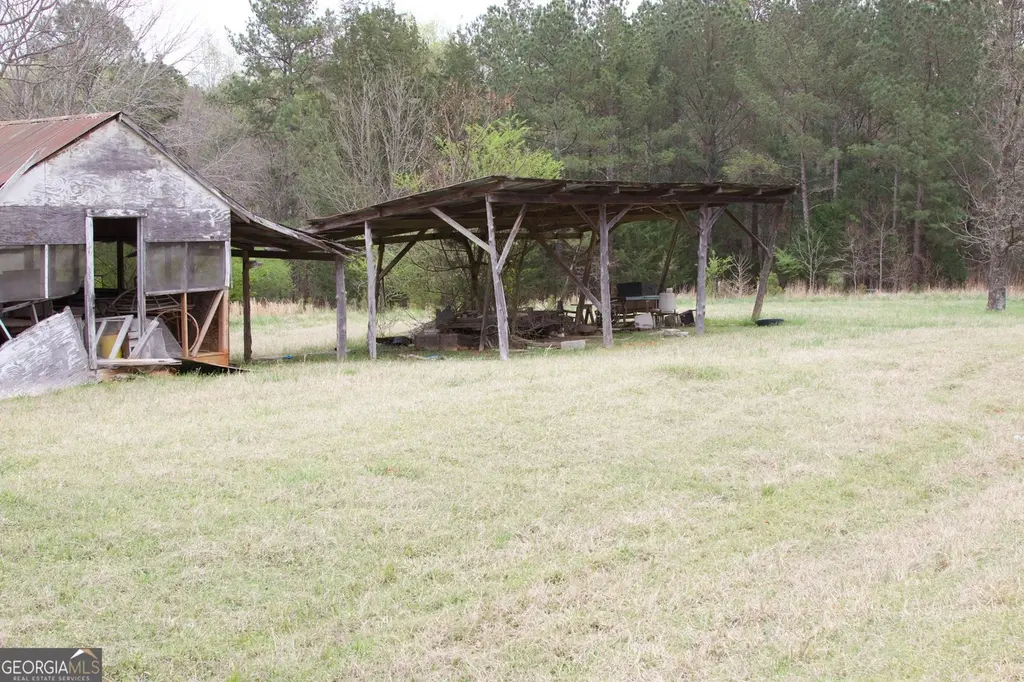
Condition & rehab AI · 8 photos
This property requires extensive repairs and improvements to become habitable and increase its value for both resale and rental.
Repairs flagged
- Major structural repairs — The house and outbuildings are in a state of disrepair and require significant structural work.
- Major roof repair/replacement — The roof is damaged and requires repair or replacement.
- Major flooring replacement — The flooring is damaged and needs to be replaced.
- Major interior wall repairs — The interior walls and paint are in poor condition and require extensive repairs.
- Major HVAC/mechanical replacement — The property appears uninhabitable due to the lack of functional HVAC and mechanical systems.
- Major landscaping and curb appeal — The property is surrounded by overgrown vegetation and requires landscaping and curb appeal improvements.
Value-add opportunities
- Both structural repairs and roof replacement — These repairs would make the property habitable and increase its value for both resale and rental.
- Both flooring replacement — Replacing the damaged flooring would improve the property's appearance and increase its value.
- Both interior wall repairs and paint — Repairing the interior walls and repainting would improve the property's appearance and increase its value.
- Both HVAC/mechanical replacement — Replacing the HVAC and mechanical systems would make the property habitable and increase its value.
- Both landscaping and curb appeal — Landscaping and curb appeal improvements would enhance the property's appearance and increase its value.
- Both foundation and structural repairs — These repairs would ensure the property's structural integrity and increase its value for both resale and rental.
Renovation cost estimate screening
| Repair item | Severity | Est. cost |
|---|---|---|
| structural repairs · The house and outbuildings are in a state of disrepair and require significant structural work. | Major | $15,000–50,000 |
| roof repair/replacement · The roof is damaged and requires repair or replacement. | Major | $15,000–50,000 |
| flooring replacement · The flooring is damaged and needs to be replaced. | Major | $15,000–50,000 |
| interior wall repairs · The interior walls and paint are in poor condition and require extensive repairs. | Major | $15,000–50,000 |
| HVAC/mechanical replacement · The property appears uninhabitable due to the lack of functional HVAC and mechanical systems. | Major | $15,000–50,000 |
| landscaping and curb appeal · The property is surrounded by overgrown vegetation and requires landscaping and curb appeal improvements. | Major | $15,000–50,000 |
| Total estimated repair cost · 6 items | $90,000–300,000 |
Value-add ROI direction
- Both structural repairs and roof replacement — These repairs would make the property habitable and increase its value for both resale and rental. ↑
- Both flooring replacement — Replacing the damaged flooring would improve the property's appearance and increase its value. ↑
- Both interior wall repairs and paint — Repairing the interior walls and repainting would improve the property's appearance and increase its value. ↑
- Both HVAC/mechanical replacement — Replacing the HVAC and mechanical systems would make the property habitable and increase its value. ↑
- Both landscaping and curb appeal — Landscaping and curb appeal improvements would enhance the property's appearance and increase its value. ↑
- Both foundation and structural repairs — These repairs would ensure the property's structural integrity and increase its value for both resale and rental. ↑
ⓘ Cost ranges are severity-bucket heuristics (US national rule-of-thumb). Get contractor quotes + a written scope before underwriting a rehab budget.
Schools (NCES district)
- District
- Oglethorpe County
- NCES district ID
- 1303990
- Math proficiency
- 40% ▼ -13.00%
- Reading proficiency
- 33% ▼ -13.00%
- Median HH income
- $43,507
- Composite
- 31.01/100
- National rank
- #6093
- State rank
- #58 of 174 in GA
Livability — Rayle
- Score
- 45/100
- State rank
- #602
- US rank
- #26663
Category grades
Schools grade is shown separately in the Schools card above.
Census & demographics
- Population (ZIP)
- 2,304
Population outlook (Oglethorpe County) Hauer SSP2
- Today (2025)
- 14,904 people
- By 2030
- 14,658 · -1.7%
- By 2040
- 13,902 · -6.7%
- By 2050
- 12,924 · -13.3%
- By 2075
- 11,049 · -25.9%
- By 2100
- 9,317 · -37.5%
Race, ethnicity, and origin ACS 2023
- Neighborhood character
- Predominantly White (77%)
- Race & ethnicity
- White 77% Black 11% Hispanic / Latino 9% Two or more races 5%
- Hispanic origin (detail)
- Mexican 5% Puerto Rican 2%
- Common ancestry
- Slovak 1% Lithuanian 1%
- Foreign-born
- 1% · Canada
- Languages at home
- 98% English-only · Spanish 2%
Political lean MEDSL · Oglethorpe
- 2024 margin
- Solid R (+42.4) · D 28.5% · R 70.9%
- 2008→2024 swing
- -12.7pp toward R · 2008: -29.7pp · 2024: -42.4pp
- All cycles
- 2024: R+42.4 2020: R+38.8 2016: R+42.0 2012: R+37.3 2008: R+29.7
Not yet ingested
- Civics
- —
Market trends
- HPI YoY
- ▼ -3.18%
- Current HPI
- 290.5906
- Rent YoY
- —
- Metro
- —
- State GDP YoY
- ▲ 2.66%
- F500 in state
- 28
Industry mix (Fortune 500 HQ in GA)
| Industry | F500 HQs | Revenue |
|---|---|---|
| Paper / Packaging | 2 | $29B |
|
||
| Retail | 1 | $160B |
|
||
| Transportation / Logistics | 1 | $91B |
|
||
| Airlines | 1 | $62B |
|
||
| Consumer Goods | 1 | $47B |
|
||
| Utilities | 1 | $25B |
|
||
Price history
-33.7% since first listed3 events — show timeline
- 2026-04-25 Listed $72,900 GAMLS
- 2025-09-30 Listing Removed — GAMLS
- 2025-03-23 Listed $110,000 GAMLS
Cash-flow waterfall
monthlySold comps — $/sqft
last 12 mo · ≤1 miLoading sold comps…