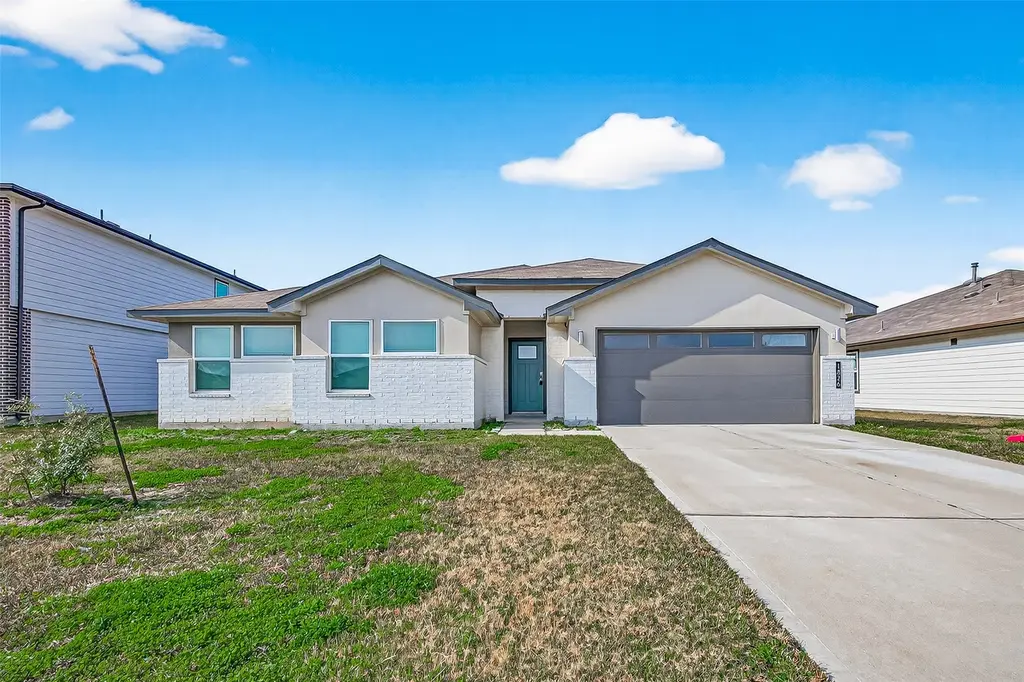
1826 Sandy Trail Ln · Rosenberg, TX
Flood risk 4/10 · Minor
- FEMA flood zone
- X (unshaded)
- Chance of flooding over 30 yrs
- 0.2%
- Est. flood insurance / yr
- $507 – $1,088
Fire risk 1/10 · Minimal
- Est. fire insurance / yr
- $1,222 – $2,270
Heat risk 9/10 · Severe
- Hot days now (above 110°F)
- 7 days/yr
- Hot days in 30 yrs
- 23 days/yr
Wind risk 9/10 · Severe
- Chance of severe wind over 30 yrs
- 99.0%
Air-quality risk 2/10 · Minimal
- Unhealthy air days now
- 1 days/yr
- Unhealthy air days in 30 yrs
- 1 days/yr
Risk factors via First Street. Map © Google.
Why this score? — see what drove the D grade
The composite is a weighted blend of 9 inputs, each scored 0–100. Each bar is that input's sub-score; the figure is the points it added to the 100-point composite (weight × sub-score).
- ARV discount +10.7/15.0
- Cash flow +10.1/30.0
- 1% rule +4.6/10.0
- Schools +4.6/10.0
- Condition / age +4.0/5.0
- Livability +3.1/5.0
- DSCR +2.9/10.0
- Rent growth +2.0/5.0
- Appreciation +0.0/10.0
$324,999
🖨 Deal sheet (PDF) 📄 Offer letter ✓ Due diligence
Key facts
- 7,801 sq ft lot
- 2 garage spots
- Built 2021
Neighborhood map
What this means for you Summary
Snapshot
- This is a 4-bed/2.0-bath single-family listed at $325k. Condition is rated good.
Deal economics
- At list price, monthly cash flow is $-188 ($-2k/yr) — negative.
- To cash-flow at today's rent, offer at most $292k (10.2% below list).
- To meet the 1% rule (rent ≥ 1% of price), the offer needs to be $313k (3.5% below list).
- Recommended offer: $286k (12.0% below list) — sets the bar for market timing.
- Cap rate 5.6% vs local median 3.4% in Rosenberg — top-decile yield for the area; either an underpriced asset or a hidden risk that comps aren't pricing in. Stress-test before assuming the spread holds.
Location & tenants
- Location reads 62/100 on livability (#922 in TX) — a middle-class / working-renter tenant base. Strengths: cost of living A+, housing A+, crime B; Watch: amenities F, commute F, health & safety F.
- Lamar CISD (suburban): math 50% / reading 53% proficiency, ranked #116 of 826 in TX (top 14%) — acceptable for families but not a draw, mixed tenant base, ~2y average lease.
- Zoned schools: Cora Thomas El (math 47% / reading 47%, grade D-, #1,006 of 4,322 statewide, top 25%, 601 students, 58% FRL); Reading J H (math 61% / reading 63%, grade B+, #134 of 1,662 statewide, top 8%, 1,588 students, 28% FRL); George Ranch H S (math 52% / reading 76%, grade B-, #224 of 1,632 statewide, top 14%, 2,511 students, 27% FRL).
- Market conditions: Rents soft (-1.8%/yr); 1345 active listings in the ZIP; 3 comparable units currently listed for rent nearby; rentals at typical pace (median 21d on market — plan ~3-4 weeks tenant-placement turnaround); solid renter incomes; 12,093 units permitted in Fort Bend County in 2024 (815 in 5+ unit buildings).
- This rent runs 37% of the median local income ($102k/yr) — at the standard rent-burdened threshold; future hikes will face affordability resistance.
Forward outlook
- Local home prices are declining (-3.0%/yr); year-one equity from $2k of loan paydown is wiped out by about $10k of value loss. Plan a longer hold.
- Fort Bend County population projected at +75% by 2050 — long-run rental-demand tailwind backs the buy-and-hold thesis.
Negotiation context
- It's been on market 151 days — a 12% lower offer ($286k) is reasonable based on typical stale-listing flexibility.
- 6 sale attempts since 4y ago; this cycle's ask is 13447% above the opening price — seller raised mid-cycle; expect resistance to lowballs.
Risks & watch-outs
- Watch-outs: property tax is 3.0% of price.
- Climate carrying-cost: severe wind risk, 99% chance of damaging wind over 30y; extreme-heat days projected 7→23/yr by 2055 (HVAC capex compounding) — expect insurance premiums to compound above CPI over the hold.
Questions for the listing agent
- What do current leases actually rent for vs. the listed asking? Can we see a recent rent roll and the last 12 months of T-12 income?
- It's been on market 151 days. Have you received any prior offers? Is the seller open to a 12% concession, seller financing, or rate buy-down credit?
- Property tax is high relative to price — has the assessment been appealed recently, and will the sale trigger a re-assessment?
- Why hasn't it sold? Are there any deal-killer items the seller is aware of (foundation, flood, title, zoning, code violations)?
- Is there a deadline driving the sale (1031 exchange, divorce, estate, relocation)? That informs how much negotiation room exists.
- Schools are D-rated, which usually means shorter tenancies and higher turnover. Who's the typical renter profile here, and what's been the actual vacancy rate?
- The area grade is low — what's the realistic commute time and amenity access for the typical tenant pool here? Any planned neighborhood developments (good or bad) we should know about?
- What's the average days-on-market for RENTAL listings here right now (not sales)? A rising rental-DOM trend means longer vacancies and softer asking-rent achievability than the comps imply.
- What's the recent tenant-quality profile in this submarket — average credit score on applications, eviction rate, late-payment / NSF rate, and stable-employment percentage? A property-management company in the area should have these aggregated.
- How much new for-sale + rental construction is in the pipeline within 1–3 miles? Heavy new supply typically softens prices + rents 12–24 months out; constrained supply supports both.
Investment metrics
- 1% rule
- 0.96% ✗
- Cap rate
- 5.60%
- Cash-on-cash
- -2.48%
- DSCR
- 0.89
- GRM
- 8.6
CMA / ARV
- ARV (median comp)
- $349,464
- List price
- $324,999
- Delta
- -7.00%
- Verdict
- FAIR
- Comps
- 20 within 1.0 mi
Show comp detail 12 sales within ~0.75 mi
| Address | Dist | Beds/Ba | Sqft | Sold | Price | $/sf | Match |
|---|---|---|---|---|---|---|---|
| 6806 Ashland Terrace Ln | 0.38mi | 4/2.5 | 2,410 (+2%) | 5mo | $324,000 | $134 | 72 |
| 6738 Haven Forest Ln | 0.32mi | 4/2.5 | 2,278 (-3%) | 6mo | $288,000 | $126 | 72 |
| 1618 Goose Island Ln | 0.46mi | 4/3.0 | 2,285 (-3%) | 2mo | $319,000 | $140 | 68 |
| 1719 Barrows Ln | 0.27mi | 4/2.5 | 2,547 (+8%) | 5mo | $349,990 | $137 | 68 |
| 7319 Creekside Terrace Ln | 0.55mi | 4/3.0 | 2,393 (+2%) | 2mo | $359,900 | $150 | 67 |
| 2039 Plum Rose Ln | 0.36mi | 4/2.0 | 2,124 (-10%) | 4mo | $309,900 | $146 | 64 |
| 1830 Turtle Bluff Ln | 0.31mi | 4/2.0 | 2,067 (-12%) | 10mo | $295,000 | $143 | 56 |
| 6811 Ashland Terrace Ln | 0.35mi | 3/2.5 (-1) | 2,051 (-13%) | 1mo | $295,000 | $144 | 54 |
| 1802 Golden Ale Ct | 0.36mi | 4/2.0 | 2,061 (-13%) | 11mo | $319,900 | $155 | 53 |
| 1803 Welsh Canyon Ct | 0.56mi | 4/3.0 | 2,147 (-9%) | 7mo | $370,000 | $172 | 49 |
| 6727 Trinity Trail Ln | 0.49mi | 3/2.0 (-1) | 2,032 (-14%) | 3mo | $299,900 | $148 | 46 |
| 1727 Brownwood Ridge Ct | 0.70mi | 4/3.0 | 2,152 (-9%) | 4mo | $315,000 | $146 | 46 |
Match score weights: distance 35% · size 25% · config 20% · recency 20%. Top-matched comps best support the ARV.
Projected returns pro-forma
-3.0% appreciation · 0.0% rent growth · sell at horizon
- IRR
- -24.4%
- Equity multiple
- 0.19×
- Total profit
- $-73,512
- Equity at exit
- $48,458
- IRR
- -35.7%
- Equity multiple
- -0.25×
- Total profit
- $-113,688
- Equity at exit
- $28,100
Cash invested: $91,000 (down + closing). Projections, not guarantees.
Landlord ↔ Tenant lean methodology
- Overall (STATE)
- 87 Strongly Landlord-Friendly
- State Texas
- 87 Strongly Landlord-Friendly · R+5
- County
- — inherits STATE
- City
- — inherits STATE
ZIP-level market 77469
- Home prices YoY
- -25.1%
- Rents YoY
- -1.8%
- Active inventory
- 1345
- Price-to-rent
- 8.6×
Monthly cashflow live
- Estimated rent
- $3,135 medium interval (Pro) →
- Mortgage (P&I)
- −$1,704
- Tax from tax record
- −$825 /mo · $9,895/yr
- Insurance
- −$135
- HOA
- −$0
- Vacancy / Maint / Mgmt
- −$658
- Net cashflow
- $-188
Break-even live
Sensitivity live
| Price | -10% $-4 | -5% $-96 | +0% $-188 | +5% $-280 | +10% $-372 |
|---|---|---|---|---|---|
| Rent | -10% $-436 | -5% $-312 | +0% $-188 | +5% $-64 | +10% $60 |
| Rate | -1.0pp $-24 | -0.5pp $-105 | base $-188 | +0.5pp $-272 | +1.0pp $-358 |
UW: 25.0% down · 7.5% · 30yr · 1.5% tax · 5.0% vac · 8.0% maint · 8.0% mgmt
Financing live
Cash to close
- Down payment
- $81,250
- Closing costs
- $9,750
- Reserves months
- —
- Total cash needed
- —
Loan-product check · same deal, 3 products live
Conventional
25% down · 7.5% · 30yr
- Down + closing
- —
- Monthly P&I
- —
- Monthly cashflow
- —
- DSCR
- —
- Eligible?
- —
Personal DTI + credit; lowest rate.
DSCR
20% down · 8.5% · 30yr
- Down + closing
- —
- Monthly P&I
- —
- Monthly cashflow
- —
- DSCR
- —
- Eligible?
- —
No personal income docs; deal must DSCR.
Hard money
10% down · 12.0% · 12mo
- Down + closing
- —
- Monthly P&I
- —
- Monthly cashflow
- —
- DSCR
- —
- Eligible?
- —
Short-term bridge; refi at stabilization.
Rent comps 3 comps
| Address | Beds | Baths | Sqft | Rent | $/sqft | DOM | Units | Dist |
|---|---|---|---|---|---|---|---|---|
| 2302 Grande Laurel Ct Richmond, TX | 4.0 | 3.5 | 2832 | $2,975 | $1.05 | 20d | 1 | 0.92mi |
| 2302 Grande Laurel Ct Richmond, TX | 4.0 | 3.5 | 2832 | $2,975 | $1.05 | 0d | 1 | 0.92mi |
| 615 Arbor Green Ln Rosenberg, TX | 4.0 | 3.0 | 2564 | $3,800 | $1.48 | 45d | 1 | 1.49mi |
Listing history 23 events
-
2026-06-08days on market $324,999 Active 151 DOM
-
2026-06-07days on market $324,999 Active 150 DOM
-
2026-06-04days on market $324,999 Active 147 DOM
-
2026-06-03days on market $324,999 Active 146 DOM
-
2026-06-02days on market $324,999 Active 145 DOM
-
2026-06-01days on market $324,999 Active 144 DOM
-
2026-05-31days on market $324,999 Active 143 DOM
-
2026-05-16price $2,349
-
2026-05-08$2,399
-
2026-05-01historical $2,399
-
2026-04-30$2,399
-
2026-02-12price $324,999
-
2026-01-28price $330,999
-
2026-01-20price $342,999
-
2026-01-08$349,999 Active
-
2025-12-24historical $2,295
-
2025-12-24historical
-
2025-09-26$2,295
-
2025-09-23$379,990 Active
-
2022-03-22soldstatus Sold
-
2022-02-14status Pending
-
2022-01-26price $344,990
-
2022-01-25$341,990 Active
ⓘ Source: listings_history table (triggers on properties + properties_extension) + one-shot
backfill from property_details.listing_events for pre-trigger history.
Tax reassessment forecast TX · Resets to sale price
- Current annual tax
- $9,895 · $825/mo
- Projected year-2 tax
- $9,895 · $825/mo
- Expected delta
- $0/yr ($0/mo · 0.0%)
ⓘ Screening estimate from a state-policy table — verify with the county assessor before closing.
Climate risk First Street
- Flood 4/10 Moderate FEMA zone X (unshaded) · 20% chance over 30 yrs
- Wildfire 1/10 Low
- Heat 9/10 Extreme 7 d/yr ≥110°F today · 23 d/yr by 30 yrs out
- Wind 9/10 Extreme 99% chance of damaging wind over 30 yrs
- Air quality 2/10 Low 1 unhealthy d/yr today · 1 by 30 yrs out
Nearby sold comps map
Loading sold comps map…
Walkable amenities ~0.75 mi
Loading nearby amenities…
Taxation est. · year 1
- Rental income
- $37,617
- − Mortgage interest
- −$18,205
- − Property taxes
- −$9,895
- − Insurance
- −$1,625
- − Repairs & maintenance
- −$3,009
- − Management
- −$3,009
- − Depreciation
- −$9,455
- Taxable loss
- −$7,581
- Est. tax savings @ 24.0%
- +$1,820
- After-tax cash flow
- $-435/yr
For passive investors: Depreciation is non-cash, so a rental often shows a tax loss while cash-flowing — sheltering income. Rental losses are passive: they offset passive income freely, and up to $25,000/yr can offset ordinary (W-2) income if you actively participate and your MAGI is under $100k (phasing out to $0 by $150k); unused losses carry forward. On sale, claimed depreciation is recaptured at up to 25%, and gains may owe capital-gains tax (a 1031 exchange can defer both). Figures are a year-1 estimate at your 24.0% rate — not tax advice; consult a CPA.
Condition & rehab AI · 12 photos
This single-family home is in good condition with a fresh paint job and modern appliances. It has a good curb appeal and is move-in ready.
Value-add opportunities
- Resale Paint exterior walls — Fresh paint enhances curb appeal
- Both Landscaping — Well-maintained landscaping improves curb appeal and adds value
- Resale Replace flooring in bedrooms — Hardwood floors in living areas contrast with carpeted bedrooms, consider updating for a more uniform look
Renovation cost estimate screening
Value-add ROI direction
- Resale Paint exterior walls — Fresh paint enhances curb appeal ↑
- Both Landscaping — Well-maintained landscaping improves curb appeal and adds value ↑
- Resale Replace flooring in bedrooms — Hardwood floors in living areas contrast with carpeted bedrooms, consider updating for a more uniform look ↑
ⓘ Cost ranges are severity-bucket heuristics (US national rule-of-thumb). Get contractor quotes + a written scope before underwriting a rehab budget.
Schools (NCES district)
- District
- Lamar CISD
- NCES district ID
- 4826580
- Math proficiency
- 50% ▼ -12.00%
- Reading proficiency
- 53% ▼ -4.00%
- Median HH income
- $75,213
- Composite
- 46.43/100
- National rank
- #2452
- State rank
- #116 of 826 in TX
Livability — Rosenberg
- Score
- 62/100
- State rank
- #922
- US rank
- #16414
Category grades
Schools grade is shown separately in the Schools card above.
Census & demographics
- County
- Fort Bend County · 836,777 people
- Metro
- Houston-The Woodlands-Sugar Land, TX
- Population (ZIP)
- 69,826
- Household income
- $102,125
- Rent vs Own
- Severe rent burden
- 1292.0
Population outlook (Fort Bend County) Hauer SSP2
- Today (2025)
- 1,004,526 people
- By 2030
- 1,153,104 · +14.8%
- By 2040
- 1,453,718 · +44.7%
- By 2050
- 1,753,781 · +74.6%
- By 2075
- 2,455,772 · +144.5%
- By 2100
- 2,930,528 · +191.7%
Race, ethnicity, and origin ACS 2023
- Neighborhood character
- Highly diverse neighborhood (Simpson 0.76)
- Race & ethnicity
- Hispanic / Latino 29% White 27% Black 25% Two or more races 15% Asian 15%
- Hispanic origin (detail)
- Mexican 21%
- Common ancestry
- Romanian 1% Lithuanian 1%
- Foreign-born
- 24% · Canada, Vietnam, China
- Languages at home
- 65% English-only · Spanish 17% Other Indo-European 7% Other Asian/Pacific 2%
Political lean MEDSL · Fort Bend
- 2024 margin
- Toss-up / Even · D 49.5% · R 47.9% · Other 2.6%
- 2008→2024 swing
- +4.0pp toward D · 2008: -2.4pp · 2024: 1.6pp
- All cycles
- 2024: D+1.6 2020: D+10.6 2016: D+6.6 2012: R+6.8 2008: R+2.4
Not yet ingested
- Civics
- —
Market trends
- HPI YoY
- ▼ -78.66%
- Current HPI
- 234.9892
- Rent YoY
- ▼ -1.81%
- Metro
- Houston-The Woodlands-Sugar Land, TX
- State GDP YoY
- ▲ 3.95%
- F500 in state
- 110
Industry mix (Fortune 500 HQ in TX)
| Industry | F500 HQs | Revenue |
|---|---|---|
| Energy | 16 | $1,198B |
|
||
| Technology | 5 | $198B |
|
||
| Engineering / Construction | 4 | $72B |
|
||
| Energy Services | 3 | $60B |
|
||
| Utilities | 3 | $41B |
|
||
| Healthcare | 2 | $330B |
|
||
Price history
-99.3% since first listed16 events — show timeline
- 2026-05-16 Price Changed $2,349 HARMLS
- 2026-05-08 Listed for Rent $2,399 HARMLS
- 2026-05-01 Rental Removed $2,399 HARMLS
- 2026-04-30 Listed for Rent $2,399 HARMLS
- 2026-02-12 Price Changed $324,999 HARMLS
- 2026-01-28 Price Changed $330,999 HARMLS
- 2026-01-20 Price Changed $342,999 HARMLS
- 2026-01-08 Listed $349,999 HARMLS
- 2025-12-24 Rental Removed $2,295 HARMLS
- 2025-12-24 Listing Removed — HARMLS
- 2025-09-26 Listed for Rent $2,295 HARMLS
- 2025-09-23 Listed $379,990 HARMLS
- 2022-03-22 Sold (MLS) — HARMLS
- 2022-02-14 Pending — HARMLS
- 2022-01-26 Price Changed $344,990 HARMLS
- 2022-01-25 Listed $341,990 HARMLS
Property tax history
+81.5%/yrLatest (2025): $9,895 · +2.8% YoY. Source: county tax records.
Cash-flow waterfall
monthlySold comps — $/sqft
last 12 mo · ≤1 miLoading sold comps…