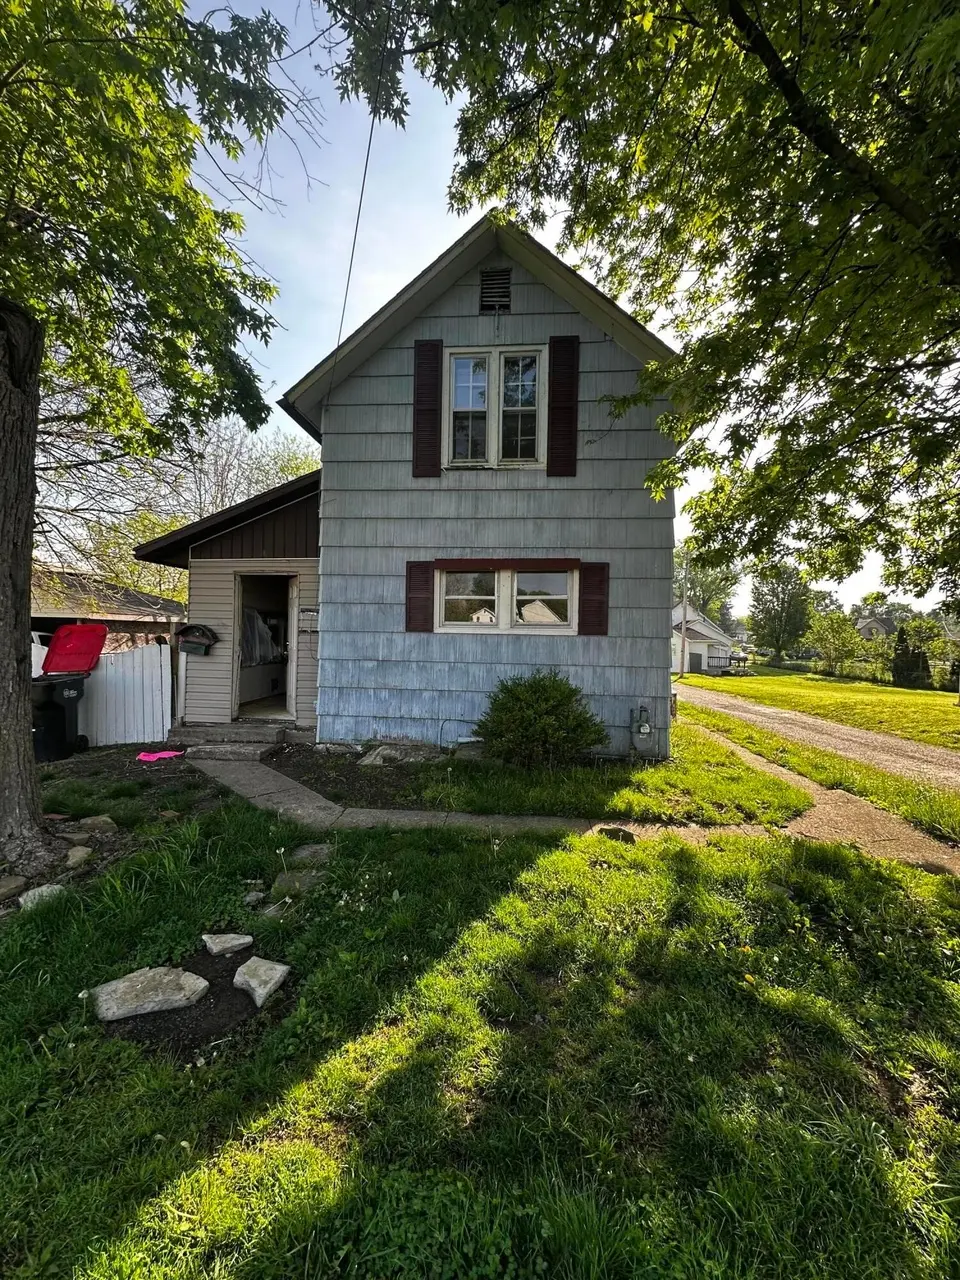
20 Conley Ave · Newark, OH
Flood risk 1/10 · Minimal
- FEMA flood zone
- X (unshaded)
- Chance of flooding over 30 yrs
- 0.0%
- Est. flood insurance / yr
- $473 – $860
Fire risk 1/10 · Minimal
- Est. fire insurance / yr
- $713 – $1,323
Heat risk 3/10 · Minor
- Hot days now (above 98°F)
- 7 days/yr
- Hot days in 30 yrs
- 18 days/yr
Wind risk 2/10 · Minimal
- Chance of severe wind over 30 yrs
- 0.0%
Air-quality risk 2/10 · Minimal
- Unhealthy air days now
- 1 days/yr
- Unhealthy air days in 30 yrs
- 2 days/yr
Risk factors via First Street. Map © Google.
Why this score? — see what drove the B grade
The composite is a weighted blend of 9 inputs, each scored 0–100. Each bar is that input's sub-score; the figure is the points it added to the 100-point composite (weight × sub-score).
- Cash flow +30.0/30.0
- 1% rule +10.0/10.0
- DSCR +10.0/10.0
- ARV discount +7.5/15.0
- Schools +4.3/10.0
- Livability +3.5/5.0
- Rent growth +2.9/5.0
- Condition / age +2.5/5.0
- Appreciation +0.0/10.0
$84,500
🖨 Deal sheet 📄 Offer letter ✓ Due diligence
Listing remarks MLS
Large kitchen with new cabinets, quiet street, deep garage 15' x 29' Private area with vacant field to the front of the house.
Key facts
- 5,227 sq ft lot
- Built 1906
- Listed 33 days
Property features AI
Exterior
- Parking: On-street parking
- Utilities: Public water; Public sewer
- Home design: Single family residence; Two levels; No shared/common walls; Built in 1906
- Exterior features: Other foundation
Interior
- Bedrooms: 1 main-level bedroom
- Bathrooms: 1 bathroom
- Heating & cooling: Central air; Wall unit(s); Forced air heating
- Interior features: Cellar basement; 1,110 total living area
Neighborhood map
What this means for you Summary
Snapshot
- This is a 3-bed/1.0-bath single-family listed at $84k.
Deal economics
- At list price, monthly cash flow is $472 ($6k/yr) — positive.
- The deal already cash-flows at list — no discount required.
- Meets the 1% rule at list price ($1k rent vs $84k).
- Recommended offer: $82k (3.0% below list) — sets the bar for market timing.
- Cap rate 13.0% vs local median 3.2% in Newark — top-decile yield for the area; either an underpriced asset or a hidden risk that comps aren't pricing in. Stress-test before assuming the spread holds.
Location & tenants
- Location reads 69/100 on livability (#493 in OH) — a middle-class / working-renter tenant base. Strengths: cost of living A+, housing A+, schools B; Watch: employment D+, amenities F, commute F.
- Newark City (suburban): math 48% / reading 56% proficiency, ranked #431 of 656 in OH (top 66%) — acceptable for families but not a draw, mixed tenant base, ~2y average lease.
- Market conditions: Rents rising (+1.6%/yr); 204 active listings in the ZIP; 18 comparable units currently listed for rent nearby; rentals leasing fast (median 11d on market — plan ~1-2 weeks tenant-placement turnaround); 159 units permitted in Licking County in 2024 (0 in 5+ unit buildings).
Forward outlook
- Local home prices are declining (-3.0%/yr); year-one equity from $584 of loan paydown is wiped out by about $3k of value loss. Plan a longer hold.
- At projected returns (-3.0% appreciation + 1.6% rent growth), your $24k cash investment doubles in ~6 years — after that, you're playing with house money.
Negotiation context
- It's been on market 33 days — a 3% lower offer ($82k) is reasonable based on typical stale-listing flexibility.
- 3 sale attempts since 19y ago; this cycle's ask has dropped $4k (5%) from the opening price — seller is motivated, your offer sets the floor, not the list.
- Current owner paid $32k; list at $84k implies a 164% gain — meaningful room to come down on a strong offer.
Risks & watch-outs
- Watch-outs: built in 1906 — expect roof / HVAC / electrical / plumbing capex.
Questions for the listing agent
- It's been on market 33 days. Have you received any prior offers? Is the seller open to a 3% concession, seller financing, or rate buy-down credit?
- Built in 1906 — when were the roof, HVAC, electrical panel, plumbing, and water heater last replaced?
- Is there a deadline driving the sale (1031 exchange, divorce, estate, relocation)? That informs how much negotiation room exists.
- Schools are B-rated — typically a magnet for longer-tenancy family renters. What's the average tenant stay here, and is there a school-zone premium baked into asking?
- What's the average days-on-market for RENTAL listings here right now (not sales)? A rising rental-DOM trend means longer vacancies and softer asking-rent achievability than the comps imply.
- What's the recent tenant-quality profile in this submarket — average credit score on applications, eviction rate, late-payment / NSF rate, and stable-employment percentage? A property-management company in the area should have these aggregated.
- How much new for-sale + rental construction is in the pipeline within 1–3 miles? Heavy new supply typically softens prices + rents 12–24 months out; constrained supply supports both.
Investment metrics
- 1% rule
- 1.58% ✓
- Cap rate
- 12.99%
- Cash-on-cash
- 23.93%
- DSCR
- 2.06
- GRM
- 5.3
CMA / ARV
- ARV (on-the-fly)
- $189,810
- Comps found
- 12
Show comp detail 12 sales within ~0.75 mi
| Address | Dist | Beds/Ba | Sqft | Sold | Price | $/sf | Match |
|---|---|---|---|---|---|---|---|
| 53 Poplar Ave | 0.17mi | 3/2.0 | 1,114 (+0%) | 5mo | $208,500 | $187 | 83 |
| 188 S 4th St | 0.13mi | 3/1.0 | 1,190 (+7%) | 11mo | $110,000 | $92 | 72 |
| 201 Laverne Dr | 0.61mi | 3/1.0 | 1,120 (+1%) | 1mo | $265,000 | $237 | 69 |
| 92 S 3rd St | 0.17mi | 4/1.0 (+1) | 1,232 (+11%) | 5mo | $142,000 | $115 | 65 |
| 205 Jefferson St | 0.71mi | 3/1.0 | 1,082 (-2%) | 3mo | $145,000 | $134 | 60 |
| 592 Chelsea Rd | 0.63mi | 3/1.0 | 1,144 (+3%) | 10mo | $225,000 | $197 | 57 |
| 506 Edgemont Rd | 0.55mi | 2/1.0 (-1) | 1,216 (+10%) | 1mo | $235,000 | $193 | 52 |
| 196 Mound St | 0.56mi | 3/1.0 | 1,014 (-9%) | 9mo | $50,000 | $49 | 52 |
| 24 Columbia St | 0.66mi | 2/1.0 (-1) | 1,080 (-3%) | 11mo | $185,000 | $171 | 50 |
| 89 Prospect St | 0.66mi | 2/1.0 (-1) | 1,040 (-6%) | 10mo | $217,000 | $209 | 46 |
| 30 Boner St | 0.72mi | 3/1.0 | 1,276 (+15%) | 12mo | $136,000 | $107 | 31 |
| 33 N 10th St | 0.75mi | 2/1.0 (-1) | 1,262 (+14%) | 11mo | $40,000 | $32 | 28 |
Match score weights: distance 35% · size 25% · config 20% · recency 20%. Top-matched comps best support the ARV.
Projected returns pro-forma
-3.0% appreciation · 1.63% rent growth · sell at horizon
- IRR
- 15.6%
- Equity multiple
- 1.62×
- Total profit
- $14,557
- Equity at exit
- $12,599
- IRR
- 23.2%
- Equity multiple
- 2.87×
- Total profit
- $44,193
- Equity at exit
- $7,306
Cash invested: $23,660 (down + closing). Projections, not guarantees.
Landlord ↔ Tenant lean methodology
- Overall (STATE)
- 73 Landlord-Friendly
- State Ohio
- 73 Landlord-Friendly · R+6
- County
- — inherits STATE
- City
- — inherits STATE
ZIP-level market 43055
- Rents YoY
- 1.6%
- Active inventory
- 204
- Price-to-rent
- 5.3×
Monthly cashflow live
- Estimated rent
- $1,336 high interval (Pro) →
- Mortgage (P&I)
- −$443
- Tax est. 1.5%
- −$106 /mo · $1,268/yr
- Insurance
- −$35
- HOA
- −$0
- Vacancy / Maint / Mgmt
- −$281
- Net cashflow
- $472
Break-even live
UW: 25.0% down · 7.5% · 30yr · 1.5% tax · 5.0% vac · 8.0% maint · 8.0% mgmt
Financing live
Cash to close
- Down payment
- $21,125
- Closing costs
- $2,535
- Reserves months
- —
- Total cash needed
- —
Loan-product check · same deal, 3 products live
Conventional
25% down · 7.5% · 30yr
- Down + closing
- —
- Monthly P&I
- —
- Monthly cashflow
- —
- DSCR
- —
- Eligible?
- —
Personal DTI + credit; lowest rate.
DSCR
20% down · 8.5% · 30yr
- Down + closing
- —
- Monthly P&I
- —
- Monthly cashflow
- —
- DSCR
- —
- Eligible?
- —
No personal income docs; deal must DSCR.
Hard money
10% down · 12.0% · 12mo
- Down + closing
- —
- Monthly P&I
- —
- Monthly cashflow
- —
- DSCR
- —
- Eligible?
- —
Short-term bridge; refi at stabilization.
Rent comps 18 comps
| Address | Beds | Baths | Sqft | Rent | $/sqft | DOM | Units | Dist |
|---|---|---|---|---|---|---|---|---|
| 86 Wilwood Ave Newark, OH | 3.0 | 1.0 | 1205 | $1,595 | $1.32 | 1d | 1 | 0.20mi |
| 33 Jefferson St Newark, OH | 2.0 | 1.0 | 1200 | $1,300 | $1.08 | 11d | 1 | 0.38mi |
| 63 N 4th St Newark, OH | 3.0 | 1.0 | 1300 | $1,350 | $1.04 | 2d | 1 | 0.45mi |
| 63 N 4th St Unit 302 Newark, OH | 3.0 | 1.0 | 1300 | $1,350 | $1.04 | 4d | 1 | 0.45mi |
| 71 W Locust St Newark, OH | 2.0 | 1.0 | 1371 | $1,225 | $0.89 | 23d | 1 | 0.48mi |
| 8 N 8th St Unit 2 Newark, OH | 3.0 | 1.0 | 1400 | $1,400 | $1.00 | 23d | 1 | 0.51mi |
| 150 N 1st St Newark, OH | 3.0 | 1.0 | 1467 | $1,300 | $0.89 | 17d | 1 | 0.58mi |
| 290 W National Dr Unit A1 Newark, OH | 2.0 | 1.0 | 900 | $950 | $1.06 | 1d | 1 | 0.61mi |
| 374 Seroco Ave Newark, OH | 2.0 | 1.0 | 1100 | $1,100 | $1.00 | 10d | 1 | 0.61mi |
| 73 N 9th St Unit 73 Newark, OH | 2.0 | 1.0 | 1250 | $950 | $0.76 | 23d | 1 | 0.68mi |
| 27 N Buena Vista St Newark, OH | 3.0 | 2.0 | 1500 | $1,300 | $0.87 | 11d | 1 | 0.69mi |
| 202 N 11th St Newark, OH | 2.0 | 1.0 | 1011 | $1,195 | $1.18 | 14d | 1 | 0.93mi |
| 270 Everett Ave Newark, OH | 3.0 | 1.0 | 864 | $1,425 | $1.65 | 1d | 1 | 0.98mi |
| 51 Mill St Newark, OH | 2.0 | 1.0 | 1024 | $1,200 | $1.17 | 1d | 1 | 1.04mi |
| 388 Indiana St Newark, OH | 2.0 | 1.0 | 1200 | $1,100 | $0.92 | 1d | 1 | 1.22mi |
| 39 Charles St Newark, OH | 3.0 | 1.5 | 1450 | $1,649 | $1.14 | 23d | 1 | 1.46mi |
| 718 Rice St Newark, OH | 2.0 | 1.0 | 924 | $1,100 | $1.19 | 1d | 1 | 1.46mi |
| 718 Rice St Newark, OH | 2.0 | 1.0 | 924 | $1,100 | $1.19 | 23d | 1 | 1.46mi |
Listing history 16 events
-
2026-06-05statusdays on market $84,500 Pending 33 DOM
-
2026-06-03pricedays on market $84,500 Active 32 DOM
-
2026-06-02days on market $89,000 Active 31 DOM
-
2026-06-01days on market $89,000 Active 30 DOM
-
2026-05-31days on market $89,000 Active 29 DOM
-
2026-05-17status Active
-
2026-05-08historical Contingent
-
2026-05-02$89,000 Active
-
2008-11-12soldstatus $32,000
-
2008-11-10soldstatus $32,000 126-char remark
Show marketing remark (126 chars)
Large kitchen with new cabinets, quiet street, deep garage 15' x 29' Private area with vacant field to the front of the house.
-
2008-09-25historical 126-char remark
Show marketing remark (126 chars)
Large kitchen with new cabinets, quiet street, deep garage 15' x 29' Private area with vacant field to the front of the house.
-
2007-12-11$36,000 126-char remark
Show marketing remark (126 chars)
Large kitchen with new cabinets, quiet street, deep garage 15' x 29' Private area with vacant field to the front of the house.
-
2002-10-02soldstatus $35,000
-
1993-12-17soldstatus $27,850
-
1992-07-24soldstatus $23,000
-
1992-06-25soldstatus $10,800
ⓘ Source: listings_history table (triggers on properties + properties_extension) + one-shot
backfill from property_details.listing_events for pre-trigger history.
Climate risk First Street
- Flood 1/10 Low FEMA zone X (unshaded) · 0% chance over 30 yrs
- Wildfire 1/10 Low
- Heat 3/10 Moderate 7 d/yr ≥98°F today · 18 d/yr by 30 yrs out
- Wind 2/10 Low 0% chance of damaging wind over 30 yrs
- Air quality 2/10 Low 1 unhealthy d/yr today · 2 by 30 yrs out
Nearby sold comps map
Loading sold comps map…
Walkable amenities ~0.75 mi
Loading nearby amenities…
Taxation est. · year 1
- Rental income
- $16,036
- − Mortgage interest
- −$4,733
- − Property taxes
- −$1,268
- − Insurance
- −$422
- − Repairs & maintenance
- −$1,283
- − Management
- −$1,283
- − Depreciation
- −$2,458
- Taxable income
- $4,589
- Est. tax owed @ 24.0%
- −$1,101
- After-tax cash flow
- $4,560/yr
For passive investors: Depreciation is non-cash, so a rental often shows a tax loss while cash-flowing — sheltering income. Rental losses are passive: they offset passive income freely, and up to $25,000/yr can offset ordinary (W-2) income if you actively participate and your MAGI is under $100k (phasing out to $0 by $150k); unused losses carry forward. On sale, claimed depreciation is recaptured at up to 25%, and gains may owe capital-gains tax (a 1031 exchange can defer both). Figures are a year-1 estimate at your 24.0% rate — not tax advice; consult a CPA.
Schools (NCES district)
- District
- Newark City
- NCES district ID
- 3904445
- Math proficiency
- 48% ▼ -12.00%
- Reading proficiency
- 56% ▼ -3.00%
- Median HH income
- $38,662
- Composite
- 43.33/100
- National rank
- #3034
- State rank
- #431 of 656 in OH
Livability — Newark
- Score
- 69/100
- State rank
- #493
- US rank
- #8263
Category grades
Schools grade is shown separately in the Schools card above.
Census & demographics
- Census place
- Newark, OH
- County
- Licking County · 109,194 people
- City population
- 63,281
- Metro
- Columbus, OH
- Population (ZIP)
- 63,281
- Household income
- $63,974
- Rent vs Own
- Severe rent burden
- 2269.0
Population outlook (Licking County) Hauer SSP2
- Today (2025)
- 178,210 people
- By 2030
- 180,917 · +1.5%
- By 2040
- 183,885 · +3.2%
- By 2050
- 182,985 · +2.7%
- By 2075
- 178,377 · +0.1%
- By 2100
- 161,075 · -9.6%
Race, ethnicity, and origin ACS 2023
- Neighborhood character
- Predominantly White (89%)
- Race & ethnicity
- White 89% Two or more races 5% Black 3% Hispanic / Latino 2%
- Common ancestry
- Slovak 2% Romanian 2% Lithuanian 2%
- Foreign-born
- 2% · Canada
- Languages at home
- 96% English-only · Spanish 2% Arabic 1%
Political lean MEDSL · Licking
- 2024 margin
- Solid R (+30.0) · D 34.5% · R 64.6%
- 2008→2024 swing
- -14.2pp toward R · 2008: -15.8pp · 2024: -30.0pp
- All cycles
- 2024: R+30.0 2020: R+28.1 2016: R+28.9 2012: R+14.7 2008: R+15.8
Not yet ingested
- Civics
- —
Market trends
- HPI YoY
- ▼ -253.54%
- Current HPI
- 247.9425
- Rent YoY
- ▲ 1.63%
- Metro
- Columbus, OH
- State GDP YoY
- ▲ 1.98%
- F500 in state
- 48
Industry mix (Fortune 500 HQ in OH)
| Industry | F500 HQs | Revenue |
|---|---|---|
| Insurance | 3 | $145B |
|
||
| Industrial Machinery | 3 | $49B |
|
||
| Financial Services | 3 | $24B |
|
||
| Consumer Goods | 2 | $93B |
|
||
| Aerospace / Defense | 2 | $47B |
|
||
| Utilities | 2 | $33B |
|
||
Price history
+724.1% since first listed11 events — show timeline
- 2026-05-17 Relisted — CBRMLS
- 2026-05-08 Contingent — CBRMLS
- 2026-05-02 Listed $89,000 CBRMLS
- 2008-11-12 Sold (Public Records) $32,000 Public Records
- 2008-11-10 Sold (MLS) $32,000 CBRMLS
- 2008-09-25 Listing Removed — CBRMLS
- 2007-12-11 Listed $36,000 CBRMLS
- 2002-10-02 Sold (Public Records) $35,000 Public Records
- 1993-12-17 Sold (Public Records) $27,850 Public Records
- 1992-07-24 Sold (Public Records) $23,000 Public Records
- 1992-06-25 Sold (Public Records) $10,800 Public Records
Property tax history
+37.7%/yrLatest (2025): $16,791 · +71.1% YoY. Source: county tax records.
Cash-flow waterfall
monthlySold comps — $/sqft
last 12 mo · ≤1 miLoading sold comps…