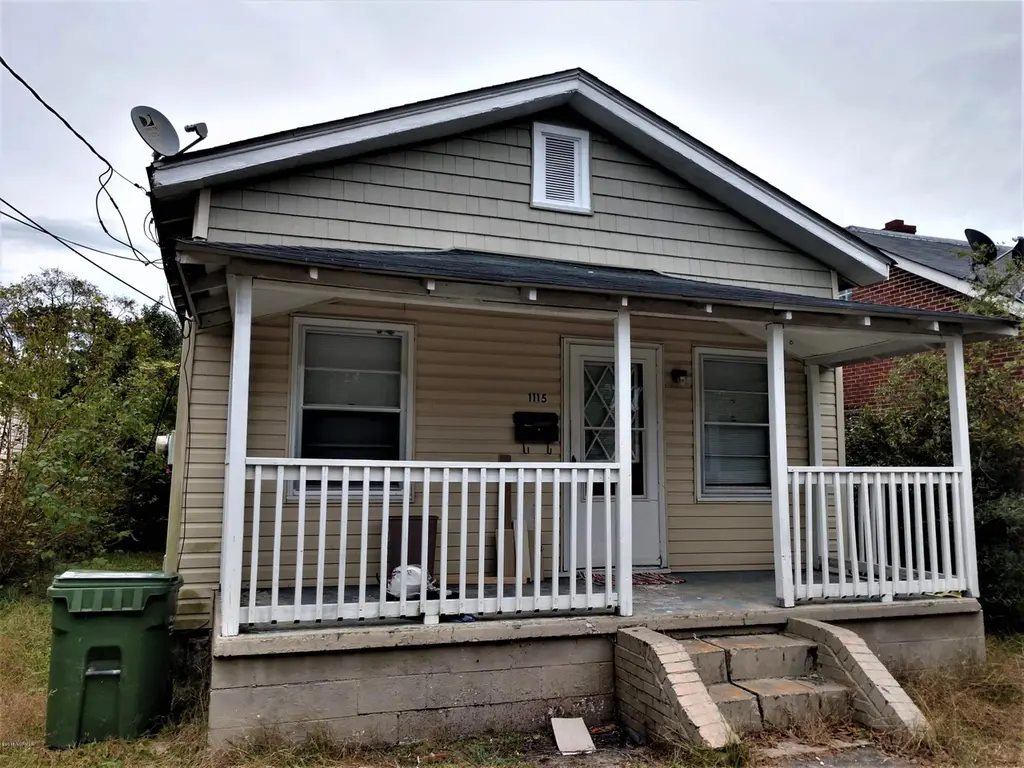
1115 S 6th St · Wilmington, NC
Flood risk 1/10 · Minimal
- FEMA flood zone
- X (unshaded)
- Chance of flooding over 30 yrs
- 0.0%
- Est. flood insurance / yr
- $507 – $1,088
Fire risk 4/10 · Minor
- Est. fire insurance / yr
- $906 – $1,684
Heat risk 9/10 · Severe
- Hot days now (above 105°F)
- 7 days/yr
- Hot days in 30 yrs
- 19 days/yr
Wind risk 8/10 · Major
- Chance of severe wind over 30 yrs
- 99.0%
Air-quality risk 2/10 · Minimal
- Unhealthy air days now
- 1 days/yr
- Unhealthy air days in 30 yrs
- 1 days/yr
Risk factors via First Street. Map © Google.
Why this score? — see what drove the B- grade
The composite is a weighted blend of 9 inputs, each scored 0–100. Each bar is that input's sub-score; the figure is the points it added to the 100-point composite (weight × sub-score).
- Cash flow +25.6/30.0
- ARV discount +15.0/15.0
- DSCR +8.5/10.0
- 1% rule +5.6/10.0
- Schools +4.3/10.0
- Livability +3.5/5.0
- Condition / age +2.5/5.0
- Rent growth +2.4/5.0
- Appreciation +0.0/10.0
$183,900
🖨 Deal sheet (PDF) 📄 Offer letter ✓ Due diligence
Listing remarks MLS
Head south on Market St; turn left onto S 16th St; turn right onto Wooster St; turn left onto S 6th St. Property will be on the left
Key facts
- 3,920 sq ft lot
- Built 1925
- Listed 382 days
Property features AI
Finance
- HOA & community: No association amenities
Exterior
- Parking: On-street parking
- Utilities: Public water; Sewer available; Water available
- Home design: Single-family residence; One level
- Construction: Vinyl siding construction
- Exterior features: Front porch; Chain link fencing; Shingle roof; Has a view; Paved road access; Lot dimensions approximately 96 x 33 x 96 x 36
Interior
- Bathrooms: 1 full bathroom
- Heating & cooling: Central air conditioning; Electric heating with heat pump
- Interior features: No fireplace; Crawl space basement; 5 total rooms
Neighborhood map
What this means for you Summary
Snapshot
- This is a 3-bed/1.0-bath single-family listed at $184k.
Deal economics
- At list price, monthly cash flow is $437 ($5k/yr) — positive.
- The deal already cash-flows at list — no discount required.
- Meets the 1% rule at list price ($2k rent vs $184k).
- Recommended offer: $162k (12.0% below list) — sets the bar for market timing.
- Cap rate 9.1% vs local median 2.6% in Wilmington — top-decile yield for the area; either an underpriced asset or a hidden risk that comps aren't pricing in. Stress-test before assuming the spread holds.
Location & tenants
- Location reads 70/100 on livability (#142 in NC) — a middle-class / working-renter tenant base. Strengths: health & safety A+, cost of living B+, housing B+; Watch: amenities C-, employment C-, crime F.
- New Hanover County Schools (urban): math 48% / reading 53% proficiency, ranked #61 of 178 in NC (top 34%) — acceptable for families but not a draw, mixed tenant base, ~2y average lease.
- Zoned schools: A H Snipes Academy of Arts/Des (math 17% / reading 22%, grade F, #1,242 of 1,410 statewide, top 90%, 377 students, 99% FRL); Williston Middle (math 17% / reading 30%, grade F, #402 of 475 statewide, top 85%, 683 students, 100% FRL); New Hanover High (math 60% / reading 53%, grade C, #261 of 535 statewide, top 49%, 1,466 students, 100% FRL) — zoned schools average 100% FRL vs 42% district-wide (58 pts higher); higher-poverty schools than district average — tighter screening recommended.
- Zoned-school proficiency averages 33% at this address vs 50% district-wide (-17 pts) — the specific schools serving this property underperform the New Hanover County Schools average; the district grade overstates school quality for this exact location.
- Market conditions: Rents soft (-0.5%/yr); 277 active listings in the ZIP; 17 comparable units currently listed for rent nearby; rentals at typical pace (median 16d on market — plan ~3-4 weeks tenant-placement turnaround); 2,581 units permitted in New Hanover County in 2024 (1,185 in 5+ unit buildings).
Forward outlook
- Local home prices are declining (-3.0%/yr); year-one equity from $1k of loan paydown is wiped out by about $6k of value loss. Plan a longer hold.
- New Hanover County population projected at +37% by 2050 — long-run rental-demand tailwind backs the buy-and-hold thesis.
Negotiation context
- It's been on market 382 days — a 12% lower offer ($162k) is reasonable based on typical stale-listing flexibility.
- 7 sale attempts since 16y ago; this cycle's ask has dropped $11k (6%) from the opening price — seller is motivated, your offer sets the floor, not the list.
- Current owner paid $70k; list at $184k implies a 163% gain — meaningful room to come down on a strong offer.
Risks & watch-outs
- Watch-outs: built in 1925 — expect roof / HVAC / electrical / plumbing capex.
- Climate carrying-cost: severe wind risk, 99% chance of damaging wind over 30y; extreme-heat days projected 7→19/yr by 2055 (HVAC capex compounding) — expect insurance premiums to compound above CPI over the hold.
Questions for the listing agent
- It's been on market 382 days. Have you received any prior offers? Is the seller open to a 12% concession, seller financing, or rate buy-down credit?
- Built in 1925 — when were the roof, HVAC, electrical panel, plumbing, and water heater last replaced?
- Why hasn't it sold? Are there any deal-killer items the seller is aware of (foundation, flood, title, zoning, code violations)?
- Is there a deadline driving the sale (1031 exchange, divorce, estate, relocation)? That informs how much negotiation room exists.
- Crime grade is F in this area — have there been break-ins, vandalism, or insurance claims at this property in the last 3 years? What carrier currently insures it and at what premium?
- What's the average days-on-market for RENTAL listings here right now (not sales)? A rising rental-DOM trend means longer vacancies and softer asking-rent achievability than the comps imply.
- What's the recent tenant-quality profile in this submarket — average credit score on applications, eviction rate, late-payment / NSF rate, and stable-employment percentage? A property-management company in the area should have these aggregated.
- How much new for-sale + rental construction is in the pipeline within 1–3 miles? Heavy new supply typically softens prices + rents 12–24 months out; constrained supply supports both.
Investment metrics
- 1% rule
- 1.06% ✓
- Cap rate
- 9.14%
- Cash-on-cash
- 10.18%
- DSCR
- 1.45
- GRM
- 7.8
CMA / ARV
- ARV (on-the-fly)
- $289,920
- Comps found
- 12
Show comp detail 12 sales within ~0.75 mi
| Address | Dist | Beds/Ba | Sqft | Sold | Price | $/sf | Match |
|---|---|---|---|---|---|---|---|
| 1203 S 8th St | 0.16mi | 3/1.0 | 942 (-2%) | 1mo | $150,000 | $159 | 88 |
| 815 S 5th Ave | 0.27mi | 2/1.5 (-1) | 963 (+0%) | 1mo | $135,000 | $140 | 79 |
| 1116 S 3rd St | 0.27mi | 2/1.0 (-1) | 994 (+4%) | 1mo | $297,000 | $299 | 76 |
| 612 S 6th St | 0.45mi | 3/1.0 | 964 (+0%) | 6mo | $318,000 | $330 | 74 |
| 616 S 7th St | 0.45mi | 2/1.0 (-1) | 995 (+4%) | 0mo | $177,750 | $179 | 68 |
| 617 S 9th St | 0.49mi | 3/1.5 | 993 (+3%) | 2mo | $299,900 | $302 | 68 |
| 1415 S 3rd St | 0.34mi | 2/1.0 (-1) | 1,010 (+5%) | 5mo | $379,900 | $376 | 66 |
| 708 S 14th St | 0.68mi | 3/2.0 | 1,000 (+4%) | 3mo | $360,000 | $360 | 54 |
| 514 Church St | 0.57mi | 2/2.0 (-1) | 1,030 (+7%) | 2mo | $405,000 | $393 | 50 |
| 517 S 6th St | 0.52mi | 3/2.0 | 1,043 (+9%) | 9mo | $312,500 | $300 | 50 |
| 1015 Shaws Aly | 0.50mi | 2/1.0 (-1) | 825 (-14%) | 10mo | $245,000 | $297 | 40 |
| 805 S 13th St | 0.60mi | 2/1.0 (-1) | 819 (-15%) | 3mo | $247,500 | $302 | 40 |
Match score weights: distance 35% · size 25% · config 20% · recency 20%. Top-matched comps best support the ARV.
Projected returns pro-forma
-3.0% appreciation · 0.0% rent growth · sell at horizon
- IRR
- -4.2%
- Equity multiple
- 0.85×
- Total profit
- $-7,767
- Equity at exit
- $27,420
- IRR
- 2.1%
- Equity multiple
- 1.13×
- Total profit
- $6,642
- Equity at exit
- $15,900
Cash invested: $51,492 (down + closing). Projections, not guarantees.
Landlord ↔ Tenant lean methodology
- Overall (STATE)
- 85 Strongly Landlord-Friendly
- State North Carolina
- 85 Strongly Landlord-Friendly · R+3
- County
- — inherits STATE
- City
- — inherits STATE
ZIP-level market 28401
- Rents YoY
- -0.5%
- Active inventory
- 277
- Price-to-rent
- 7.8×
Monthly cashflow live
- Estimated rent
- $1,956 high interval (Pro) →
- Mortgage (P&I)
- −$964
- Tax from tax record
- −$67 /mo · $803/yr
- Insurance
- −$77
- HOA
- −$0
- Lot rent
- −$0
- Vacancy / Maint / Mgmt
- −$411
- Net cashflow
- $437
Break-even live
Sensitivity live
| Price | -10% $541 | -5% $489 | +0% $437 | +5% $385 | +10% $333 |
|---|---|---|---|---|---|
| Rent | -10% $283 | -5% $360 | +0% $437 | +5% $514 | +10% $592 |
| Rate | -1.0pp $530 | -0.5pp $484 | base $437 | +0.5pp $389 | +1.0pp $341 |
UW: 25.0% down · 7.5% · 30yr · 1.5% tax · 5.0% vac · 8.0% maint · 8.0% mgmt
Financing live
Cash to close
- Down payment
- $45,975
- Closing costs
- $5,517
- Reserves months
- —
- Total cash needed
- —
Loan-product check · same deal, 3 products live
Conventional
25% down · 7.5% · 30yr
- Down + closing
- —
- Monthly P&I
- —
- Monthly cashflow
- —
- DSCR
- —
- Eligible?
- —
Personal DTI + credit; lowest rate.
DSCR
20% down · 8.5% · 30yr
- Down + closing
- —
- Monthly P&I
- —
- Monthly cashflow
- —
- DSCR
- —
- Eligible?
- —
No personal income docs; deal must DSCR.
Hard money
10% down · 12.0% · 12mo
- Down + closing
- —
- Monthly P&I
- —
- Monthly cashflow
- —
- DSCR
- —
- Eligible?
- —
Short-term bridge; refi at stabilization.
Rent comps 17 comps
| Address | Beds | Baths | Sqft | Rent | $/sqft | DOM | Units | Dist |
|---|---|---|---|---|---|---|---|---|
| 301 Martin St Wilmington, NC | 2.0 | 2.5 | 1036 | $2,400 | $2.32 | 23d | 1 | 0.29mi |
| 1400 S 2nd St Wilmington, NC | 1.0–2.0 | 1.0–2.5 | 956 | $2,533 | $2.65 | 16d | 13 | 0.38mi |
| 1519 Lake Branch Dr Wilmington, NC | 1.0–3.0 | 1.0 | 720 | $1,307 | $1.82 | 23d | 1 | 0.42mi |
| 618 S 3rd St #2 Wilmington, NC | 2.0 | 2.0 | 1000 | $1,750 | $1.75 | 23d | 1 | 0.51mi |
| 919 Castle St Wilmington, NC | 2.0 | 2.0 | 688 | $1,375 | $2.00 | 23d | 1 | 0.59mi |
| 607 S 11th St Unit 208 Wilmington, NC | 2.0 | 2.0 | 960 | $1,585 | $1.65 | 16d | 1 | 0.61mi |
| 1102 Castle St Unit 201 Wilmington, NC | 2.0 | 2.0 | 748 | $1,450 | $1.94 | 16d | 1 | 0.62mi |
| 1108 Castle St #106 Wilmington, NC | 2.0 | 2.0 | 900 | $1,625 | $1.81 | 23d | 1 | 0.63mi |
| 418 S 8th St Wilmington, NC | 2.0 | 1.0 | 873 | $2,200 | $2.52 | 16d | 1 | 0.64mi |
| 715 S 13th St Wilmington, NC | 3.0 | 2.0 | 936 | $2,300 | $2.46 | 23d | 1 | 0.64mi |
| 422 S 3rd St Wilmington, NC | 2.0 | 1.0 | 734 | $1,550 | $2.11 | 16d | 1 | 0.66mi |
| 1625 S 17th St Wilmington, NC | 2.0 | 1.0–2.0 | 920 | $2,097 | $2.28 | 16d | 29 | 0.93mi |
| 1704 Church St Wilmington, NC | 2.0 | 2.0 | 830 | $1,475 | $1.78 | 23d | 1 | 1.02mi |
| 420 Market St Wilmington, NC | 1.0–3.0 | 1.0 | 935 | $1,500 | $1.60 | 16d | 1 | 1.02mi |
| 14 Grace St Wilmington, NC | 1.0–2.0 | 1.0–2.0 | 1041 | $2,347 | $2.25 | 16d | 3 | 1.29mi |
| 2247 Wrightsville Ave Wilmington, NC | 3.0 | 1.0–2.0 | 753 | $1,520 | $2.02 | 16d | 9 | 1.36mi |
| 1904 Perry Ave Wilmington, NC | 2.0 | 1.0 | 1017 | $2,500 | $2.46 | 23d | 1 | 1.39mi |
Listing history 17 events
-
2026-05-31days on market $183,900 Active 382 DOM
-
2026-05-30days on market $183,900 Active 381 DOM
-
2025-11-03price $183,900
-
2025-09-12status Active
-
2025-06-18status Pending
-
2025-02-17$194,900 Active
-
2023-11-30historical $1,650
-
2023-09-30price $1,650
-
2023-09-28$1,500
-
2019-01-16soldstatus $70,000 132-char remark
Show marketing remark (132 chars)
Head south on Market St; turn left onto S 16th St; turn right onto Wooster St; turn left onto S 6th St. Property will be on the left
-
2018-12-04$69,900 132-char remark
Show marketing remark (132 chars)
Head south on Market St; turn left onto S 16th St; turn right onto Wooster St; turn left onto S 6th St. Property will be on the left
-
2015-08-31soldstatus $24,899 431-char remark
Show marketing remark (431 chars)
Three bedroom bungalow has hardwood floors, covered front porch, and fenced yard. Time Limit Bid Property. 4.5% Buyer Premium chgd buyer at closing. No contingencies accepted on TLB Properties. REO. Property sold As-Is w/o repair, warranty or Seller Disclosure. The Listing Broker & Seller assume no responsibility & make no guarantees as to the accuracy of info herein. Seller will accept cash or conventional offers only.
-
2015-01-20$25,600 431-char remark
Show marketing remark (431 chars)
Three bedroom bungalow has hardwood floors, covered front porch, and fenced yard. Time Limit Bid Property. 4.5% Buyer Premium chgd buyer at closing. No contingencies accepted on TLB Properties. REO. Property sold As-Is w/o repair, warranty or Seller Disclosure. The Listing Broker & Seller assume no responsibility & make no guarantees as to the accuracy of info herein. Seller will accept cash or conventional offers only.
-
2014-08-21historical
-
2012-10-03$43,000
-
2011-07-17historical
-
2010-06-16$57,000
ⓘ Source: listings_history table (triggers on properties + properties_extension) + one-shot
backfill from property_details.listing_events for pre-trigger history.
Tax reassessment forecast NC · Resets to sale price
- Current annual tax
- $803 · $67/mo
- Projected year-2 tax
- $1,508 · $126/mo
- Expected delta
- +$705/yr (+$59/mo · 87.9%)
ⓘ Screening estimate from a state-policy table — verify with the county assessor before closing.
Climate risk First Street
- Flood 1/10 Low FEMA zone X (unshaded) · 0% chance over 30 yrs
- Wildfire 4/10 Moderate
- Heat 9/10 Extreme 7 d/yr ≥105°F today · 19 d/yr by 30 yrs out
- Wind 8/10 Severe 99% chance of damaging wind over 30 yrs
- Air quality 2/10 Low 1 unhealthy d/yr today · 1 by 30 yrs out
Nearby sold comps map
Loading sold comps map…
Walkable amenities ~0.75 mi
Loading nearby amenities…
Taxation est. · year 1
- Rental income
- $23,467
- − Mortgage interest
- −$10,301
- − Property taxes
- −$803
- − Insurance
- −$920
- − Repairs & maintenance
- −$1,877
- − Management
- −$1,877
- − Depreciation
- −$5,350
- Taxable income
- $2,339
- Est. tax owed @ 24.0%
- −$561
- After-tax cash flow
- $4,683/yr
For passive investors: Depreciation is non-cash, so a rental often shows a tax loss while cash-flowing — sheltering income. Rental losses are passive: they offset passive income freely, and up to $25,000/yr can offset ordinary (W-2) income if you actively participate and your MAGI is under $100k (phasing out to $0 by $150k); unused losses carry forward. On sale, claimed depreciation is recaptured at up to 25%, and gains may owe capital-gains tax (a 1031 exchange can defer both). Figures are a year-1 estimate at your 24.0% rate — not tax advice; consult a CPA.
Schools (NCES district)
- District
- New Hanover County Schools
- NCES district ID
- 3703330
- Math proficiency
- 48% ▼ -3.00%
- Reading proficiency
- 53% ▬ 0.00%
- Median HH income
- $49,406
- Composite
- 43.13/100
- National rank
- #3081
- State rank
- #61 of 178 in NC
Livability — Wilmington
- Score
- 70/100
- State rank
- #142
- US rank
- #8131
Category grades
Schools grade is shown separately in the Schools card above.
Census & demographics
- Census place
- Wilmington, NC
- County
- New Hanover County · 232,153 people
- City population
- 215,355
- Metro
- Wilmington, NC
- Population (ZIP)
- 22,007
- Household income
- $57,968
- Rent vs Own
- Severe rent burden
- 1696.0
Population outlook (New Hanover County) Hauer SSP2
- Today (2025)
- 259,517 people
- By 2030
- 279,586 · +7.7%
- By 2040
- 318,223 · +22.6%
- By 2050
- 354,831 · +36.7%
- By 2075
- 437,158 · +68.5%
- By 2100
- 486,769 · +87.6%
Race, ethnicity, and origin ACS 2023
- Neighborhood character
- Diverse neighborhood (Simpson 0.61)
- Race & ethnicity
- White 52% Black 33% Hispanic / Latino 9% Two or more races 7%
- Hispanic origin (detail)
- Mexican 5% Puerto Rican 1%
- Common ancestry
- Romanian 2% Serbian 2% Lithuanian 2%
- Foreign-born
- 6% · Canada
- Languages at home
- 91% English-only · Spanish 7% Other Indo-European 1%
Political lean MEDSL · New Hanover
- 2024 margin
- Toss-up / Even · D 49.8% · R 49.1% · Other 1.1%
- 2008→2024 swing
- +2.0pp toward D · 2008: -1.4pp · 2024: 0.6pp
- All cycles
- 2024: D+0.6 2020: D+2.1 2016: R+4.1 2012: R+4.7 2008: R+1.4
Not yet ingested
- Civics
- —
Market trends
- HPI YoY
- ▼ -309.34%
- Current HPI
- 293.4396
- Rent YoY
- ▼ -0.52%
- Metro
- Wilmington, NC
- State GDP YoY
- ▲ 3.28%
- F500 in state
- 26
Industry mix (Fortune 500 HQ in NC)
| Industry | F500 HQs | Revenue |
|---|---|---|
| Financial Services | 2 | $213B |
|
||
| Retail | 2 | $95B |
|
||
| Industrial Conglomerate | 1 | $38B |
|
||
| Metals / Steel | 1 | $35B |
|
||
| Utilities | 1 | $30B |
|
||
| Industrial Machinery | 1 | $19B |
|
||
Price history
+222.6% since first listed15 events — show timeline
- 2025-11-03 Price Changed $183,900 Hive MLS
- 2025-09-12 Relisted — Hive MLS
- 2025-06-18 Pending — Hive MLS
- 2025-02-17 Listed $194,900 Hive MLS
- 2023-11-30 Rental Removed $1,650 APPFOLIO
- 2023-09-30 Price Changed $1,650 APPFOLIO
- 2023-09-28 Listed for Rent $1,500 APPFOLIO
- 2019-01-16 Sold (MLS) $70,000 Hive MLS
- 2018-12-04 Listed $69,900 Hive MLS
- 2015-08-31 Sold (MLS) $24,899 Hive MLS
- 2015-01-20 Listed $25,600 Hive MLS
- 2014-08-21 Listing Removed — Hive MLS
- 2012-10-03 Listed $43,000 Hive MLS
- 2011-07-17 Listing Removed — Hive MLS
- 2010-06-16 Listed $57,000 Hive MLS
Property tax history
-6.0%/yrLatest (2025): $803 · -5.9% YoY. Source: county tax records.
Cash-flow waterfall
monthlySold comps — $/sqft
last 12 mo · ≤1 miLoading sold comps…